

Non-technical summary
Drugs of the opiate class produce analgesia and are addicting. These drugs act at molecular targets called opioid receptors and modify the connections between nerve cells. In this paper we show that stress alters the function of one of these receptors, the δ opioid receptor. Opioid receptors typically decrease neural signaling; however, following stress, δ opioid receptor activation increases neural signalling. This enhancement of signalling was observed at inhibitory synapses on midbrain dopamine neurons. These neurons, and the control of their inhibitory inputs by opiates, have been implicated in the addicting power of opiate drugs such as morphine.
Abstract
Abstract
Opioid receptors are G-protein-coupled receptors (GPCRs) that modulate synaptic function. Depending upon their nervous system site of action, opioid receptor agonists alter food consumption, pain perception, responses to stress, and drug reward. Opioid receptors signal primarily via Gi/o-proteins that modulate ion channels to directly inhibit neurons or decrease neurotransmitter release from nerve terminals. Here we report that following stress, activating δ opioid receptors (DORs) on midbrain ventral tegmental area (VTA) neurons causes a novel synaptic effect: the augmentation of GABAA receptor (GABAAR)-mediated inhibitory postsynaptic currents. Most neurons showing this augmentation were identified as dopaminergic. In addition, in both stressed and unstressed animals, DOR activation decreases GABAAR currents in some VTA neurons. Surprisingly, both augmentation and inhibition were also observed when we bypassed the presynaptic terminal by iontophoretically applying GABA, indicating that postsynaptic mechanisms are responsible for both effects. Using a variety of blockers we determined that the augmentation is probably due to insertion of GABAARs into the synapse by a mechanism that is G-protein independent and mediated by activation of Akt via PI3K. GABAARs are inserted into the extra-synaptic plasma membrane before trafficking to the synapse, a mechanism consistent with our observation that the DOR-mediated increase in GABAAR signalling occurs significantly earlier in iontophoretically applied than in electrically evoked synaptic GABA. This G-protein-independent signalling pathway is not only a novel mechanism of opioid receptor-mediated inhibition, but it also represents the first reported link between activation of a GPCR and insertion of GABAARs into the plasma membrane.
Introduction
There are four members of the opioid family of GPCRs: the μ (MOR), DOR, κ (KOR) and orphanin-like receptor, all of which are expressed in the central nervous system. Most of the known neural actions of opioid receptors require G-protein activation, typically of the Gi/o type (Law et al. 1981; Abood et al. 1985; Iegorova et al. 2010). Gi/o protein activation by opioids in turn leads to direct postsynaptic inhibition of neurons through the opening of inwardly rectifying K+ (GIRK) channels or to presynaptic inhibition of neurotransmitter release (see Williams et al. 2001 for review). Gi/o activation also inhibits the second messenger adenylyl cyclase which modulates several membrane currents including a hyperpolarization-activated cation current (Ih) and a tetrodotoxin-resistant sodium current (Ingram & Williams, 1994; Gold & Levine, 1996), and can activate protein kinase C (PKC) and mitogen-activated protein kinase (Chen & Huang, 1991; Fukuda et al. 1996).
Unlike MOR and KOR, which exhibit robust synaptic and behavioural effects in otherwise untreated animals, many DOR synaptic actions only appear following challenges such as inflammation, stress and administration of rewarding drugs, leading to presynaptic inhibition by DOR of neurotransmitter release (Hack et al. 2005; Gendron et al. 2006; Ma et al. 2006; Margolis et al. 2008a; Bie et al. 2009a,b;). Such up-regulation in receptor function can dramatically change the behavioural impact of DOR activation (Overland et al. 2009). Unlike the typical opioid presynaptic inhibition of neurotransmitter release, here we demonstrate that DOR activation can postsynaptically increase synaptic GABAAR signalling in ventral tegmental area (VTA) neurons of stressed rats. This pathway represents a novel opioid and GPCR synaptic mechanism: G-protein-independent recruitment of GABAARs to the synapse. We also found that DOR activation can postsynaptically decrease GABAAR signalling through a G-protein-independent pathway.
Methods
Animals
Experiments were conducted in accordance with the Guide for the Care and Use of Laboratory Animals (NIH), and were approved by the EGCRC Committee on Animal Research. The authors have read, and the experiments comply with, the policies and regulations of The Journal of Physiology given by Drummond (2009). Animals were never food or water deprived. Male Lewis rats (Harlan Laboratories; 275–300 g) were housed individually in a temperature-controlled colony room (70°C) on a 12 h reversed light–dark cycle (lights off at 10.00 am).
Footshock stress (0.8 mA for 0.5 s every 40 s for 15 min) was administered every day for 7 days (09.00 am) in operant chambers fitted with stainless steel, electrically scrambled grid floors (Med Associates). The final session of footshock stress directly preceded the electrophysiological experiment.
Corticosterone (Cort) was measured using a commercially available enzyme immunoassay kit (Assay Designs, MI, USA) from the plasma of trunk blood collected at time of killing. Following incubation with a polyclonal antibody and enzyme substrate (p–nitrophenyl phosphate) optical density was used to calculate [Cort].
Slice preparation and electrophysiology
Rats were anaesthetized with isoflurane and their brains were removed. Horizontal brain slices (200 μm thick) containing the VTA were prepared using a vibratome (Leica Microsystems). Slices were submerged in artificial cerebrospinal fluid solution containing (in mm): 126 NaCl, 2.5 KCl, 1.2 MgCl, 1.4 NaH2PO4, 2.5 CaCl2, 25 NaHCO3 and 11 glucose saturated with 95% O2-5% CO2, and allowed to recover at 32°C for at least 1 h. Individual slices were visualized using a Zeiss Axioskop microscope with differential interference contrast optics and infrared illumination. Photographs of each recorded neuron (400× magnification) and its location in the slice (25× magnification) were collected prior to patching onto the cell using Axiovision 4 software (Zeiss). Whole cell patch-clamp recordings were made at 32°C using 3-5 MΩ pipettes containing (in mm): 128 KCl, 20 NaCl, 1 MgCl2, 1 EGTA, 0.3 CaCl2, 10 Hepes, 2 MgATP and 0.3 Na3GTP (pH 7.2, osmolarity adjusted to 275 mosmol l−1), plus 0.1% biocytin to label the recorded neuron. Neurons were recorded from throughout the VTA and no a priori criteria were used to select neurons. Signals were amplified using an Axopatch 1D amplifier (Molecular Devices), filtered at 2 kHz, and collected at 5 kHz using IGOR Pro (Wavemetrics). Ih was measured in every cell by voltage clamping cells and stepping from −60 to −40, −50, −70, −80, −90, −100 and –120 mV. Neurons were considered Ih lacking (Ih(-)) if the slope of the I–V curve for hyperpolarizing steps from −60 to −90, −100, −110 and −120 mV was ≤0. Cells were recorded in voltage-clamp mode (V = −70 mV). In two neurons, leakage of GABA from the iontophoresis pipette (see below) produced a tonic current that interfered with the Ih measurement, and therefore these two neurons were not classified as either Ih(+) or Ih(−) in Table 2. Series resistance and input resistance were sampled throughout the experiment with 4 mV, 200 ms hyperpolarizing steps. For all experiments, neurons in which there was change in series resistance of either more than 5 MΩ or 15% of baseline were excluded from analysis. GABAA R-mediated inhibitory postsynaptic currents (IPSCs) were pharmacologically isolated with 6,7-dinitroquinoxaline-2,3(1H,4H)-dione (DNQX: 10 μm), strychnine (1 μm) and sulpiride (10 μm). Stimulating electrodes were placed 80-250 μm away from the soma. IPSCs were measured in response to paired pulses (50 ms interval) delivered once every 10 s. Amplitudes were calculated by comparing a 2 ms period around the peak to a 2 ms interval just before stimulation. The paired-pulse ratio (PPR) was calculated by dividing the amplitude of the second IPSC by that of the first, after averaging together eight trials. Spontaneous events were detected by searching the smoothed first derivative of the data trace for values that exceeded a set threshold, and these events were confirmed visually. GABA (100 mm, pH adjusted to 4.9 with 37% HCl) was prepared daily for iontophoresis. A GABA-containing pipette was positioned approximately 200 μm away from the recorded neuron. Negative retention current (−50 pA) was applied to the GABA pipette, interrupted by positive ejection current pulses (100 ms) once every 30 s, with the intensity adjusted so that the response amplitude was in the range of 100-300 pA. Initial experiments were completed blind to shock vs. sham vs. untreated conditions.
Table 2.
Neural properties do not predict the DPDPE-induced changes in GABAAR signalling in VTA neurons from stressed animals
| DPDPE inhibition of GABAAR signalling | DPDPE augmentation of GABAAR signalling | No change with DPDPE in GABAAR signalling | F | P | |
|---|---|---|---|---|---|
| TH(+) | 2/6 | 4/5 | 2/5 | — | 0.24 |
| Ih(+) | 8/12 | 8/9 | 5/7 | — | 0.19 |
| Ih magnitude (step to −120 mV; pA) | 167 ± 86 | 79 ± 33 | 69 ± 51 | 0.57 | 0.58 |
| Neuron size (μm2) | 211 ± 18 (n = 9) | 189 ± 33 (n = 9) | 170 ± 19 (n = 3) | 0.39 | 0.68 |
| sIPSC amplitude (pA) | 28 ± 3 (n = 9) | 24 ± 3 (n = 9) | 26 ± 5 (n = 3) | 0.45 | 0.65 |
| sIPSC frequency (Hz) | 1.7 ± .2 (n = 9) | 1.3 ± .4 (n = 9) | 2.8 ± 1.9 (n = 3) | 1.26 | 0.31 |
| Evoked IPSC amplitude (pA) | 170 ± 25 (n = 12) | 125 ± 21 (n = 10) | 247 ± 67 (n = 8) | 2.41 | 0.11 |
| Evoked IPSC τweighted | 0.0122 ± .0009 (n = 12) | 0.0116 ± .0010 (n = 10) | 0.0144 ± .0022 (n = 8) | 1.09 | 0.35 |
| Ri | 480 ± 110 (n = 12) | 380 ± 50 (n = 10) | 660 ± 150 (n = 8) | 1.55 | 0.23 |
| Holding current (pA) | –48 ± 22 (n = 12) | –37 ± 21 (n = 10) | –84 ± 52 (n = 8) | 0.56 | 0.58 |
| Paired-pulse ratio | 0.94 ± .11 (n = 12) | 1.04 ± .07 (n = 10) | 1.03 ± .12 (n = 8) | 0.31 | 0.73 |
| GABA iontophoresis amplitude (pA) | 182 ± 42 (n = 8) | 119 ± 17 (n = 5) | n/a | 1.29 | 0.28 |
Immunocytochemistry
Wherever possible, Ih(+) neurons were cytochemically processed for tyrosine hydroxylase (TH) content as a marker for dopamine neurons; however, TH(−) and unidentified neurons were not excluded from analyses. In most cases, Ih(−) neurons were not tested for TH content because we previously reported that in rats all Ih(−) neurons we tested with immunocytochemistry were TH(−) (Margolis et al. 2006b). Following electrophysiology, slices were immediately fixed in 4% formaldehyde for 2 h and then stored at 4°C in PBS. Slices were pre-blocked for 2 h in PBS plus 0.3% (v/v) Tween, 0.2% BSA and 5% normal goat serum and then incubated at 4°C with a rabbit anti-tyrosine hydroxylase polyclonal antibody (1:100) for 48 h. The slices were then washed thoroughly in PBS with 0.3% Tween and 0.2% (w/v) BSA before being agitated overnight at 4°C with Cy5 or FITC anti-rabbit secondary antibody (1:100) and fluorescein (DTAF)-conjugated streptavidin (3.25 μl ml−1). Sections were rinsed and mounted on slides using BioRad Fluoroguard Antifade Reagent mounting media and visualized under a Zeiss LSM 510 META microscope. Primary and secondary antibodies were obtained from Millipore and Jackson ImmunoResearch Laboratories, respectively. It should be noted that due to the high [Cl−] in the internal solution utilized for these experiments, some TH(−) neurons could in fact be false negatives (Margolis et al. 2010).
All other chemicals were obtained from Sigma or Tocris except for TIPP-Ψ, which was acquired from NIDA, and AKT-VIII, which was purchased from Chemdea.
Data analysis
The cross-sectional areas of recorded neurons were measured off-line from photographs taken of recorded neurons as described above. Axiovision 4 was calibrated with a micrometer and the soma outline was carefully traced by hand using the measurement module in Axiovision, yielding the cross-sectional area of the recorded neuron.
The time constant (weighted τ) of the evoked IPSC was determined by fitting the decay phase of the IPSC from 90% of the peak to baseline with a double exponential. The weighted τ was then calculated as:
| (1) |
where A1 and A2 are the fractions of the fast and slow components of the decay, and τ1 and τ2 are the corresponding decay time constants.
All recorded VTA neurons in which an experiment was successfully completed are reported here. Drug effects were measured by comparing the 4 min of baseline just preceding drug application to minutes 4-7 following the onset of drug application. Unpaired t tests were performed on the same data points to determine whether or not the drug induced a significant change. IPSC data were binned into 30 s bins for time course figures. The onset of drug effect times was calculated by fitting the raw experimental data with sigmoid curves covering the last 4 min of baseline data to minute 7 of drug application. Baseline and effect size were normalized for ease of visualization in Fig. 6 insets. Statistical tests on these data were performed by determining the delay from the onset of the DPDPE application to the time of the 50% drug effect for each cell and then comparing these delays between the GABA iontophoresis experiments and the evoked IPSC experiments. For evaluating the properties of the different subpopulations of neurons or different treatment groups, categorical data were evaluated using two-tailed Fisher exact tests and interval data were compared by ANOVA, followed by the Student-Newman-Keul's test where required. We tested whether stressing the rats shifted the categories of observed DPDPE effects with a two-tailed Fisher exact test, and tested whether the mean DPDPE effect was different using a two-tailed permutation analysis. For statistical analysis of whether or not different blockers interfered with the DPDPE-induced augmentations of GABAAR signalling, we used Fisher exact tests to determine if there was a shift of DPDPE effects to fewer augmentations, and a permutation analysis to determine if the mean of the observations in the blocker groups were outside the expected range of possible means given the DPDPE responses in the control aCSF condition. In both cases one-tailed test results are presented, as the hypothesis being tested is directional: Did these blockers shift the population of responses away from augmentations toward inhibitions? For Fisher exact tests, categorizations of responses were based on the within cell statistics described above. The permutation analysis was completed twice for each blocker condition, once including all data, and once including only data from animals that had blood [Cort] above the median, in which the frequency of DPDPE-induced augmentations was higher in aCSF experiments (see Fig. 2). As the changes in evoked ISPCs and GABA iontophoresis in response to DPDPE were not independent but were correlated (Fig. 4G), only one measure per neuron was included in these analyses, and in any neuron where both evoked IPSC and GABA iontophoresis data were available, the evoked IPSC data were used in the statistical test because this measure more closely represents what is happening at the synapse. Statistics were calculated with SigmaStat software (SPSS) and Matlab (Mathworks), and their applicability for these data was confirmed through consultation with the UCSF Clinical & Translational Science Institute (CTSI) biostatistics service. For figures, displayed example individual evoked IPSCs are averages across eight consecutive evoked events.
Figure 6. The time courses of evoked IPSC and GABA iontophoresis show that the change in GABAAR signalling is detectable in GABA iontophoresis prior to the change in evoked IPSCs.

A, individual trial examples of evoked IPSCs (top) and iontophoresis (middle) correspond to the indicated time points (bottom) from a single neuron. In this neuron, the DPDPE-induced change in GABAAR signalling commences over 1 min earlier in the GABA iontophoresis measurements (filled squares) than in the evoked IPSC measurements (open circles). B, summary across all neurons with DPDPE-induced augmentations of GABAAR signalling shows a change in the iontophoretic amplitude prior to that in the evoked IPSC amplitude across all neurons. Inset, sigmoid fits of the onset of DPDPE effects in each of the evoked IPSC data (grey) and GABA iontophoresis (black) experiments showing that the effect occurs earlier in GABA iontophoresis experiments compared to evoked IPSC experiments. C, in neurons where DPDPE caused an inhibition of GABAAR signalling, the time courses of the changes in GABA iontophoresis and electrically evoked IPSC amplitudes are overlapping. Inset, the timing of the fitted sigmoid curves of the drug effect onsets are overlapping for GABA iontophoresis and evoked IPSCs among DPDPE-mediated inhibitions.
Figure 2. Footshock stress causes an increase in blood Cort levels, and elevated Cort increases the probability of observing a DOR-mediated increase in GABAAR signalling.

A, Cort levels in stressed animals were significantly elevated compared to Cort levels in control, untreated animals. Blood Cort levels were sampled when animals were killed for recordings. B, when rats in the stress group are divided by a median split according to Cort values, there is a significant difference between the mean DPDPE effects in the two groups, with the vast majority of DPDPE-induced increases in GABAAR signalling occurring in neurons from animals with higher Cort. *P < 0.05, **P < 0.0005.
Figure 4. DORs modulate VTA GABAAR signalling postsynaptically.
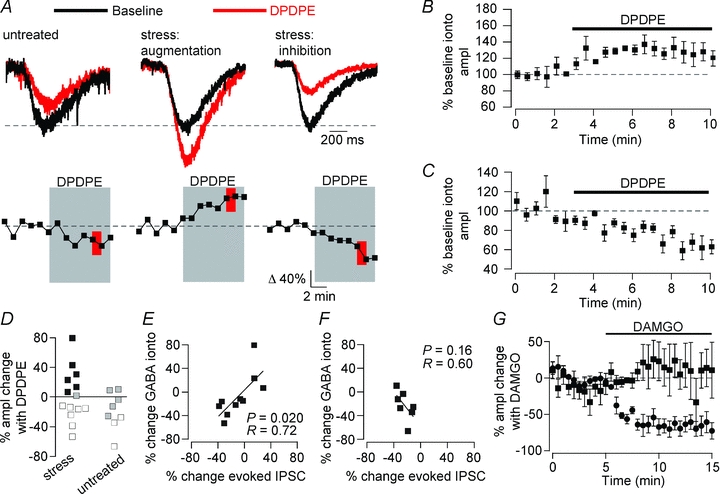
GABA was iontophoresed onto the recorded neuron in order to directly test GABAAR function independent of terminal release probability. A, top: example responses to GABA iontophoresis during baseline and in the presence of DPDPE (1 μm); bottom: time course of DPDPE-elicited change in GABAAR response in the same example neurons. In stressed, but not untreated, rats DPDPE caused a significant increase (P < 0.05, red) in responses to GABA iontophoresis, indicating a postsynaptic site of action of DPDPE. B, population time course data across all neurons with a significant increase in GABA iontophoresis response with DPDPE (n = 6). C, population time course data across all neurons from stressed animals where DPDPE significantly decreased the amplitude of the response to GABA iontophoresis. D, distributions of changes in responses to GABA iontophoresis. Filled symbols, augmentation (P < 0.05); open symbols, inhibition (P < 0.05); grey symbols, no change (P > 0.05). The DPDPE-induced change in GABA iontophoresis amplitude correlated with the change in evoked GABAAR-mediated IPSCs when both were measured in the same neuron from stressed E, but not untreated F, animals. G, the μ opioid agonist DAMGO caused a decrease in the evoked IPSC amplitude (filled circles), but did not change the GABA iontophoresis amplitude (filled squares), indicating a presynaptic site of action (n = 5).
Results
We made whole cell recordings in brain slices containing the VTA from adult rats that received 7 days of moderate footshock. Pharmacologically isolated, electrically evoked IPSCs and spontaneous IPSCs were recorded in voltage-clamp mode (Vm = −70 mV). These IPSCs were completely blocked by the GABAAR Cl− channel blocker picrotoxin (100 μm; 93.8 ± 1.8% evoked IPSC blocked; n = 5) or the GABAAR antagonist gabazine (10 μm; 97.6 ± 0.9% evoked IPSC blocked; n = 5). No differences in baseline GABAAR signalling were observed in neurons from stressed animals compared to sham or untreated controls (Table 1). In VTA neurons from untreated controls, bath application of the DOR selective agonist DPDPE (1 μm) produced a small but significant inhibition of evoked IPSC amplitude (Fig. 1A, B and C; 13 neurons from 8 rats). Following stress the small DOR-mediated inhibition was still observed in some neurons; however, in addition, a dramatically different type of GABAAR response to DPDPE appeared in other VTA neurons: in 30% of neurons DPDPE significantly increased the amplitude of evoked GABAAR-mediated IPSCs (Fig. 1A, B and C; P < 0.05 Fisher exact test on effect type vs. animal treatment). This stress-induced change in DPDPE effect significantly increased the variance of the population response to DPDPE (P < 0.05, Levene's test) and significantly shifted the mean DPDPE response (P < 0.05, one-way ANOVA). The 30 neurons comprising the data collected from stressed animals were from 16 different animals and one to three neurons were recorded per animal (1.9 ± 0.2 neurons recorded per animal). Augmentations were observed in neurons from 9 out of the 16 stressed animals; more than one neuron was recorded from seven of these animals and in each of these cases other cells from the same animal exhibited either no significant change or inhibitions, showing that DPDPE effects are not uniform across all VTA neurons within a single animal. However, to confirm that a stress response does increase the proportion of VTA neurons showing augmented GABAAR signalling with DOR activation, we divided the stressed animals using a median split based on blood Cort levels sampled at the time of killing for the electrophysiological experiments. We found that the vast majority of augmentations occurred in neurons from animals with high Cort, while inhibitions were predominant in neurons from animals with lower Cort, and the mean DPDPE effects were significantly different between these two groups (DPDPE effect in neurons from animals with [Cort] above the median 20 ± 7% evoked IPSC amplitude change; from animals with [Cort] below the median −21 ± 5% evoked IPSC amplitude change; P = 0.000012, two-tailed, one-way ANOVA median [Cort] = 6.66 μg/100 mL; Fig. 2).
Table 1.
Baseline GABA release properties in VTA neurons do not change with acute stress
| Paired-pulse ratio | sIPSC frequency (Hz) | sIPSC amplitude (pA) | |
|---|---|---|---|
| Untreated | 0.89 ± 0.08 (n = 13) | 4.3 ± 2.1 (n = 13) | 22 ± 3 (n = 13) |
| Sham stress | 1.05 ± 0.13 (n = 6) | 1.6 ± 0.4 (n = 7) | 28 ± 5 (n = 7) |
| Footshocked | 0.99 ± 0.06 (n = 30) | 1.8 ± 0.3 (n = 27) | 27 ± 2 (n = 27) |
| F value | 0.66 | 1.77 | 1.09 |
| P value | 0.52 | 0.16 | 0.35 |
Figure 1. Stress changes DOR signalling in the VTA.

Aa, examples of traces from individual neurons. Time course of drug effect from the same example neuron displayed both as individual measurements (Ab) and in 30 s bins (Ac). Grey boxes: application of DPDPE (1 μm). Red boxes: time of DPDPE trace displayed in Aa. In unstressed rats receiving no treatment, the DOR agonist DPDPE caused minimal inhibition of electrically evoked GABAAR signalling. Following stress, DPDPE caused a significant increase in GABAAR signalling in 30% of VTA neurons. For sham-stress rats the shock grid was disconnected. B, summary time course data across the different labelled populations of neurons. C, distributions of DPDPE effects from each condition; open symbols, decrease (within neuron ANOVA, P < 0.05); black symbols, increase (P < 0.05); grey symbols, no significant change. Far right: the DOR selective antagonist TIPP-Ψ (500 nm) blocked the DPDPE effects in neurons from stressed rats. D, locations of the neurons recorded in horizontal brain slices containing the VTA with the effect type coded in grayscale as in C. MT, medial terminal nucleus of the accessory optic tract; mt, mammillary tract; IPF, interpeduncular fossa.
Most of the neurons showing this augmentation in GABAAR signalling in response to DPDPE were immunopositive for TH (4/5 successfully recovered), a marker for dopamine neurons (Table 2). The anatomical location of each recorded neuron in this experiment is indicated in Fig. 1D. Other baseline physiological or anatomical properties did not predict the response of a neuron to DPDPE (Table 2). Both augmentations and inhibitions produced by DPDPE in the stressed rats were blocked by the DOR selective antagonist TIPP-Ψ (500 nm; Fig. 1C), confirming that both are due to DOR activation. In sham controls placed in the shock chamber with the shock grid disconnected, DPDPE modestly inhibited GABAAR signalling in VTA neurons (Fig. 1A and C). No neurons from sham-treated rats showed augmentations in response to DPDPE, and the magnitudes of the inhibitions were not statistically different from those in neurons from untreated rats (P = 0.13, one-way ANOVA; 6 neurons from 4 rats). Importantly, Cort levels in sham-treated rats were not elevated above control rats (Fig. 2A). Therefore, the DPDPE-induced increase in GABAAR signalling requires significant stress, and handling or contextual novelty are insufficient to produce either the physiological change or the increase in Cort.
Given that opioid receptor activation, including DOR activation, can presynaptically inhibit GABA release in many brain regions including the VTA (Margolis et al. 2008a), we tested whether DPDPE caused changes in PPR or sIPSCs that would indicate that the observed inhibitions or augmentations were due to presynaptic changes in the probability of neurotransmitter release. We found no significant correlation between the change in PPR and the change in evoked IPSC amplitude (Fig. 3A, r = 0.28 P = 0.13, n = 30). Testing augmentations and inhibitions separately also did not reveal changes in PPR among neurons with significantly augmented or inhibited evoked IPSC amplitudes (P = 0.74, paired t test, n = 10; P = 0.11, paired t test, n = 12, respectively), nor was there a relationship between change in PPR and evoked IPSC amplitude in either subset of neurons (augmentations r = 0.35, P = 0.33, n = 10; inhibitions r = 0.06, P = 0.85, n = 12). In neurons from stressed animals, there was no mean change in sIPSC frequency or amplitude with DPDPE (baseline frequency 1.7 ± 0.3 Hz, DPDPE frequency 1.5 ± 0.2 Hz, P = 0.27, n = 24; baseline amplitude 27.3 ± 2.2 pA, DPDPE amplitude 28.4 ± 2.6 pA, P = 0.50, n = 24). Again, we did not find a correlation between the DPDPE-induced change in sIPSC frequency and the change in evoked IPSC amplitude (Fig. 3B, r = 0.20, P = 0.41, n = 19); nor did DPDPE cause a shift in the mean sIPSC frequency in the subset of neurons with significant augmentations (P = 0.69, paired t test, n = 8) or yield a change that correlated with the change in evoked IPSC amplitude (r = 0.30, P = 0.47, n = 8). Similarly, there was no change in sIPSC frequency among neurons with significant inhibitions of evoked IPSCs (P = 0.54, paired t-test, n = 8) but there was a trend towards a correlation between the inhibition of evoked IPSC amplitude and sIPSC frequency (r = 0.66, P = 0.08, n = 8). Finally, while there was also no relationship between the DPDPE-elicited change in sIPSC amplitude and that in evoked IPSC amplitude across all neurons or among neurons with significant inhibitions of evoked IPSCs (Fig. 3C; all neurons r = 0.28, P = 0.24, linear regression, n = 19; inhibitions P = 0.63 paired t test, r = 0.13, P = 0.76 linear regression, n = 8), there was a trend toward an increase in sIPSC amplitude in neurons where the evoked IPSC amplitude increased (P = 0.06 paired t test, r = 0.35; P = 0.4 linear regression, n = 8). Together, these data do not support the hypothesis that either the DPDPE-mediated increases or decreases in GABAAR signalling are due to effects on neurotransmitter release, therefore raising the possibility that these effects are primarily postsynaptic.
Figure 3. There is no relationship between DPDPE-induced changes in measures of probability of release and evoked GABAAR IPSC amplitudes.

A, change in evoked IPSC amplitude plotted against PPR. A shift towards paired-pulse depression would be expected with an increase in probability of release. B, changes in evoked IPSC amplitude plotted against the change in sIPSC frequency in response to DPDPE. Changes in probability of release should also be reflected in changes in sIPSC frequency. C, changes in evoked IPSC amplitude plotted against the change in sIPSC amplitude with DPDPE. Cells are colour-coded by within cell statistics on evoked IPSC changes in response to DPDPE: open symbols, significant decrease; black symbols, significant increase; grey symbols, no change. Crosshairs indicate the mean ± SEM among neurons with either significantly decreased (open) or significantly increased (black) evoked ISPCs.
To directly test whether postsynaptic DOR activation increases GABAAR signalling, we measured GABAAR-mediated responses to iontophoretically applied GABA in either stressed or untreated rats (Fig. 4). GABAAR responses were isolated by including the GABABR antagonist CGP35348 in the aCSF (50 μm); the remaining iontophoretic GABA signal was antagonized by picrotoxin (100 μm; 88.4 ± 10.0% blocked, n = 5) or gabazine (10 μm; 96.4 ± 1.5% blocked, n = 6). In several cases, both electrically and iontophoretically evoked responses were collected in the same neuron. Consistent with postsynaptic sites of action, DPDPE elicited both increases and decreases in the amplitude of the responses to GABA iontophoresis in VTA neurons from stressed rats (Fig. 4A–D). Although DPDPE induced similar inhibitions of iontophoretic GABAAR currents in stressed rats and untreated rats, augmentations were only observed in stressed rats (Fig. 4D). In neurons where the electrically evoked GABAAR signal was augmented by DPDPE, the response to GABA iontophoresis was concurrently increased, and in neurons where the electrically evoked IPSCs were inhibited, the iontophoretic response also decreased. In fact, there was a significant positive correlation between these two measures across the full range of DPDPE effects with a slope of 1 (slope = 1.0 ± 0.4, Fig. 4E), confirming that the changes observed in the evoked IPSC experiments are indeed due to a change in postsynaptic GABAAR signalling. There was no such relationship in neurons from untreated rats (Fig. 4F).
To confirm that presynaptic opioid receptor activation can change the evoked IPSC amplitude without affecting the GABA iontophoresis signal, we tested VTA neurons from untreated rats with the MOR selective agonist DAMGO, which has been shown to inhibit evoked IPSCs onto VTA neurons by decreasing the probability of release at presynaptic GABA terminals (Margolis et al. 2008a). In the present experiments, DAMGO (500 nm) caused a large decrease in the amplitude of evoked IPSCs, but no concurrent change in the response to GABA iontophoresis (Fig. 4G), confirming that these two experimental measures can respond independently when GABA release is presynaptically inhibited.
We next investigated the signalling pathway elements underlying DOR activation that results in an increase in GABAAR signalling. For these experiments, 77% of the rats used had blood Cort levels above 6.66 μg/100 mL, increasing the likelihood of observing DPDPE-induced increases in GABAAR signalling if the probed signalling pathway element did not contribute to this synaptic effect. Two possibilities for the increase in GABAAR currents are an increase in the number of GABAARs available in the synapse to signal, or an increase in GABAAR Cl− conductance. We chose to first investigate the former possibility. We tested whether blocking GABAAR insertion blocked the DOR-mediated augmentation of GABAAR signalling with N-ethylmaleimide (NEM), which blocks the NEM-sensitive fusion factor (NSF), thus preventing the docking and fusion of vesicles delivering new GABAARs to the cell membrane (Zhao et al. 2007). Intracellular delivery of NEM (50 μm) through the recording pipette prevented the DOR-mediated enhancement of GABAAR signalling (P = 0.057, Fisher exact test; P = 0.021, permutation analysis; P = 0.002, permutation analysis limited to data from rats with elevated [Cort]; Fig. 5). Because of the possibility of non-selective actions of NEM (Asano & Ogasawara, 1986), we also tested whether the augmentation was blocked with brefeldin A, which prevents vesicles, including those containing GABAARs, from exiting the Golgi complex to traffic to the plasma membrane by inhibiting the function of brefeldin A-inhibited guanine nucleotide-exchange protein 2 (BIG2) (Charych et al. 2004). When the neurons were loaded with brefeldin A (200 nm) through the recording pipette, the augmentations were also abolished (P = 0.057, Fisher exact test; P = 0.007, permutation analysis; P = 0.002, permutation analysis limited to data from rats with elevated [Cort]; Fig. 5). These observations directly support the hypothesis that the increase in GABAAR signalling we observed with DOR activation is due to the insertion of GABAARs in the plasma membrane.
Figure 5. DOR activation causes postsynaptic insertion of GABAARs through G-protein-independent activation of the PI3K–Akt pathway.

Changes in evoked IPSC or GABA iontophoresis amplitude in response to DPDPE (1 μm) in the presence of different pathway blockers. In some cases evoked and iontophoresis data were collected in the same neuron. NEM (n = 8 neurons) and brefeldin A (n = 7), which block vesicle trafficking, blocked augmentations of GABAAR signalling. Alternatively, incubating the slices in the protein kinase inhibitor H7 (n = 8) or the PKC inhibitor BIS-1 (n = 5) diminished the DPDPE-induced inhibitions. The PI3K blockers wortmannin (wort; n = 8) and LY249002 (n = 10) blocked DOR-mediated augmentations of GABAAR signalling. The Akt1,2 blocker AKT inhibitor VIII also prevented DPDPE-mediated increases in GABAAR signalling (n = 7). GDP-β-S, which blocks G-protein signalling, did not change DPDPE responses in stressed rats (n = 13). Dynasore, which inhibits dynamin-mediated endocytosis, did not alter DPDPE signalling (n = 6). Open symbols, decrease (P < 0.05); black symbols, increase (P < 0.05); grey symbols, no change.
GABAARs are typically inserted into the plasma membrane extra-synaptically prior to being transported to the synapse (Thomas et al. 2005; Bogdanov et al. 2006). As the iontophoretic signal reflects both extra-synaptic and synaptic GABAARs, while evoked IPSCs are mainly synaptic events, the increase in GABA iontophoresis amplitude should appear prior to the increase in evoked IPSC amplitude (if the transport from extra-synaptic to synaptic sites is sufficiently slow compared to our sampling rate). We analysed the time for the DPDPE effect to reach its half-maximal response in each individual cell by fitting the raw data with a sigmoid curve. Across neurons with augmented GABAAR signalling, the half-maximal response was reached significantly earlier in the iontophoresis responses compared to the evoked IPSC responses (iontophoresis: 1.0 ± 0.4 min; evoked IPSC: 3.6 ± 0.7 min; P < 0.05, two-tailed, one-way ANOVA; Fig. 6A and B). This was not the case for the inhibitions (P > 0.05, two-tailed, one-way ANOVA; Fig. 6C). Therefore, the timing of the DPDPE-induced increases in GABAAR signalling is also consistent with DOR activation causing insertion of GABAARs into the plasma membrane.
We next wanted to determine which kinase(s) might be involved in this signalling pathway. Opioid receptors can activate serine/threonine kinases, and so we first tested the non-selective serine/threonine kinase inhibitor by including H7 in our recording pipette solution (10 μm). While the DPDPE-mediated augmentations appeared to remain intact (P = 0.51, Fisher exact test; P = 0.70, permutation analysis; P = 0.26, permutation analysis limited to data from rats with elevated [Cort]; Fig. 5), H7 treatment minimized DPDPE-mediated inhibitions. As H7 is not a very selective compound, we also tested the effect of incubating the slices in the PKC inhibitor bisindolylmaleimide I (BIS; 1 μm; mean incubation, 49 ± 3 min) prior to recording. This treatment also did not block the DPDPE-induced increases in GABAAR signalling (P = 0.31, Fisher exact test; P = 0.93, permutation analysis; P = 0.62, permutation analysis limited to data from rats with elevated [Cort]; Fig. 5), but also appeared to diminish DPDPE-induced inhibition of GABAAR signalling in stressed animals.
In spite of the H7 results, another protein kinase that could potentially contribute to the augmentations is the serine/threonine kinase Akt (protein kinase B), particularly because the PI3-Akt pathway promotes membrane insertion of GABAARs, possibly through direct phosphorylation of the receptors (Wang et al. 2003). GPCRs can activate Akt (Murga et al. 2000) and, in cell culture, opioid receptors can activate Akt and its upstream kinase PI3K (Shahabi et al. 2006; Onali et al. 2010; Olianas et al. 2011a,b;). We therefore tested whether activation of the PI3K–Akt pathway by DORs leads to the stress-induced augmentation of GABAAR signalling. We measured evoked IPSCs following incubation of VTA slices from stressed rats with two different PI3K inhibitors: LY249002 (10 μm, mean incubation, 50 ± 6 min prior to DPDPE) or wortmannin (500 nm, mean incubation, 56 ± 5 min prior to DPDPE). Both wortmannin (P = 0.04, Fisher exact test; P = 0.006, permutation analysis; P = 0.002, permutation analysis limited to data from rats with elevated [Cort]) and LY249002 (P = 0.02, Fisher exact test; P = 0.008, permutation analysis; P = 0.003, permutation analysis limited to data from rats with elevated [Cort]) prevented any neurons from exhibiting a DPDPE-mediated increase in evoked IPSCs (Fig. 5). We also tested whether blocking Akt prevented augmentations of both electrically and iontophoretically evoked GABAAR responses. An Akt antagonist (AKT inhibitor VIII) blocked the DPDPE-induced increases in both of these measures, consistent with the PI3K blocker data (5 μm, mean incubation, 50 ± 12 min; P = 0.057, Fisher exact test; P = 0.09, permutation analysis; P = 0.01, permutation analysis limited to data from rats with elevated [Cort]; Fig. 5).
The classical model of opioid receptor signalling requires activation of inhibitory Gi/o-proteins. In cell culture, MOR and DOR activation can lead to phosphorylation of Akt through Gi/o-protein activation (Polakiewicz et al. 1998; Olianas et al. 2011a,b;). However, GPCRs can also signal through G-protein-independent pathways (Defea, 2008). Since the consequences of DOR activation reported here differ from any previously reported opioid receptor signalling, we decided to test whether these effects were G-protein dependent. To do so, we replaced GTP with the non-hydrolysable GTP analogue GDP-β-S (500 μm) in our internal solution to inhibit G-protein signalling. In stressed rats, GDP-β-S did not block DPDPE-mediated augmentations or inhibitions of GABAAR signalling (P = 0.59, Fisher exact test; P = 0.83, permutation analysis; P = 0.47, permutation analysis limited to data from rats with elevated [Cort]; Fig. 5). Since GDP-β-S did not reduce either DPDPE effect, as a positive control we performed experiments to confirm that it could in fact block G-protein signalling in our preparation. We tested neurons from untreated rats for responses to the GABAB receptor agonist baclofen (1 μm), which should cause a postsynaptic Gi/o-protein-mediated inhibition through activation of a GIRK in VTA neurons. In 4/4 neurons the hyperpolarization induced by baclofen with control internal solution was clearly absent when GDP-β-S was included in the internal solution (Fig. 7), confirming that G-protein signalling was adequately blocked by GDP-β-S. Therefore, not only is this the first demonstration of a link between agonist binding to a prototypical GPCR and GABAAR insertion, but these data also show that this DOR response depends upon a novel G-protein-independent signalling pathway.
Figure 7. GDP-β-S blocks normal G-protein signalling in VTA neurons when included in the internal solution.

Neurons from age-matched untreated Lewis rats were recorded in current clamp (I = 0) with a potassium gluconate internal solution ((in mm): 123 potassium gluconate, 10 Hepes, 0.2 EGTA, 8 NaCl, 2 MgATP and 0.3 Na3GTP). The GABABR agonist baclofen (1 μm) caused a hyperpolarization in VTA neurons, probably mediated by GIRK. In neurons with GDP-β-S included in the internal solution, baclofen caused a depolarization instead of a hyperolarization. This may be due to inhibition of GABA neurons in the slice which are firing spontaneously, therefore decreasing the activation of GABAARs on the recorded neurons (calculated Vrev Cl− = −73 mV; baseline Vm = −49 ± 3 mV; Cruz et al. 2004).
For our final experiment, since we found that the augmentations were due to receptor insertion into the plasma membrane, we wanted to rule out the possibility that the inhibitions were due to GABAAR internalization. We therefore incubated slices in the cell-permeable dynamin inhibitor dynasore (40 μm; mean incubation, 25 ± 4 min), which should block endocytosis of GABAAR receptors. There was no effect of dynasore on the DPDPE-mediated inhibition of GABAAR signalling in stressed rats (P = 0.35, Fisher exact test; P = 0.74, permutation analysis; P = 0.47; Fig. 5).
Discussion
Opioid receptors are prototypical GPCRs and activation of postsynaptic opioid receptors typically produces robust inhibition of neurons through activation of intracellular G-proteins leading to increases in GIRK currents (Williams et al. 2001). This opioid effect and others, including inhibition of adenylyl cyclase and inhibition of neurotransmitter release through activation of voltage-dependent K+ currents, are typically mediated by Gi/o-type proteins. On the other hand, it has recently been shown that GPCRs can signal in a variety of ways beyond the established G-protein pathways (Woehler & Ponimaskin, 2009). However, most reported observations of such signalling pathways have been in cultured cells. For opioid receptors in particular, while some studies in cell culture indicate that opioid receptors can signal independently of G-proteins (Twitchell & Rane, 1994; Shi et al. 2000), almost all studies conducted in neural tissue have only shown opioid effects that are G-protein mediated (but see Abdulla & Smith, 1997; Iegorova et al. 2010).
The experiments described here provide strong evidence that in stressed rats, DOR activation increases synaptic GABAAR density by activating a G-protein-independent, PI3K-Akt-dependent pathway (Fig. 8). These experiments also suggest that PKC is involved in the DPDPE-mediated inhibition of GABAAR signalling. One possible postsynaptic mechanism for a decrease in GABAAR efficacy could be phosphorylation of the receptor, which can occur through PKC activation (Leidenheimer et al. 1992). In fact, GPCR activation can lead to phosphorylation of GABAARs through PKC (Yamada & Akasu, 1996). In contrast to the augmentations, the fitted drug onset curves for GABA iontophoresis and electrically evoked IPSCs were completely overlapping for the DPDPE-induced inhibitions (mean time to 50% DPDPE effect on GABA iontophoresis: 3.2 ± 0.6 min; on evoked IPSCs: 2.4 ± 0.4 min; P = 0.23; Fig. 6C inset). This suggests that the DPDPE-induced change in GABAAR signalling is either only occurring at the synapse or is simultaneously occurring at all GABAARs, regardless of whether they are synaptic or extrasynaptic. Interestingly, our GDP-β-S data show that these inhibitions occur independently of G-protein signalling (Figs 5, 8).
Figure 8. δ Opioid receptor signalling in the VTA depends upon the state of the animal.

In untreated rats, DOR activation in the VTA causes a postsynaptic decrease in GABAAR signalling that is probably mediated by PKC. In stressed rats, while some VTA neurons show this postsynaptic inhibition, in other neurons a different signalling pathway becomes active: DOR activation now increases GABAAR signalling through a PI3K-Akt pathway that probably causes the insertion of new GABAARs into the synapse. In ethanol-consuming rats a different DOR effect is dominant: presynaptic inhibition of neurotransmitter release. While in ethanol-consuming rats it appears that the GABA inputs to all VTA neurons develop this DOR-mediated inhibition of GABA release (Margolis et al. 2008a), different subsets of VTA neurons express either the postsynaptic DOR augmentation or inhibition of GABAAR-mediated currents.
Compared to the more commonly observed GIRK activation which tracks the time course of the DOR agonist action, the G-protein-independent mechanism of GABAAR insertion described here provides a potentially more flexible and temporally specific form of neural control than a slow postsynaptic increase in K+ conductance through GIRK activation. In the case of the effect reported here, the magnitude of the change in neuronal firing produced by the DOR-induced GABAAR insertion will depend upon the timing of GABA release that occurs while the DOR agonist is acting. Fast GABAAR synaptic events can be time-locked to other neural circuit activity with greater resolution than the slower GPCR signalling pathways. Further, neurotransmission will only be affected by this postsynaptic insertion of GABAAR if there is co-occurring GABA release. Conversely, if there is ongoing GABA release that is presynaptically inhibited following elevated GABAAR insertion, the magnitude of the disinhibitory effect of the reduced level of synaptic GABA will be greater. It is interesting also to note that this change in signalling was observed in a subset of VTA neurons. One possibility is that the VTA neurons in which these changes occur belong to a specific neural circuit. For example, we have shown that κ opioid receptor responses differ between VTA neurons projecting to the nucleus accumbens, medial prefrontal cortex and amygdala in control animals (Margolis et al. 2006a,2008b;). Presumably, an alteration in signalling specific to a subset of neurons with a particular projection target would allow selective control of particular behaviours.
We also observed a DOR-induced inhibition of GABAAR signalling in VTA neurons from both untreated and stressed animals (Figs 1 and 8). That the mechanism accounting for this effect was postsynaptic was surprising. Importantly, one consequence of such a postsynaptic mechanism is that while a presynaptic opioid-induced decrease in the probability of neurotransmitter release is likely to affect both GABA-containing vesicles as well as peptide-containing vesicles, the postsynaptic effect reported here can modulate GABA signalling without affecting neuropeptide release. Such a postsynaptic effect will also decrease GABAAR signalling without affecting GABABR signalling, but a presynaptic inhibition of GABA release will affect both GABAAR and GABABR activation. This postsynaptic mechanism for DOR also contrasts with the well-established and ubiquitous presynaptic MOR inhibition of GABA release onto VTA neurons. Given this presynaptic MOR effect, it is interesting to note that in untreated rats the release of endogenous opioids such as enkephalin would be expected to activate both MOR and DOR and could yield a synergy between the presynaptic MOR inhibition of GABA release and postsynaptic DOR inhibition of GABAAR responses.
This mechanism of GABA signalling modulation is unique compared to other reported forms of GABAAR-mediated synaptic potentiation. For instance, in a variety of brain regions, including the VTA, long-term potentiation of GABAAR signalling has been reported. In the VTA, this phenomenon requires postsynaptic activation of NMDA receptors, which leads to retrograde signalling of the NO pathway and a presynaptic plasticity event (Nugent et al. 2007). Long-term depression of GABAAR signalling has also been reported in VTA neurons (Dacher & Nugent, 2010). Pretreating animals with morphine blocks both of these types of plasticity, in contrast to the DOR effects reported here that induce changes in GABAAR signalling.
There are a variety of possible behavioural consequences to the changes in signalling observed here in response to stress. First, building on our previous finding that a presynaptic DOR-mediated inhibition of GABA release onto VTA neurons (Fig. 8) is protective against elevated alcohol consumption (Margolis et al. 2008a), the DOR-mediated increase in GABAAR signalling in stressed rats could contribute to the elevated alcohol consumption induced by stress if the change is specific to the relevant circuit that regulates consumption (Volpicelli et al. 1990; Vengeliene et al. 2003; Funk et al. 2004; Matthews et al. 2008). Further studies will be required to examine this idea. Also, since decreasing GABA input onto dopaminergic neurons in the VTA is reinforcing, and elevated postsynaptic sensitivity to GABA release could increase the magnitude of the depolarization resulting from a presynaptic inhibition of neurotransmitter release, the increase in postsynaptic GABAAR response could intensify reinforcement. Alternatively, such an increase in GABAAR signalling could decrease the firing of VTA dopaminergic neurons, which could be aversive or could slow reinforcement learning.
Physiological and behavioural effects of DOR are revealed in the CNS when the animal's state has been altered by stressors or by pharmacological agents. For instance, both morphine exposure and ethanol consumption cause the up-regulation of DOR function on both GABA and glutamate terminals in a variety of brain regions (Hack et al. 2005; Margolis et al. 2008a; Bie et al. 2009a,b, 2010; Zhang & Pan, 2010). Here we have demonstrated that acute stress up-regulates DOR function and induces a novel postsynaptic signalling pathway: a G-protein-independent, Akt-mediated GABAAR insertion into the plasma membrane. We have also described another novel G-protein-independent postsynaptic DOR-mediated effect: inhibition of GABAAR signalling that is mediated by PKC. Together these findings demonstrate that stress not only increases DOR function, it can also change both the signalling pathway recruited by DOR and the valence of the physiological effect of DOR activation on GABAAR signalling.
Acknowledgments
We thank and J. Driscoll, A. Coker and Y. F. Xia for their technical assistance and R. O. Messing, D. Ron and J. P. McLaughlin for their comments. The effort depicted was supported by P50 AA017072, DA-016782–06, DA-030529-01, and sponsored by the Army under award numbers W81XWH-08-1-0017 and W81XWH-07-1-043. The US Army Medical Research Acquisition Activity, 820 Chandler Street, Fort Detrick, MD 21702-5014, USA, is the awarding and administering acquisition office. The content of the information does not necessarily reflect the position or the policy of the Government, and no official endorsement should be inferred. This work was also supported by funds from the State of California for medical research on alcohol and substance abuse through the University of California, San Francisco. Statistical analyses presented here were developed in consultation with UCSF-CTSI supported by NIH/National Center for Research Resources (NCRR) UCSF-CTSI Grant Number UL1 RR024131. This paper's contents are solely the responsibility of the authors and do not necessarily represent the official views of the NIH.
Glossary
Abbreviations
- BIG2
brefeldin A-inhibited quinine nucleotide-exchange protein 2
- Cort
corticosterone
- DOR
δ opioid receptor
- GABAAR
γ-aminobutyric acid type A receptor
- GIRK
G-protein-coupled inwardly rectifying K+ channel
- GPCR
G-protein-coupled receptor
- KOR
κ opioid receptor
- MOR
μ opioid receptor
- Ih
hyperpolarization-activated inwardly rectifying non-specific cation current
- IPF
interpeduncular fossa
- IPSC
inhibitory postsynaptic current
- MT
medial terminal nucleus of the accessory optic tract
- mt
mammillary tract
- NEM
N-ethylmaleimide
- NSF
NEM-sensitive fusion factor
- PKC
protein kinase C
- PPR
paired-pulse ratio
- TH
tyrosine hydroxylase
- VTA
ventral tegmental area
Author contributions
All authors were involved in the conception and design of the experiments; in collection, analysis, and interpretation of the data; and in drafting and critical revision of the article. All authors approved the final version.
References
- Abdulla FA, Smith PA. Nociceptin inhibits T–type Ca2+ channel current in rat sensory neurons by a G-protein-independent mechanism. J Neurosci. 1997;17:8721–8728. doi: 10.1523/JNEUROSCI.17-22-08721.1997. [DOI] [PMC free article] [PubMed] [Google Scholar]
- Abood ME, Law PY, Loh HH. Pertussis toxin treatment modifies opiate action in the rat brain striatum. Biochem Biophys Res Commun. 1985;127:477–483. doi: 10.1016/s0006-291x(85)80185-6. [DOI] [PubMed] [Google Scholar]
- Asano T, Ogasawara N. Uncoupling of γ–aminobutyric acid B receptors from GTP-binding proteins by N-ethylmaleimide: effect of N-ethylmaleimide on purified GTP-binding proteins. Mol Pharmacol. 1986;29:244–249. [PubMed] [Google Scholar]
- Bie B, Zhang Z, Cai YQ, Zhu W, Zhang Y, Dai J, Lowenstein CJ, Weinman EJ, Pan ZZ. Nerve growth factor-regulated emergence of functional δ-opioid receptors. J Neurosci. 2010;30:5617–5628. doi: 10.1523/JNEUROSCI.5296-09.2010. [DOI] [PMC free article] [PubMed] [Google Scholar]
- Bie B, Zhu W, Pan ZZ. Ethanol-induced δ-opioid receptor modulation of glutamate synaptic transmission and conditioned place preference in central amygdala. Neuroscience. 2009a;160:348–358. doi: 10.1016/j.neuroscience.2009.02.049. [DOI] [PMC free article] [PubMed] [Google Scholar]
- Bie B, Zhu W, Pan ZZ. Rewarding morphine-induced synaptic function of δ–opioid receptors on central glutamate synapses. J Pharmacol Exp Ther. 2009b;329:290–296. doi: 10.1124/jpet.108.148908. [DOI] [PMC free article] [PubMed] [Google Scholar]
- Bogdanov Y, Michels G, Armstrong-Gold C, Haydon PG, Lindstrom J, Pangalos M, Moss SJ. Synaptic GABAA receptors are directly recruited from their extrasynaptic counterparts. EMBO J. 2006;25:4381–4389. doi: 10.1038/sj.emboj.7601309. [DOI] [PMC free article] [PubMed] [Google Scholar]
- Charych EI, Yu W, Miralles CP, Serwanski DR, Li X, Rubio M, De Blas AL. The brefeldin A-inhibited GDP/GTP exchange factor 2, a protein involved in vesicular trafficking, interacts with the β subunits of the GABA receptors. J Neurochem. 2004;90:173–189. doi: 10.1111/j.1471-4159.2004.02481.x. [DOI] [PubMed] [Google Scholar]
- Chen L, Huang LY. Sustained potentiation of NMDA receptor-mediated glutamate responses through activation of protein kinase C by a μ opioid. Neuron. 1991;7:319–326. doi: 10.1016/0896-6273(91)90270-a. [DOI] [PubMed] [Google Scholar]
- Cruz HG, Ivanova T, Lunn ML, Stoffel M, Slesinger PA, Luscher C. Bi-directional effects of GABAB receptor agonists on the mesolimbic dopamine system. Nat Neurosci. 2004;7:153–159. doi: 10.1038/nn1181. [DOI] [PubMed] [Google Scholar]
- Dacher M, Nugent FS. Morphine-induced modulation of LTD at GABAergic synapses in the ventral tegmental area. Neuropharmacology. 2010 doi: 10.1016/j.neuropharm.2010.11.012. in press. [DOI] [PubMed] [Google Scholar]
- Defea K. β-Arrestins and heterotrimeric G-proteins: collaborators and competitors in signal transduction. Br J Pharmacol. 2008;153:S298–S309. doi: 10.1038/sj.bjp.0707508. [DOI] [PMC free article] [PubMed] [Google Scholar]
- Drummond GB. Reporting ethical matters in The Journal of Physiology: standards and advice. J Physiol. 2009;587:713–719. doi: 10.1113/jphysiol.2008.167387. [DOI] [PMC free article] [PubMed] [Google Scholar]
- Fukuda K, Kato S, Morikawa H, Shoda T, Mori K. Functional coupling of the δ-, μ-, and κ-opioid receptors to mitogen-activated protein kinase and arachidonate release in Chinese hamster ovary cells. J Neurochem. 1996;67:1309–1316. doi: 10.1046/j.1471-4159.1996.67031309.x. [DOI] [PubMed] [Google Scholar]
- Funk D, Vohra S, Le AD. Influence of stressors on the rewarding effects of alcohol in Wistar rats: studies with alcohol deprivation and place conditioning. Psychopharmacology (Berl) 2004;176:82–87. doi: 10.1007/s00213-004-1859-x. [DOI] [PubMed] [Google Scholar]
- Gendron L, Lucido AL, Mennicken F, O'Donnell D, Vincent JP, Stroh T, Beaudet A. Morphine and pain-related stimuli enhance cell surface availability of somatic δ-opioid receptors in rat dorsal root ganglia. J Neurosci. 2006;26:953–962. doi: 10.1523/JNEUROSCI.3598-05.2006. [DOI] [PMC free article] [PubMed] [Google Scholar]
- Gold MS, Levine JD. DAMGO inhibits prostaglandin E2-induced potentiation of a TTX-resistant Na+ current in rat sensory neurons in vitro. Neurosci Lett. 1996;212:83–86. doi: 10.1016/0304-3940(96)12791-9. [DOI] [PubMed] [Google Scholar]
- Hack SP, Bagley EE, Chieng BC, Christie MJ. Induction of δ-opioid receptor function in the midbrain after chronic morphine treatment. J Neurosci. 2005;25:3192–3198. doi: 10.1523/JNEUROSCI.4585-04.2005. [DOI] [PMC free article] [PubMed] [Google Scholar]
- Iegorova O, Fisyunov A, Krishtal O. G–protein-independent modulation of P-type calcium channels by μ-opioids in Purkinje neurons of rat. Neurosci Lett. 2010;480:106–111. doi: 10.1016/j.neulet.2010.06.015. [DOI] [PMC free article] [PubMed] [Google Scholar]
- Ingram SL, Williams JT. Opioid inhibition of Ih via adenylyl cyclase. Neuron. 1994;13:179–186. doi: 10.1016/0896-6273(94)90468-5. [DOI] [PubMed] [Google Scholar]
- Law PY, Wu J, Koehler JE, Loh HH. Demonstration and characterization of opiate inhibition of the striatal adenylate cyclase. J Neurochem. 1981;36:1834–1846. doi: 10.1111/j.1471-4159.1981.tb00438.x. [DOI] [PubMed] [Google Scholar]
- Leidenheimer NJ, McQuilkin SJ, Hahner LD, Whiting P, Harris RA. Activation of protein kinase C selectively inhibits the γ–aminobutyric acidA receptor: role of desensitization. Mol Pharmacol. 1992;41:1116–1123. [PubMed] [Google Scholar]
- Ma J, Zhang Y, Kalyuzhny AE, Pan ZZ. Emergence of functional δ-opioid receptors induced by long-term treatment with morphine. Mol Pharmacol. 2006;69:1137–1145. doi: 10.1124/mol.105.019109. [DOI] [PubMed] [Google Scholar]
- Margolis EB, Coker AR, Driscoll JR, Lemaitre AI, Fields HL. Reliability in the identification of midbrain dopamine neurons. PLoS One. 2010;5:e15222. doi: 10.1371/journal.pone.0015222. [DOI] [PMC free article] [PubMed] [Google Scholar]
- Margolis EB, Fields HL, Hjelmstad GO, Mitchell JM. δ-Opioid receptor expression in the ventral tegmental area protects against elevated alcohol consumption. J Neurosci. 2008a;28:12672–12681. doi: 10.1523/JNEUROSCI.4569-08.2008. [DOI] [PMC free article] [PubMed] [Google Scholar]
- Margolis EB, Lock H, Chefer VI, Shippenberg TS, Hjelmstad GO, Fields HL. Kappa opioids selectively control dopaminergic neurons projecting to the prefrontal cortex. Proc Natl Acad Sci U S A. 2006a;103:2938–2942. doi: 10.1073/pnas.0511159103. [DOI] [PMC free article] [PubMed] [Google Scholar]
- Margolis EB, Lock H, Hjelmstad GO, Fields HL. The ventral tegmental area revisited: is there an electrophysiological marker for dopaminergic neurons? J Physiol. 2006b;577:907–924. doi: 10.1113/jphysiol.2006.117069. [DOI] [PMC free article] [PubMed] [Google Scholar]
- Margolis EB, Mitchell JM, Ishikawa J, Hjelmstad GO, Fields HL. Midbrain dopamine neurons: projection target determines action potential duration and dopamine D2 receptor inhibition. J Neurosci. 2008b;28:8908–8913. doi: 10.1523/JNEUROSCI.1526-08.2008. [DOI] [PMC free article] [PubMed] [Google Scholar]
- Matthews DB, Morrow AL, O'Buckley T, Flanigan TJ, Berry RB, Cook MN, Mittleman G, Goldowitz D, Tokunaga S, Silvers JM. Acute mild footshock alters ethanol drinking and plasma corticosterone levels in C57BL/6J male mice, but not DBA/2J or A/J male mice. Alcohol. 2008;42:469–476. doi: 10.1016/j.alcohol.2008.05.001. [DOI] [PMC free article] [PubMed] [Google Scholar]
- Murga C, Fukuhara S, Gutkind JS. A novel role for phosphatidylinositol 3-kinase β in signalling from G protein-coupled receptors to Akt. J Biol Chem. 2000;275:12069–12073. doi: 10.1074/jbc.275.16.12069. [DOI] [PubMed] [Google Scholar]
- Nugent FS, Penick EC, Kauer JA. Opioids block long-term potentiation of inhibitory synapses. Nature. 2007;446:1086–1090. doi: 10.1038/nature05726. [DOI] [PubMed] [Google Scholar]
- Olianas MC, Dedoni S, Onali P. Regulation of PI3K/Akt signalling by N-desmethylclozapine through activation of δ-opioid receptor. Eur J Pharmacol. 2011a;660:341–350. doi: 10.1016/j.ejphar.2011.04.012. [DOI] [PubMed] [Google Scholar]
- Olianas MC, Dedoni S, Onali P. Signalling pathways mediating phosphorylation and inactivation of glycogen synthase kinase-3β by the recombinant human δ-opioid receptor stably expressed in Chinese hamster ovary cells. Neuropharmacology. 2011b;60:1326–1336. doi: 10.1016/j.neuropharm.2011.01.032. [DOI] [PubMed] [Google Scholar]
- Onali P, Dedoni S, Olianas MC. Direct agonist activity of tricyclic antidepressants at distinct opioid receptor subtypes. J Pharmacol Exp Ther. 2010;332:255–265. doi: 10.1124/jpet.109.159939. [DOI] [PubMed] [Google Scholar]
- Overland AC, Kitto KF, Chabot-Dore AJ, Rothwell PE, Fairbanks CA, Stone LS, Wilcox GL. Protein kinase C mediates the synergistic interaction between agonists acting at α2-adrenergic and δ-opioid receptors in spinal cord. J Neurosci. 2009;29:13264–13273. doi: 10.1523/JNEUROSCI.1907-09.2009. [DOI] [PMC free article] [PubMed] [Google Scholar]
- Polakiewicz RD, Schieferl SM, Gingras AC, Sonenberg N, Comb MJ. μ-Opioid receptor activates signalling pathways implicated in cell survival and translational control. J Biol Chem. 1998;273:23534–23541. doi: 10.1074/jbc.273.36.23534. [DOI] [PubMed] [Google Scholar]
- Shahabi NA, McAllen K, Sharp BM. δ Opioid receptors stimulate Akt-dependent phosphorylation of c-jun in T cells. J Pharmacol Exp Ther. 2006;316:933–939. doi: 10.1124/jpet.105.091447. [DOI] [PubMed] [Google Scholar]
- Shi Y, Huang FS, Chen WY, Wu Y, Tang Y, Hu Q. A DPDPE-induced enhancement of inward rectifier potassium current via opioid receptor in neuroblastomaxglioma NG108–15 cells. Neurosci Res. 2000;36:209–214. doi: 10.1016/s0168-0102(99)00122-4. [DOI] [PubMed] [Google Scholar]
- Thomas P, Mortensen M, Hosie AM, Smart TG. Dynamic mobility of functional GABAA receptors at inhibitory synapses. Nat Neurosci. 2005;8:889–897. doi: 10.1038/nn1483. [DOI] [PubMed] [Google Scholar]
- Twitchell WA, Rane SG. Nucleotide-independent modulation of Ca2+-dependent K+ channel current by a μ-type opioid receptor. Mol Pharmacol. 1994;46:793–798. [PubMed] [Google Scholar]
- Vengeliene V, Siegmund S, Singer MV, Sinclair JD, Li TK, Spanagel R. A comparative study on alcohol-preferring rat lines: effects of deprivation and stress phases on voluntary alcohol intake. Alcohol Clin Exp Res. 2003;27:1048–1054. doi: 10.1097/01.ALC.0000075829.81211.0C. [DOI] [PubMed] [Google Scholar]
- Volpicelli JR, Ulm RR, Hopson N. The bidirectional effects of shock on alcohol preference in rats. Alcohol Clin Exp Res. 1990;14:913–916. doi: 10.1111/j.1530-0277.1990.tb01837.x. [DOI] [PubMed] [Google Scholar]
- Wang Q, Liu L, Pei L, Ju W, Ahmadian G, Lu J, Wang Y, Liu F, Wang YT. Control of synaptic strength, a novel function of Akt. Neuron. 2003;38:915–928. doi: 10.1016/s0896-6273(03)00356-8. [DOI] [PubMed] [Google Scholar]
- Williams JT, Christie MJ, Manzoni O. Cellular and synaptic adaptations mediating opioid dependence. Physiol Rev. 2001;81:299–343. doi: 10.1152/physrev.2001.81.1.299. [DOI] [PubMed] [Google Scholar]
- Woehler A, Ponimaskin EG. G protein-mediated signalling: same receptor, multiple effectors. Curr Mol Pharmacol. 2009;2:237–248. doi: 10.2174/1874467210902030237. [DOI] [PubMed] [Google Scholar]
- Yamada K, Akasu T. Substance P suppresses GABAA receptor function via protein kinase C in primary sensory neurones of bullfrogs. J Physiol. 1996;496:439–449. doi: 10.1113/jphysiol.1996.sp021697. [DOI] [PMC free article] [PubMed] [Google Scholar]
- Zhang Z, Pan ZZ. Synaptic mechanism for functional synergism between δ- and μ-opioid receptors. J Neurosci. 2010;30:4735–4745. doi: 10.1523/JNEUROSCI.5968-09.2010. [DOI] [PMC free article] [PubMed] [Google Scholar]
- Zhao C, Slevin JT, Whiteheart SW. Cellular functions of NSF: not just SNAPs and SNAREs. FEBS Lett. 2007;581:2140–2149. doi: 10.1016/j.febslet.2007.03.032. [DOI] [PMC free article] [PubMed] [Google Scholar]