Triterpenic saponins participate in plant defense mechanisms and possess a broad spectrum of biological and pharmacological properties. This article identifies the P450 cytochrome CYP716A12 as a key gene in the synthesis of hemolytic saponins in Medicago truncatula by a combination of genetic and biochemical analyses.
Abstract
Saponins, a group of glycosidic compounds present in several plant species, have aglycone moieties that are formed using triterpenoid or steroidal skeletons. In spite of their importance as antimicrobial compounds and their possible benefits for human health, knowledge of the genetic control of saponin biosynthesis is still poorly understood. In the Medicago genus, the hemolytic activity of saponins is related to the nature of their aglycone moieties. We have identified a cytochrome P450 gene (CYP716A12) involved in saponin synthesis in Medicago truncatula using a combined genetic and biochemical approach. Genetic loss-of-function analysis and complementation studies showed that CYP716A12 is responsible for an early step in the saponin biosynthetic pathway. Mutants in CYP716A12 were unable to produce hemolytic saponins and only synthetized soyasaponins, and were thus named lacking hemolytic activity (lha). In vitro enzymatic activity assays indicate that CYP716A12 catalyzes the oxidation of β-amyrin and erythrodiol at the C-28 position, yielding oleanolic acid. Transcriptome changes in the lha mutant showed a modulation in the main steps of triterpenic saponin biosynthetic pathway: squalene cyclization, β-amyrin oxidation, and glycosylation. The analysis of CYP716A12 expression in planta is reported together with the sapogenin content in different tissues and stages. This article provides evidence for CYP716A12 being a key gene in hemolytic saponin biosynthesis.
INTRODUCTION
Saponins are a class of secondary metabolites present in several plant species, including members of the genus Medicago (Jenner et al., 2005). In this genus, saponins are a complex mixture of triterpenic glycosides and have been shown to possess a broad spectrum of biological properties such as antifungal, insecticidal, phytotoxic, allelopathic, and hemolytic (Tava and Avato, 2006). Because of these properties, saponins are thought to participate in plant defense mechanisms (Papadopoulou et al., 1999). The triterpenic pathway is induced by methyl jasmonate (MJ), a signal component in the induction of many defense-responsive plant metabolites (Suzuki et al., 2005). Saponin pharmacological properties have been exploited in herbal medicines and, more recently, evaluated for their anticholesterolemic and anticancer adjuvant activities (Haridas et al., 2001; Shibata, 2001). In the Medicago genus, recent studies (reviewed in Tava and Avato, 2006) have focused on elucidating the relationship between the biological activities of these compounds and their chemical structure. The type of aglycone moiety and the nature and position of the sugar chains (sugar moiety) appear to correlate with the different biological properties. The hemolytic activity of saponins, resulting from their affinity for membrane sterols, is related to the nature of the aglycone moieties. No hemolytic activity was detected for soyasapogenol saponins (Yoshiki et al., 1998), while the other aglycones showed from high (hederagenin and medicagenic acid glycosides) to moderate (zanhic acid glycosides) hemolytic activity (Oleszek, 1996).
All of these triterpenic compounds are synthesized from the isoprenoid pathway via the cyclization of 2,3-oxidosqualene to β-amyrin. The β-amyrin skeleton is then transformed in the reported aglycones by means of oxidative modifications possibly mediated by cytochrome P450 monooxygenases (P450s; Tava et al., 2010). Several glycosyl transfer reactions, mediated by a number of glycosyltransferases (GTs), are responsible for the addition of the sugar moiety. In Medicago truncatula, at least three genes encoding early enzymes of triterpene aglycone formation—squalene synthase, squalene epoxidase, and β-amyrin synthase (β-AS)—have been functionally characterized (Suzuki et al., 2002; Iturbe-Ormaetxe et al., 2003). In addition, two UDP-GTs have been shown to be active in the transfer of the Glc unit from UDP-Glc to Medicago triterpene aglycone mixtures (Achnine et al., 2005). An additional UDP-GT, UGT73F3, acts in the in vivo glucosylation of multiple sapogenins in M. truncatula (Naoumkina et al., 2010). A series of P450s that are MJ-induced and coexpressed with β-AS were selected as potential candidates involved in saponin biosynthesis (Naoumkina et al., 2010). However, in M. truncatula no gene involved in the oxidative reactions of the β-amyrin skeleton leading to triterpene aglycones has yet been characterized.
Here, we report the identification of a P450 gene involved in the biosynthetic pathway of hemolytic saponins in M. truncatula by combining an activation tagging method (Weigel et al., 2000) and a reverse genetic TILLING approach (McCallum et al., 2000). A functional characterization of the gene is also reported by expression in a yeast system.
RESULTS
Identification of the Mutant Lacking Hemolytic Activity
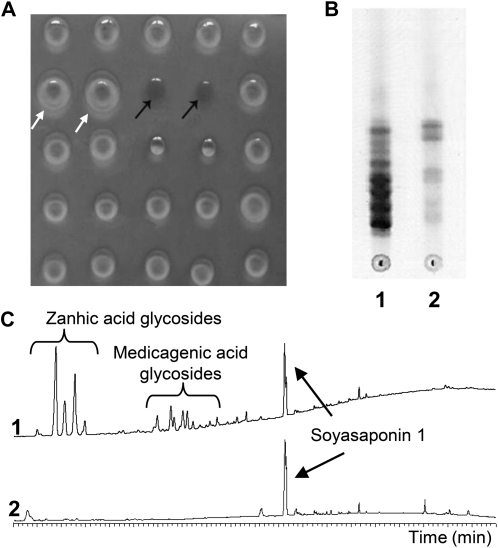
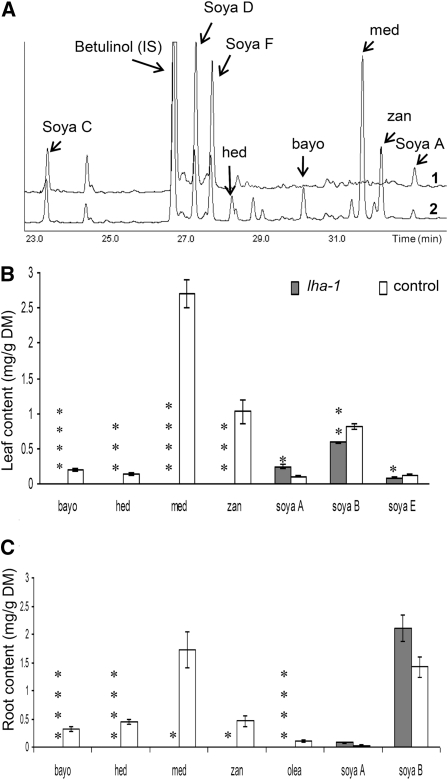
T1 plants (770) derived from 61 lines of an activation tagging mutant collection (Porceddu et al., 2008) were grown and evaluated for different traits. In particular, a subset of four plants/line were screened using a microhemolytic test on leaf tissue extracts to identify putative mutants in hemolytic saponin content. One individual plant in line E25 (E25-10) was found to lack hemolytic activity in leaves (thus named lacking hemolytic activity, the [lha-1] mutant; Figure 1A). All of the T2 progeny of E25-10 (30 plants) showed the same Lha phenotype, suggesting a homozygous condition of the T1 mother plant. Leaves from the T2 progeny of E25-10 were collected, pooled, and used for chemical analyses; the escape line E113, which was untransformed after regeneration, was used as control. The crude saponin content in the lha-1 mutant was lower than in control plants (0.40 and 1.24% of defatted leaf dry matter, respectively). The crude saponin mixtures were evaluated by thin-layer chromatography (TLC) (Figure 1B) and HPLC (Figure 1C) analysis, and in both cases the lha-1 mutant showed the absence of spots (TLC) and peaks (HPLC) present in the control line, indicating a loss of specific saponins in the mutant line. Total sapogenins in plant material were evaluated based on their aglycone moieties, obtained after acid hydrolysis of the saponins. After identification by gas chromatography–mass spectrometry (GC-MS) (Figure 2A), aglycones were quantified by GC–flame ionization detection (FID) (Figures 2B and 2C), which showed that no oleanolic acid, hederagenin, bayogenin, medicagenic, or zanhic acid were detected in leaves or roots of the lha-1 mutant, but only soyasapogenols. All the aglycones were present in the control line.
Figure 1.
Comparison between lha-1 Mutant Line and Control Line.
(A) Microhemolytic test on a blood agar plate: Black arrows show the absence of hemolysis in lha-1 mutant; white arrows show the positive controls; the spots without indications are extracts of lines from the activation tagging collection.
(B) TLC analysis of purified saponins from control (1) and lha-1 mutant (2).
(C) HPLC analysis of purified saponins from control (1) and lha-1 mutant (2).
Figure 2.
Analysis of Sapogenin Content in Leaves and Roots of lha-1 Mutant Line and Control Line.
(A) GC-MS chromatograms of sapogenins in roots: lha-1 mutant (1) and control line (E113) (2).
(B) and (C) Sapogenin content obtained by GC-FID analysis in leaves and roots, respectively; values for lha-1 (gray bars) and the control line (white bars) are means ± se of three biological replicates (three to 10 plants/replicate). Identification of soyasapogenol B was achieved considering all the artifactual compounds detected (soyasapogenols C, D, and F). *P < 0.05, **P < 0.01, ***P < 0.005, ****P < 0.001 with F test).
bayo, bayogenin; DM, dry matter; hed, hederagenin; IS, internal standard; med, medicagenic acid; olea, oleanolic acid; soya, soyasapogenol; zan, zanhic acid.
Cloning of the Mutant Gene
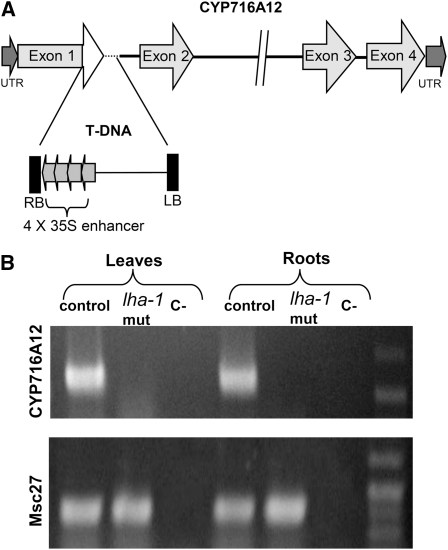
DNA gel blot analysis on genomic DNA of T2 plants deriving from the lha-1 mutant showed two bands, indicating a double insertion. The two insertions were cloned by inverse PCR, generating fragments of 1200 bp (A fragment) and 1900 bp (B fragment), respectively. Sequencing of these fragments and alignment with the M. truncatula sequences in The Institute for Genomic Research and GenBank databases showed that fragment A had 97% identity (BLASTn analysis) with the CYP716A12 sequence, a member of a cytochrome P450 family found in M. truncatula Jemalong A17 and expressed in root tissue (Li et al., 2007). No significant homologies with known genes were found for fragment B. Cytochrome P450s have been reported to be involved in triterpene saponin biosynthesis (Qi et al., 2006; Shibuya et al., 2006); therefore, CYP716A12 was retained as a candidate gene potentially involved in the lha mutation. The complete genomic sequence obtained by genome walking (Figure 3A) showed four exons separated by three introns; the exact site of integration of the T-DNA was inside the first exon (Figure 3A) and the T-DNA integration created a deletion of 72 bp in the first exon and 55 bp in the first intron. The full-length cDNA sequence of CYP716A12 was obtained by rapid amplification of cDNA ends (RACE); during these experiments it became evident that in addition to the full-length transcript, the gene also produced a splicing variant lacking the first exon (see Supplemental Figure 1 online). RT-PCR analysis revealed that the longer transcript of CYP716A12 was expressed in control plants but was absent in lha-1 (Figure 3B); conversely, the shorter splicing variant was expressed in mutant and wild-type plants.
Figure 3.
Identification of the T-DNA–Tagged Locus and Expression of the CYP716A12-Tagged Gene in the lha-1 Mutant.
(A) Location of the T-DNA insertion in CYP716A12 gene (not drawn to scale). The relative location and orientation of the T-DNA are shown. The T-DNA right border (RB) with four copies of the 35S enhancer was inserted at the end of the first exon producing the loss of small parts of the exon (in white) and the intron (hatched). LB, left border; UTR, untranslated region.
(B) RT-PCR analysis of transcript level of CYP716A12 gene in leaves and roots of the control line (E113) and the lha-1 mutant. C-, negative control; Msc27, reference gene.
Cosegregation Analysis
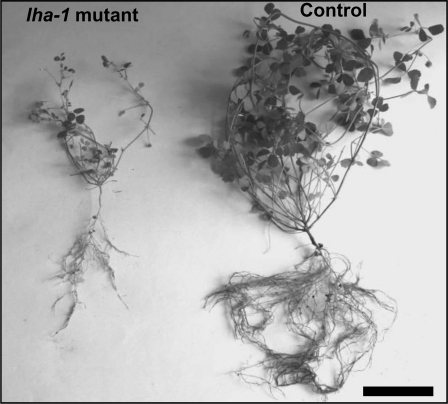
To demonstrate the involvement of CYP716A12 gene in the Lha phenotype, the T2 progenies (30 plants/line) derived from the original 10 T1 E25 plants were analyzed. In five segregant progenies, a 3:1 ratio (wild type:mutant) was found for the Lha phenotype, a ratio consistent with this trait being determined by a single recessive allele (see Supplemental Table 1 online). All the progenies showed a strict cosegregation between the Lha phenotype and T-DNA insertion in CYP716A12 gene in the homozygous state (tested by PCR); one lha-1 mutant line was found carrying only T-DNA insertion in CYP716A12 in the homozygous state. Homozygous lha mutant plants showed severe reduction in root and shoot size (Figure 4 and see Supplemental Table 2 online). No correlation was found between the Lha phenotype and insertion B; in particular, the E25-08 progeny showed only insertion B in the homozygous state and had no alteration in hemolytic activity.
Figure 4.
Plants of lha-1 (E25-10) and Control Line (E113).
Ten-week-old lha-1 mutant plant is reduced in growth compared with the contemporary control (E113) plant. Bar = 10 cm.
Identification of CYP716A12 Loss-of-Function Alleles in a TILLING Collection
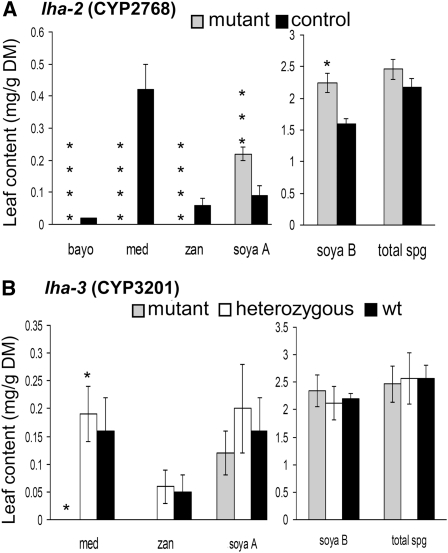
M2 plants (2300) of an ethyl methanesulfonate (EMS)-mutagenized collection (Porceddu et al., 2008) were screened by TILLING analysis and two mutants for CYP716A12 were identified (see Supplemental Figure 2 online): CYP2768 (lha-2) and CYP3201 (lha-3). In the lha-3 M2 plant, a Trp to stop codon (Trp449→ stop) change was identified in a heterozygous state that caused the loss of the last 30 amino acids of the peptide. This substitution was 22 amino acids after the highly conserved heme Cys ligand. The lha-3 mutant segregated in a Mendelian fashion in the M3 progeny and a retarded-in-growth phenotype was observed for the homozygous mutant individuals. The lha-3 homozygous mutants lacked medicagenic and zanhic acid; as for zanhic acid, however, the null value in the mutant and the trace amounts in control plants were not statistically different (Figure 5B). In lha-2 M2 plant, the mutation in the homozygous state caused a Pro to Leu (Pro355→Leu) amino acid change. The evaluation of the M3 generation for sapogenin content in leaves was performed by GC-MS analysis. Interestingly, the lha-2 mutation resulted in a loss-of-function allele because no bayogenin, medicagenic, or zanhic acid (hemolytic sapogenins) were found, whereas soyasapogenols A and B were significantly higher than in control plants Jemalong 2HA10-9-3 (Figure 5A). The lha-2 homozygous mutant plants did not show a retarded-in-growth phenotype.
Figure 5.
Sapogenin Content in Mutant and Control Plants.
Data were obtained by GC-FID analysis of lha-2 (CYP2768) and lha-3 (CYP3201) mutant lines (M3 generation) from a TILLING collection and the respective control plants.
(A) lha-2: Mutant (gray bars, nine plants) and control Jemalong 2HA10-9-3 (black bars, three plants).
(B) lha-3: Homozygous mutant (gray bars, three plants), heterozygous mutant (white bars, three plants), and wild type (black bars, three plants).
Values are means ± se. (*P < 0.05, **P < 0.01, ***P < 0.005, ****P < 0.001 with F test and linear contrasts).
bayo, bayogenin; DM, dry matter; med, medicagenic acid; soya, soyasapogenol; spg, sapogenins; wt, wild type; zan, zanhic acid.
Genetic Complementation of the lha-1 Mutant
Several independent transgenic lines were obtained for the construct 35S:CYP716A12 in the lha-1 mutant and were confirmed by PCR analysis. Ten randomly chosen lines expressing the transgene were examined for sapogenin content in the leaves by GC analysis. Five independent transformants showed detectable levels of bayogenin, medicagenic, and zanhic acid, confirming that disruption of the CYP716A12 gene is responsible for the lack of hemolytic saponins in the lha mutant (see Supplemental Figure 3 online).
Functional Expression of CYP716A12
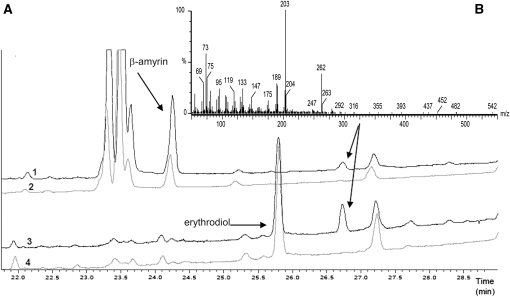
To elucidate the function of CYP716A12 in the hemolytic saponin pathway, the gene was expressed in a yeast (Saccharomyces cerevisiae) system. Enzymatic characterization was performed in an in vitro system employing microsomes from the GAL-induced yeast strains WAT11 and WR (Pompon et al., 1996) transformed with the pESC-HIS expression vector containing the CYP716A12 coding sequence with a C-terminal FLAG epitope tag. The same strains transformed with an empty vector were used as control. WAT11 and WR strains, overexpressing an Arabidopsis thaliana and a yeast P450 reductase, respectively, were used to optimize electron transfer during catalysis. After microsomal membrane isolation, immunoblot analysis confirmed the presence of an ~57 KDa protein in the CYP716A12-harboring strains as expected (see Supplemental Figure 4 online). In the mutant lha, none of the sapogenin forming the hemolytic saponins was detected, suggesting that the biosynthetic pathway is blocked at an early step. Enzymatic activities in microsomes were then tested by supplying β-amyrin, which is the carbon skeleton common to all the sapogenins, and erythrodiol, a derivative of β-amyrin carrying a hydroxylic group at the C-28 position. GC-MS analysis of the reaction products (Figure 6A) showed the CYP716A12-dependent formation of the same detectable compound from β-amyrin and erythrodiol; the retention time and mass spectrum of the product (Figure 6B) showed an excellent match with those of oleanolic acid (see Supplemental Figure 5 online). No enzymatic activity on the tested substrates was detected in microsomes from the control strains. These results indicate that CYP716A12 mainly catalyzes the sequential three-step oxidation at the C-28 position necessary to transform β-amyrin into oleanolic acid.
Figure 6.
In Vitro Oxidation of β-Amyrin and Erythrodiol by CYP716A12 in Microsomes of the WAT11 Strain.
(A) GC-MS analysis of the reaction products resulting from in vitro assay containing β-amyrin (1 and 2) and erythrodiol (3 and 4) as substrate on strains expressing CYP716A12 (black) and control (gray).
(B) Mass spectrum of the peaks at 26.75 min indicated by the arrows in (A): The retention time and mass spectra of these peaks compare well with those of oleanolic acid.
Expression of CYP716A12
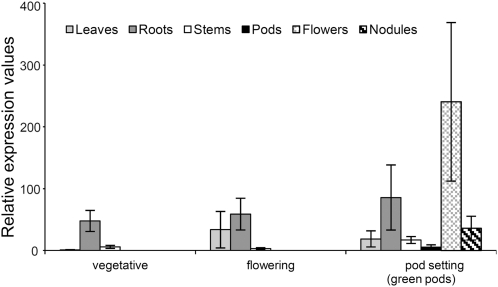
To investigate the expression profiles of the CYP716A12 gene, total RNA was extracted from different organs (leaves, stems, and roots) of the E113 control line at three different developmental stages (preflowering, early flowering, and early pod setting). RNA from flowers, pods, and nodules was also obtained in the last stage. Expression of the gene, analyzed by quantitative real-time PCR, occurred in all the organs and the developmental stages (Figure 7). Higher and more stable expression through stages was found in roots: the gene expression coefficient of variation among stages was 30.44% in roots, 91.35% in leaves, and 87.02% in stems. In leaves, a significant increase in expression was observed in the reproductive stages, with a maximum expression at flowering. Flowers and pods showed the highest and lowest expression of the gene, respectively.
Figure 7.
Expression Analysis of CYP716A12 Gene in Control Line (E113) by Quantitative RT-PCR: Different Organs at Different Phenological Stages Were Considered.
Data are shown for leaves (light gray bars), roots (dark gray bars), stems (white bars), pods (black bars), flowers (light cross-hatched bars), and nodules (dark cross-hatched bars).
Values are means ± se of three biological replicates (three plants/replicate) and are expressed relative to leaves in the vegetative stage.
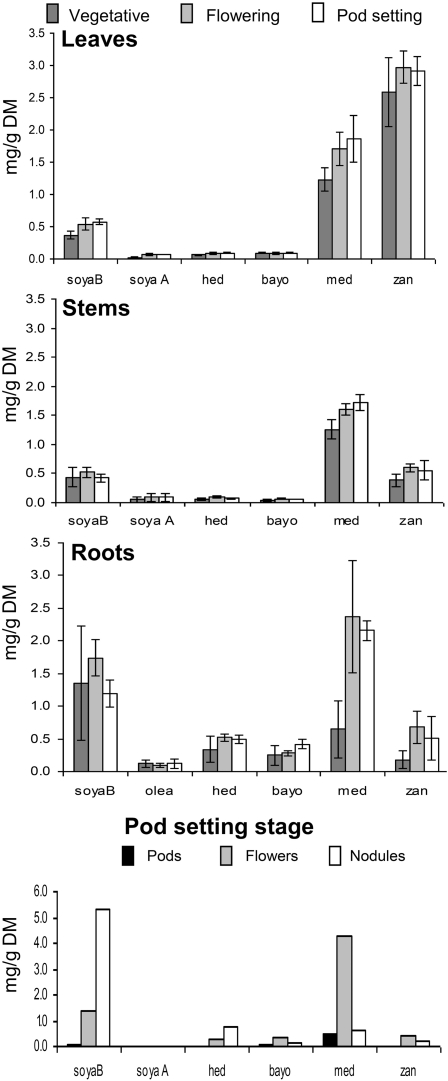
The same plants used for gene expression were examined for sapogenin content by GC-FID analysis. The hemolytic sapogenin content was significantly influenced by developmental stages (increase from vegetative to reproductive stages) and plant organs (leaves > roots > stems), while variation of nonhemolytic sapogenin content was attributable mainly to plant organs (roots > leaves, stems). In particular, hederagenin and bayogenin (hemolytic) and soyasapogenol B (nonhemolytic) were prevalent in roots at all the stages; zanhic acid was prevalent in leaves at all the stages (Figure 8 and see Supplemental Table 3 online). Medicagenic acid, the major component of M. truncatula total sapogenin (33, 40, and 43%, respectively, averaged on organs, in the three developmental stages), showed a change in the ranking of organs from the vegetative stage (leaf, stem > root) to the flowering stage (root > leaf, stem). Flowers, pods, and nodules had to be pooled over plants and blocks to give sufficient amount for sapogenin analysis; their variation was then tested using the error term relative to leaves, stems, and roots. Flowers showed the highest content of medicagenic acid, while pods had less hederagenin, bayogenin, medicagenic acid and soyasapogenol B than flowers and roots. Nodules had the highest content of soyasapogenol B and hederagenin (Figure 8).
Figure 8.
Sapogenin Content Obtained by GC-FID Analysis in Control Line (E113): Different Organs at Different Phenological Stages Were Reported.
Values are means ± se of three biological replicates (three plants/replicate). bayo, bayogenin; DM, dry matter; hed, hederagenin; med, medicagenic acid; olea, oleanolic acid; soya A, soyasapogenol A; soyaB, soyasapogenol B; zan, zanhic acid.
Transcriptome Changes in the lha Mutant
Genome-wide transcript profiling of the lha-1 mutant identified ~700 genes that were differentially expressed compared with wild-type R-108 (P < 0.05, >1.5-fold change). A total of 428 were upregulated and 290 were downregulated in the mutant (see Supplemental Data Set 1 and Supplemental Figure 6 online). The lha-1 mutant underwent modulation of expression in the saponin biosynthetic pathway at three different steps: First, the cyclization of 2,3-oxidosqualene was altered as evidenced by the downregulation of Medtr8g018540.1, Medtr8g018550, and Medtr8g018610 (see Supplemental Table 4 online). These three genes show high homology (92% in the case of Medtr8g018610) with the β-AS gene (GenBank accession number CAD23247; Suzuki et al., 2002) and with α/β-AS situated on chromosome 8 of M. truncatula (Naoumkina et al., 2010). Their consistent modulation and physical proximity suggest that they could act as a cluster of paralogous genes. Second, the CYP450-mediated modifications of β-amyrin were affected as three P450s, putatively involved in saponin biosynthesis on the basis of induction by MJ and coexpression with β-AS (Naoumkina et al., 2010), showed 1.6- to 2.6-fold changes in the lha-1 mutant. In particular, CYP93E2, a homolog of CYP93E1 responsible for β-amyrin 24-hydroxylase activity in Glycine max (Shibuya et al., 2006) and in the legume Glycyrrhiza uralensis (Seki et al., 2008), was downregulated in the lha-1 mutant, while CYP72A67 and CYP72A68 were upregulated (see Supplemental Table 4 online).
Seven other differentially modulated P450s with unknown function were phylogenetically related to those putatively involved in saponin biosynthesis, as they were distributed in the same types and clans (Li et al., 2007). Four of these genes (Medtr5g102050, Medtr8g050160, TC107626, and TC93934) belonged to the A-type clan 71 as CYP93E2 and three (BQ139200, Medtr8g045080, and AW127462) to non-A-type clan 72 (see Supplemental Table 4 online). The CYP716A12 gene, represented by two distinct probe sets (Mtr.43018.1.S1 and Mtr.31199.1.S1), showed no significant differential expression in the mutant. This finding is attributable to the presence of the short splicing variant still transcribed in the lha mutant and containing the regions matching the two probe sets. A further P450 (Medtr8g090600) belonging to the same non-A-type clan 85 as CYP716A12 was upregulated in the mutant (see Supplemental Table 4 online). Finally, the glycosylation step was also modulated, as evidenced by the downregulation of UGT73F3, shown to function in saponin biosynthesis in planta (Naoumkina et al., 2010), and GTs UGT91H5 and UGT91H6 also reported to be strongly coexpressed with β-AS (Naoumkina et al., 2010). Three other GTs (Medtr7g076790, Medtr5g076110, and Medtr2g008380) differentially modulated in the mutant showed high similarity with those putatively involved in saponin biosynthesis. Twelve further GTs with unknown function showed differential expression in the lha-1 mutant (see Supplemental Table 4 online).
DISCUSSION
Involvement of CYP716A12 in Hemolytic Saponin Pathway
Several lines of evidence indicate that the disruption of the CYP716A12 gene is involved in the determination of the lha mutant phenotype. The segregation ratio of the T2 heterozygous progenies E-25 from the R108 genotype showed that a single recessive gene was responsible for the mutant phenotype; in the same T2 generation, cosegregation was found between the Lha phenotype and the disruption of the CYP716A12 gene. Additionally, two independent lines from another genotype (Jemalong 2HA10-9-3) carrying different point mutations in the same gene displayed the Lha phenotype. Finally, the complementation of the lha-1 mutant plants with a vector carrying a full-length coding sequence (CDS) of CYP716A12 restored the biosynthetic pathway of hemolytic saponins. We concluded that the knock-out of CYP716A12 was responsible for the block in this pathway. Interestingly, CYP716A12 was one of the cytochrome P450 genes upregulated by MJ, a wound signal that triggers saponin accumulation in plants, and was coexpressed with β-AS (Naoumkina et al., 2010).
Role of CYP716A12 in Hemolytic Saponin Pathway
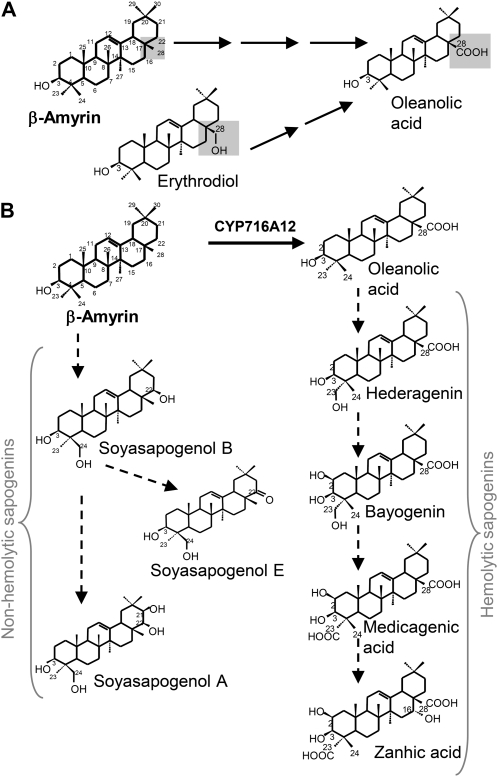
In the lha mutants, none of the sapogenins—hederagenin, bayogenin, medicagenic, or zanhic acid—forming the hemolytic saponins was detected by GC-MS analysis, suggesting that the biosynthetic pathway is blocked at an early and common step. The aglycones of hemolytic saponins differ from those of nonhemolytic saponins (soyasapogenols) by the hydroxylation at C-23 instead of at the C-24 position, by the presence of the carboxylic group at C-28, and by the absence of oxidation at C-22 (Figure 9B). Hydroxylation at C-24 seems to be the key step for soyasapogenol formation, while carboxylation at C-28 and hydroxylation at C-23 for aglycones of hemolytic saponins (Tava et al., 2010); the order of oxidation between C-23 and C-28 is not evident. In the wild type, E113 oleanolic acid, carrying only the carboxyl group at the C-28 position, was present in trace amounts in roots (Figure 2C), whereas it was never detected in the lha mutants. This suggests that the C-28 carboxylation was the most likely step blocked in lha. The in vitro enzymatic activity assay confirmed that CYP716A12 is a multifunctional P450 as it catalyzes the sequential three-step oxidation at C-28 of β-amyrin to yield oleanolic acid (Figure 9A) and it can use different substrates (β-amyrin and erythrodiol). As no intermediates (erythrodiol and the corresponding aldehyde) nor oleanolic acid were detected in the lha mutants, it is likely that CYP716A12 catalyzes the same three steps in plants. Other P450s involved in the terpenoid pathway were reported to catalyze sequential two- or three-step oxidations in legumes (Seki et al., 2008) and in other species (Helliwell et al., 1999, 2001; Ro et al., 2005).
Figure 9.
Role of CYP716A12 in Sapogenin Biosynthesis.
(A) Oxidation steps catalyzed by CYP716A12.
(B) Hypothetical sapogenin biosynthetic pathway in M. truncatula.
The lha-1 mutant displayed differential expression of several P450 monooxygenases and GTs; as two key steps in the synthesis of saponins are represented by oxidation and glycosylation, the results of the microarray experiment appear consistent with the nature of the mutation. Strengthening of the results of the present microarray experiments comes from the data shown by Naoumkina et al. (2010). There is a consistent overlap between the P450 and GT genes found by the analysis of MJ induction and coexpression with β-AS and the genes revealed by transcriptomic analysis of the lha-1 mutant.
The analysis of the two sets of data could contribute to the identification of other candidate genes involved in the saponin biosynthetic pathway.
Effect of CYP716A12 Loss-of-Function in the lha Retarded-in-Growth Mutant Phenotype
The blocking of carboxylation at the C-28 position in the lha mutant implies the absence of oxygenated groups in C-28 and consequently the lack of triterpenes glycosylated in this position. In fact, only soyasaponins that are glycosylated at the C-3 position have been found in the lha mutants (Figure 1C). The lha-1 and lha-3 mutant lines showed a retarded growth phenotype compared with their genetically closest counterparts: E25-08, wild type for CYP716A12 and homozygous mutant for insertion B, in the case of lha-1 (see Supplemental Table 2 online) and the wild-type individuals of the same line (full sib) for lha-3. The lha-2 mutant line did not display a retarded growth phenotype, but the homozygous state of the mutation hampered a comparison in the same genetic background, i.e., in the presence of the other unknown point mutations induced by the mutagen EMS treatment. A phenotype with a strong decrease in growth has been described in the M. truncatula Tnt1 mutant for the UGT73F3 gene responsible for the glycosylation of hederagenin at the C-28 position in root (Naoumkina et al., 2010). All of these findings suggest that the synthesis of hemolytic sapogenins and their consequent 28-glycosylation can play a role in plant growth processes.
Interestingly, among the genes differentially expressed in the mutant, the importance of the biodegradation of xenobiotics (8.4%) and the biosynthesis of secondary metabolites (8.8%) classes are relevant (see Supplemental Figure 6 online). Changes in secondary metabolites and hormone levels in the mutant are suggested by the differential expression of P450s reported to be involved in the respective biosynthetic pathways in M. truncatula and other plant species: CYP74B (Medtr2g104500), competing with allene oxide synthase for 13-hydroperoxylinoleic acid, an intermediate of oxylipin and jasmonic acid biosynthesis (Howe et al., 2000); CYP81E9 (TC95424), involved in downstream steps of isoflavonoid pathway (Liu et al., 2003); CYP90B (TC102428, TC102429), acting in early steps of brassinosteroid pathway (Sekimata et al., 2008); and TC110889, showing 68% homology with CYP707A3 responsible for the major abscisic acid catabolic pathway in plants (Okamoto et al., 2009). The Tnt1 mutant of M. truncatula for UGT73F3 also showed a higher isoflavone content than controls (Naoumkina et al., 2010).
As for xenobiotics, the endogenous (metabolome imbalance) or exogenous (biotic/abiotic stresses) origin of these compounds is questionable. A possible alteration of the glycosylation pattern with the formation of an abnormal pool of glycosides in the lha-1 mutant could be envisaged by the downregulation of GTs specific for hemolytic sapogenins, as UGT73F3, and the enhanced expression of other GTs of unknown function (see Supplemental Table 4 online). With respect to the exogenous origin of xenobiotics, it can be observed that three genes encoding proteins involved in plant resistance responses were differently expressed in lha-1: a polygalacturonase inhibiting protein (probe set Mtr.47298.1.S1_at), involved in defense processes against fungi (Ferrari et al., 2003), was downregulated; and a hevein-like protein homolog to the pathogenesis-related antifungal chitin binding PRP4 of pea (Pisum sativum; probe set Mtr.42876.1.S1_at) and a protein (probe set Mtr.41478.1.S1_at) showing 65% homology with MtPR10-1 abscisic acid-responsive ABR18 were upregulated. MtPR10-1 was found to be strongly induced in M. truncatula leaves in response to bacterial infections and was moderately induced after wounding (Gamas et al., 1998). In conclusion, such a pattern of transcriptome changes is not sufficient to highlight the origin of the lha retarded-in-growth mutant phenotype. However, a direct toxicity of intermediates of the saponin pathway is unlikely as in the mutant no accumulation of intermediates was found by chemical analyses but only the loss of an entire class of metabolites, i.e., the hemolytic saponins.
CYP716A12 is expressed in all the plant organs analyzed both aerial (flowers, leaves, stems, and pods) and subterranean (roots and nodules), though roots had the higher and the more stable expression level. In addition, its expression appears finely tuned according to plant organ (e.g., a sharp difference of CYP716A12 expression and hemolytic sapogenin content between flowers and pods) and developmental stage, the reproductive phase involving an increase in expression level and hemolytic sapogenin content. This pattern of expression of CYP716A12 is different from those of the GT UGT73F3 of M. truncatula and Sad3 and Sad4 from the Avena genus (Mylona et al., 2008) mainly expressed in root system. These findings, together with the severe phenotypic effect of the mutation in the lha-1 and lha-3 lines and the transcriptome changes exceeding triterpenic biosynthetic pathway, raise the question of a possible dual function, in defense responses and in plant developmental processes, for the entire class of hemolytic saponins or for particular members among them.
METHODS
Plant Material and Growth Conditions
Plants were grown in a greenhouse that was heated during winter (10°C) and was not heated in other months except for the experiments concerning microarray analysis, quantitative PCR, and saponin content determination in different tissues. In those cases, plants were kept in a growth chamber under 16 h of light at 22°C and 8 h of dark at 18°C.
Mutant Collections Used in the Present Study
Activation Tagging Collection
Sixty-one T1 lines (10–25 plants/line) generated in the R108-1 genotype as described in Porceddu et al. (2008) were screened. An escape line (E113) was used as a control. The generations T2, T3, and T4 of mutant and control lines were produced and used in the subsequent experiments.
TILLING Collection
The DNA of the M2 generation (2300 plants) of an EMS-mutagenized collection obtained in Jemalong genotype 2HA10-9-3 (Porceddu et al., 2008) was screened by the TILLING technique (McCallum et al., 2000) to identify mutants in the gene of interest. The M3 generation of the mutant plants identified was used for phenotypic characterization.
Analysis of the Saponin and Sapogenin Content
For chemical analyses, all samples were previously ground in liquid nitrogen and dried at 50°C.
Microhemolytic Method
Blood plates were prepared according to the method reported by Jurzysta (1979). An agar suspension was obtained by mixing 75 mL of sterile 0.9% NaCl solution, in which 4.5 g of agar had been previously dissolved, with 20 mL of blood suspension obtained by mixing 90 mL of fresh bovine blood with 9.9 mL of sterile 3.65% sodium citrate as an anticoagulant. The agar-blood suspension was then plated into glass vessels at 0.2 mm film thickness, and allowed to solidify. Dried and milled leaf samples (100 mg) were treated with 1 mL of isotonic solution (0.9% NaCl) and extracted at 80°C for 2 h. After cooling and centrifugation, 10 μL of the supernatant was pipetted onto the agar blood plate. After 24 h of dark incubation in a glass box with controlled humidity (80%) and temperature (22°C), hemolysis was visually evaluated. A 1% solution of previously purified saponins from Medicago sativa was used as a positive control.
Extraction and Purification of Saponins
Before saponin extraction, the samples were defatted with CHCl3 in a Soxhlet apparatus. One hundred milligrams of defatted material was treated with 5 mL of 30% MeOH in a stoppered tube, heated for 30 min at 50°C, and sonicated for 10 min. The sample was then centrifuged at 3000g, the supernatant was removed, and the precipitate was extracted. This procedure was repeated twice under the same conditions. The combined solutions were then run through a LiChroprep RP-18 column (400 mg, Merck, Darmstadt), preconditioned with 30% MeOH. Elution was performed with 35% MeOH (5 mL) to remove sugars and some phenolics; crude saponins were then eluted with 90% MeOH (3 mL) and dried under vacuum (Tava et al., 2005, 2011; Pecetti et al., 2010).
Saponin Analysis
The saponin mixtures were checked using TLC silica gel plates (Tava et al., 2005) and eluted with ethylacetate/water/acetic acid (7:2:2, v/v). Spots were visualized by Liebermann-Burckard reactive (MeOH/acetic anhydride/sulfuric acid, 10:1:1, v/v) followed by heating at 120°C. HPLC analysis was performed using a Perkin Elmer chromatograph equipped with a LC250 binary pump and a DAD 235 detector. Separation was obtained on a Discovery HS C18 column (5 μm, 4.6 × 250 mm, Supelco) with a mobile phase of solvent A: CH3CN 0.05% CF3COOH; solvent B: H2O 1% MeOH 0.05% CF3COOH. Chromatographic runs were performed under gradient elution from 20% (5-min isocratic condition) to 30% of solvent A for 70 min, increased to 40% of solvent A for 20 min, and then increased to 100% of solvent A for 70 min; 20 μL of methanolic solutions (1 mg/mL) of all samples was injected. Saponins were eluted at 1.0 mL/min and were detected by UV monitoring at 215 nm.
Sapogenin Analysis
Sapogenins were evaluated after the acid hydrolysis of the corresponding saponins (Pecetti et al., 2006). Sapogenins were compared with previously identified sapogenins from Medicago spp by TLC (Tava et al., 2005; Bialy et al., 2006). Sapogenins were also identified by GC-MS and quantified by GC-FID, as described in Tava et al. (1993) and Tava and Pecetti (1998).
Identification of the T-DNA–Tagged Loci
The T2 progeny of a single T1 plant (E25-10) homozygous for the Lha phenotype was used to identify the T-DNA insertion sites. The insertion sites were cloned using inverse PCR (Ochman et al., 1988). Briefly, genomic DNA was isolated from leaves of 10-week-old plants using a genomic extraction kit following the manufacturer’s protocols (Sigma); 200 ng of genomic DNA was cut with Pfl23II and Bsp1407I restriction enzymes, incubated overnight at 16°C with T4 DNA ligase, and amplified in a PCR reaction using primers designed for the right (Right 1) and the left (Left 1) borders of the T-DNA; the PCR products were then amplified in a nested PCR to increase the concentration of the desired fragments using Right 2 and Left 2 primers. The amplified DNA fragments were gel purified, cloned in Xl1Blue cells using GenJet cloning system (Fermentas), and sequenced using the Big Dye Terminator, version 3.1, sequencing kit (Applied Biosystems) and an ABI 310 analyzer. The sequences found were used to search the GenBank and The Institute for Genomic Research databases by applying BLASTn (Altschul et al., 1997) to identify putative genes. To obtain the full-length cDNA and genomic sequence for wild-type Mt CYP716A12, 5′ and 3′ RACE experiments (SMART RACE cDNA Amplification Kit, Clontech) and genome walking (GenomeWalker Universal Kit, Clontech) were performed starting from the insertion flanking sequences. All primers used in this research are listed (see Supplemental Table 5 online).
Isolation of Total RNA and RT-PCR Analysis
Total RNA was isolated using the RNeasy plant mini kit (Qiagen) according to the manufacturer’s protocol. First-strand cDNA was synthetized with Superscript III reverse transcriptase (Invitrogen) using a polyT 16mer primer.
The mRNA level of CYP716A12 was determined by RT-PCR: 2.5 μL of first-strand cDNA was amplified using primers ATG2fw and TAA2rw with TaKaRa Ex-Taq according to the manufacturer’s protocol. The Msc27 gene was used as control (Pay et al., 1992). PCR products were separated on 1% agarose gel.
Genetic Analysis
Cosegregation analysis of the Lha phenotype and the T-DNA insertion was performed on the T2 segregating population. Plants were genotyped by PCR on genomic DNA using one gene-specific primer (CYPfw for the insertion in CYP716A12 gene and InsBrw for insertion B) and a T-DNA right-border primer (PSKI). The wild-type allele was detected using primer pairs CYPfw and CYPrw for CYP716A12 and InsBfw and InsBrw for the genomic sequence related to the insertion B.
Identification of TILLING Alleles
The M2 generation of the EMS-mutagenized collection was screened by the TILLING technique using primers P450fw and P450rw to find mutations in the CYP716A12 gene. DNA from mutant plants was sequenced to confirm the mutation. The M3 generation of the identified mutant plants was analyzed for saponin and sapogenin content with the protocols described above.
Complementation
The full-length CDS for CYP716A12 was amplified with primers ATG2fw and TAA2rw from cDNA produced from total leaf RNA, cloned in pCR8GW (Invitrogen) and sequenced. The CDS was subsequently shuttled by attL 3 attR reaction into pH2GW7 (Karimi et al., 2002); manufacturer’s protocols were followed for TOPOTA and Gateway cloning (Invitrogen). The construct was electroporated into EHA105 Agrobacterium tumefaciens cells. Transformation of the lha leaf explants was performed according to Trinh et al. (2001).
Expression of CYP716A12 Gene in Saccharomyces cerevisiae
The full-length CYP716A12 CDS fragment was amplified with primers CypEcoRIfw and CypClaIrev, cloned into the pGEM-Teasy vector, and sequenced. The CYP716A12 CDS fragment was subsequently excised with the restriction enzymes EcoRI and ClaI and subcloned into the pESC-HIS vector (Agilent Technologies) to give an in-frame C-terminal fusion with the FLAG epitope. The expression vector was transformed into yeast (S. cerevisiae) strains WAT11 and WR (Pompon et al., 1996) by the lithium acetate procedure (Gietz et al., 1992). For CYP716A12 expression, the recombinant strains were cultured according to low density procedure (Pompon et al.,1996) with the addition of 13 μg/mL hemin (Sigma-Aldrich) to the medium in the last induction step. WAT11 and WR clones transformed with pESC-HIS empty vector were used as control. Microsome preparation was performed as described by Pompon et al. (1996) except that ultracentrifugation at 100,000g was performed for 60 min. The presence of CYP716A12 protein in microsome was tested by immunoblot analysis using an anti-FLAG antibody (Sigma-Aldrich).
In Vitro Enzymatic Activity Assay
The activity of the CYP716A12 protein was tested in a 500-μL reaction mixture consisting of 100 mM potassium phosphate buffer, pH 7.4, containing 20 mM Glc-6-phosphate, 2.5 U of Glc-6-phosphate dehydrogenase, 30 μg of substrate (β-amyrin purchased from Sigma-Aldrich or erythrodiol from Extrasynthese), and 2 mg of microsomal fraction protein. After incubating the reaction mixture for 5 min at 30°C, the reaction was started by adding NADPH to a final concentration of 2mM and then was stopped with 500 μL of 37% HCl after 6 h. The reaction products were subjected to acid hydrolysis, and sapogenin content was evaluated as described above.
Quantitative RT-PCR Analysis
Real-time quantitative PCR analysis was performed on the E113 control line (T4 generation). Total RNA was extracted from three biological replicates, each comprising three individual plants. Sampling was performed in three biological stages (vegetative growth, early flowering, and early pod setting) on leaves, stems, and roots. In the third sampling, flowers, pods, and root nodules were also processed. A Nucleospin RNA plant kit with DNase (Macherey-Nagel) was used according to the manufacturer’s protocol. cDNA was synthesized by priming with oligo-dT23 anchored using MMLV reverse transcriptase (Sigma-Aldrich) starting from 3 μg of RNA. cDNA was diluted 1:25 and 6 μL was used as template in a 20-μL reaction containing 10 μL of SsoFast EvaGreen supermix (Bio-Rad) and 0.75 μM primers CYP-38FW and CYP-220RW. Thermal cycling conditions were: 3′ of initial denaturation at 95°C, 40 cycles of denaturation (95°C, 25”), annealing and extension (59.5°C, 30”), and a final melting analyses from 55°C to 95°C with 1 degree for each step. The Msc27 control gene was amplified in the same condition using Msc27 269FW and Msc27 424rev primers at 1 μM each. All PCR reactions were performed on three replicates each in a RotorGene 6000 (Corbett). Data analysis was performed with Rotor-Gene 6000 series Software 1.7 (Corbett). To compare data from different PCR runs and different cDNA samples, cycle threshold (Ct) value was normalized against the reference gene Msc27. The value for the expression level of the CYP716A12 gene was calculated by the comparative Ct method using equation E = 2-ΔΔCt (ΔΔCt being the differences in ΔCt between a given tissue and leaves in vegetative stage). PCR conditions for each primer combination were optimized for efficiency = 1 and PCR products were verified by melting curve analysis and agarose gel.
Microarray Analysis
RNA was extracted from 2-month-old leaves for lha and control plants with the Qiagen RNeasy Mini Kit according to manufacturer’s instruction. A total of six hybridizations were performed (two samples per three replicates) at the NASC’s Affymetrix service (Nottingham Arabidopsis Stock Centre, University of Nottingham, UK). Total RNA samples were labeled, hybridized, and scanned as per manufacturer's instructions as described in the technical manual [GeneChip Expression Analysis, Affymetrix (www.affymetrix.com)], using the Medicago Genome array (Affymetrix). The raw and processed data have been donated to the Gene Expression Omnibus database at the National Center for Biotechnology Information (http://www.ncbi.nih.gov/geo/), with the accession number GSE22835. The nonscaled RNA CEL files were loaded into the Genespring GX11 (Agilent Technologies) using the robust multichip average prenormalization algorithm (Irizarry et al., 2003). Per-gene normalization was applied to the probe set signal values (i.e., the values for given genes) as follows. For each replicate, probe set signals were standardized to the median probe set signal value for all arrays in the experiment.
Differentially expressed genes were identified using a two-step process: 1) a t test was performed to identify genes that were differentially expressed between mutant and control samples (P ≤ 0.05); and 2) genes that were ≥1.5-fold up- or downregulated between the mutant and control samples.
The significant Gene Ontology (GO) terms for the Medicago and Arabidopsis thaliana annotation were identified using the GO Analysis function in Genespring GX11. The program Genebins at http://bioinfoserver.rsbs.anu.edu.au/utils/GeneBins/ (Goffard and Weiller, 2007) was also used for annotation analysis.
Statistical Analyses
Analysis of variance was performed using General Linear Models procedure of the SAS software, version 8 (SAS Institute Inc.), with linear contrasts for comparison of specific means.
Accession Numbers
Sequence data from this article can be found in the GenBank/EMBL databases under the following accession numbers FN 995112 (CYP716A12 gene from M. truncatula R-108) and FN 995113 (CYP716A12 mRNA from M. truncatula R-108). The raw and processed data have been deposited in the Gene Expression Omnibus database at the National Center for Biotechnology Information (http://www.ncbi.nih.gov/geo/), with the accession number GSE22835.
Supplemental Data
The following materials are available in the online version of this article.
Supplemental Figure 1. CYP716A12 Splicing Variant.
Supplemental Figure 2. Mutant Alleles for CYP716A12 from a TILLING Collection.
Supplemental Figure 3. GC-FID Chromatograms of Sapogenins of Control Line (E113; Red), lha Mutant (Green), and One Transformed Line Derived from Complementation of the lha-1 Mutant (Black).
Supplemental Figure 4. Immunoblot Analysis of the CYP716A12-Harboring Strains.
Supplemental Figure 5. GC-MS Analysis (A) and Mass Spectrum (B) of the Standard Oleanolic Acid.
Supplemental Figure 6. Bar Charts Showing GO Annotations of the M. truncatula Probe Sets Modulated in the lha Mutant.
Supplemental Table 1. T2 Lines Segregating for the Lha Phenotype: Segregation Ratio and χ2 Value.
Supplemental Table 2. Comparison of the lha Mutant Line (E25-10) and the Full Sib Control Line (E25-08).
Supplemental Table 3. Analysis of Variance of Sapogenin Content (GC-FID) in Control Plants Sampled in Different Organs at Different Phenological Stages: Test F and Significance.
Supplemental Table 4. List of Selected Genes/TC Modulated in the lha Mutant and Cited in the Text.
Supplemental Table 5. List of Primers Used in This Research.
Supplemental Data Set 1. Differentially Expressed Genes in the lha Mutant Compared with Wild-Type R-108 (P < 0.05, 1.5-fold change).
Supplementary Material
Acknowledgments
We thank Philippe Urban (Centre National de la Recherche Scientifique (CNRS), Centre de Génétique Moléculaire, Gif-sur-Yvette, France), and Franck Pinot and Danièle Werck (CNRS-Institut de Biologie Moléculaire des Plantes, Strasbourg, France) for providing yeast strains and suggestions, and Pascal Ratet (Institut des Sciences du Végétal, CNRS, Gif-sur-Yvette, France) for helpful suggestions. We also thank Francesca DeMarchis, Michele Bellucci, and Andrea Pompa (CNR-IGV, Perugia, Italy) for tips on Western analysis. We gratefully acknowledge technical support from Giancarlo Carpinelli and Marco Guaragno (CNR-IGV, Perugia, Italy) and Annalisa Seminari and Patrizia Gaudenzi (Consiglio per la Ricerca e la Sperimentazione in Agricoltura, Centro di Ricerca per le Produzioni Foraggere e Lattiero-Casearie, Lodi, Italy). TILLING analysis was performed by the Genomic Platform of Parco Tecnologico Padano, Lodi, Italy, coordinated by Pietro Piffanelli.
AUTHOR CONTRIBUTIONS
M.C., E.B., F.P., L.S., A.P., O.C., and C.S. designed and performed genetic and molecular experiments; E.B., A.T., M.C., and O.C. designed and performed biochemical analysis; N.G. and S.M. performed microarray data analysis; M.C., C.S., and O.C. wrote the article; and C.S., A.T., O.C., M.O., E.P., and S.A. supervised research and edited the article.
References
- Achnine L., Huhman D.V., Farag M.A., Sumner L.W., Blount J.W., Dixon R.A. (2005). Genomics-based selection and functional characterization of triterpene glycosyltransferases from the model legume Medicago truncatula. Plant J. 41: 875–887 [DOI] [PubMed] [Google Scholar]
- Altschul S.F., Madden T.L., Schäffer A.A., Zhang J., Zhang Z., Miller W., Lipman D.J. (1997). Gapped BLAST and PSI-BLAST: A new generation of protein database search programs. Nucleic Acids Res. 25: 3389–3402 [DOI] [PMC free article] [PubMed] [Google Scholar]
- Bialy Z., Jurzysta M., Mella M., Tava A. (2006). Triterpene saponins from the roots of Medicago hybrida. J. Agric. Food Chem. 54: 2520–2526 [DOI] [PubMed] [Google Scholar]
- Ferrari S., Vairo D., Ausubel F.M., Cervone F., De Lorenzo G. (2003). Tandemly duplicated Arabidopsis genes that encode polygalacturonase-inhibiting proteins are regulated coordinately by different signal transduction pathways in response to fungal infection. Plant Cell 15: 93–106 [DOI] [PMC free article] [PubMed] [Google Scholar]
- Gamas P., de Billy F., Truchet G. (1998). Symbiosis-specific expression of two Medicago truncatula nodulin genes, MtN1 and MtN13, encoding products homologous to plant defense proteins. Mol. Plant Microbe Interact. 11: 393–403 [DOI] [PubMed] [Google Scholar]
- Gietz D., St Jean A., Woods R.A., Schiestl R.H. (1992). Improved method for high efficiency transformation of intact yeast cells. Nucleic Acids Res. 20: 1425. [DOI] [PMC free article] [PubMed] [Google Scholar]
- Goffard N., Weiller G. (2007). GeneBins: A database for classifying gene expression data, with application to plant genome arrays. BMC Bioinformatics 8: 87. [DOI] [PMC free article] [PubMed] [Google Scholar]
- Haridas V., Higuchi M., Jayatilake G.S., Bailey D., Mujoo K., Blake M.E., Arntzen C.J., Gutterman J.U. (2001). Avicins: Triterpenoid saponins from Acacia victoriae (Bentham) induce apoptosis by mitochondrial perturbation. Proc. Natl. Acad. Sci. USA 98: 5821–5826 [DOI] [PMC free article] [PubMed] [Google Scholar]
- Helliwell C.A., Chandler P.M., Poole A., Dennis E.S., Peacock W.J. (2001). The CYP88A cytochrome P450, ent-kaurenoic acid oxidase, catalyzes three steps of the gibberellin biosynthesis pathway. Proc. Natl. Acad. Sci. USA 98: 2065–2070 [DOI] [PMC free article] [PubMed] [Google Scholar]
- Helliwell C.A., Poole A., Peacock W.J., Dennis E.S. (1999). Arabidopsis ent-kaurene oxidase catalyzes three steps of gibberellin biosynthesis. Plant Physiol. 119: 507–510 [DOI] [PMC free article] [PubMed] [Google Scholar]
- Howe G.A., Lee G.I., Itoh A., Li L., DeRocher A.E. (2000). Cytochrome P450-dependent metabolism of oxylipins in tomato. Cloning and expression of allene oxide synthase and fatty acid hydroperoxide lyase. Plant Physiol. 123: 711–724 [DOI] [PMC free article] [PubMed] [Google Scholar]
- Irizarry R.A., Hobbs B., Collin F., Beazer-Barclay Y.D., Antonellis K.J., Scherf U., Speed T.P. (2003). Exploration, normalization, and summaries of high density oligonucleotide array probe level data. Biostatistics 4: 249–264 [DOI] [PubMed] [Google Scholar]
- Iturbe-Ormaetxe I., Haralampidis K., Papadopoulou K., Osbourn A.E. (2003). Molecular cloning and characterization of triterpene synthases from Medicago truncatula and Lotus japonicus. Plant Mol. Biol. 51: 731–743 [DOI] [PubMed] [Google Scholar]
- Jenner H., Townsend B., Osbourn A. (2005). Unravelling triterpene glycoside synthesis in plants: Phytochemistry and functional genomics join forces. Planta 220: 503–506 [DOI] [PubMed] [Google Scholar]
- Jurzysta M. (1979). Haemolytic micromethod for rapid estimation of toxic alfalfa saponins. Acta Agrobot. 32: 5–11 [Google Scholar]
- Karimi M., Inzé D., Depicker A. (2002). GATEWAY vectors for Agrobacterium-mediated plant transformation. Trends Plant Sci. 7: 193–195 [DOI] [PubMed] [Google Scholar]
- Li L., Cheng H., Gai J., Yu D. (2007). Genome-wide identification and characterization of putative cytochrome P450 genes in the model legume Medicago truncatula. Planta 226: 109–123 [DOI] [PubMed] [Google Scholar]
- Liu C.J., Huhman D., Sumner L.W., Dixon R.A. (2003). Regiospecific hydroxylation of isoflavones by cytochrome p450 81E enzymes from Medicago truncatula. Plant J. 36: 471–484 [DOI] [PubMed] [Google Scholar]
- McCallum C.M., Comai L., Greene E.A., Henikoff S. (2000). Targeting induced local lesions IN genomes (TILLING) for plant functional genomics. Plant Physiol. 123: 439–442 [DOI] [PMC free article] [PubMed] [Google Scholar]
- Mylona P., Owatworakit A., Papadopoulou K., Jenner H., Qin B., Findlay K., Hill L., Qi X., Bakht S., Melton R., Osbourn A. (2008). Sad3 and sad4 are required for saponin biosynthesis and root development in oat. Plant Cell 20: 201–212 [DOI] [PMC free article] [PubMed] [Google Scholar]
- Naoumkina M.A., Modolo L.V., Huhman D.V., Urbanczyk-Wochniak E., Tang Y., Sumner L.W., Dixon R.A. (2010). Genomic and coexpression analyses predict multiple genes involved in triterpene saponin biosynthesis in Medicago truncatula. Plant Cell 22: 850–866 [DOI] [PMC free article] [PubMed] [Google Scholar]
- Ochman H., Gerber A.S., Hartl D.L. (1988). Genetic applications of an inverse polymerase chain reaction. Genetics 120: 621–623 [DOI] [PMC free article] [PubMed] [Google Scholar]
- Okamoto M., Tanaka Y., Abrams S.R., Kamiya Y., Seki M., Nambara E. (2009). High humidity induces abscisic acid 8′-hydroxylase in stomata and vasculature to regulate local and systemic abscisic acid responses in Arabidopsis. Plant Physiol. 149: 825–834 [DOI] [PMC free article] [PubMed] [Google Scholar]
- Oleszek W. (1996). Alfalfa saponins: Structure, biological activity and chemotaxonomy. In Advances in Experimental Medicine and Biology, Vol. 405, Saponins Used in Food and Agriculture, Waller G.R., Yamasaki K., (New York: Plenum Press; ), pp. 155–170 [DOI] [PubMed] [Google Scholar]
- Pay A., Heberle-Bors E., Hirt H. (1992). An alfalfa cDNA encodes a protein with homology to translationally controlled human tumor protein. Plant Mol. Biol. 19: 501–503 [DOI] [PubMed] [Google Scholar]
- Papadopoulou K., Melton R.E., Leggett M., Daniels M.J., Osbourn A.E. (1999). Compromised disease resistance in saponin-deficient plants. Proc. Natl. Acad. Sci. USA 96: 12923–12928 [DOI] [PMC free article] [PubMed] [Google Scholar]
- Pecetti L., Biazzi E., Tava A. (2010). Variation in saponin content during the growing season of spotted medic [Medicago arabica (L.) Huds.]. J. Sci. Food Agric. 90: 2405–2410 [DOI] [PubMed] [Google Scholar]
- Pecetti L., Tava A., Romani M., De Benedetto M.G., Corsi P. (2006). Variety and environment effects on the dynamics of saponins in lucerne (Medicago sativa L.). Eur. J. Agron. 25: 187–192 [Google Scholar]
- Pompon D., Louerat B., Bronine A., Urban P. (1996). Yeast expression of animal and plant P450s in optimized redox environments. Methods Enzymol. 272: 51–64 [DOI] [PubMed] [Google Scholar]
- Porceddu A., et al. (2008). An Italian functional genomic resource for Medicago truncatula. BMC Res Notes 1: 129. [DOI] [PMC free article] [PubMed] [Google Scholar]
- Qi X., Bakht S., Qin B., Leggett M., Hemmings A., Mellon F., Eagles J., Werck-Reichhart D., Schaller H., Lesot A., Melton R., Osbourn A. (2006). A different function for a member of an ancient and highly conserved cytochrome P450 family: From essential sterols to plant defense. Proc. Natl. Acad. Sci. USA 103: 18848–18853 [DOI] [PMC free article] [PubMed] [Google Scholar]
- Ro D.K., Arimura G.I., Lau S.Y.W., Piers E., Bohlmann J. (2005). Loblolly pine abietadienol/abietadienal oxidase PtAO (CYP720B1) is a multifunctional, multisubstrate cytochrome P450 monooxygenase. Proc. Natl. Acad. Sci. USA 102: 8060–8065 [DOI] [PMC free article] [PubMed] [Google Scholar]
- Seki H., Ohyama K., Sawai S., Mizutani M., Ohnishi T., Sudo H., Akashi T., Aoki T., Saito K., Muranaka T. (2008). Licorice β-amyrin 11-oxidase, a cytochrome P450 with a key role in the biosynthesis of the triterpene sweetener glycyrrhizin. Proc. Natl. Acad. Sci. USA 105: 14204–14209 [DOI] [PMC free article] [PubMed] [Google Scholar]
- Sekimata K., et al. (2008). Brz220 interacts with DWF4, a cytochrome P450 monooxygenase in brassinosteroid biosynthesis, and exerts biological activity. Biosci. Biotechnol. Biochem. 72: 7–12 [DOI] [PubMed] [Google Scholar]
- Shibata S. (2001). Chemistry and cancer preventing activities of ginseng saponins and some related triterpenoid compounds. J. Korean Med. Sci. 16(Suppl): S28–S37 [DOI] [PMC free article] [PubMed] [Google Scholar]
- Shibuya M., Hoshino M., Katsube Y., Hayashi H., Kushiro T., Ebizuka Y. (2006). Identification of β-amyrin and sophoradiol 24-hydroxylase by expressed sequence tag mining and functional expression assay. FEBS J. 273: 948–959 [DOI] [PubMed] [Google Scholar]
- Suzuki H., Achnine L., Xu R., Matsuda S.P.T., Dixon R.A. (2002). A genomics approach to the early stages of triterpene saponin biosynthesis in Medicago truncatula. Plant J. 32: 1033–1048 [DOI] [PubMed] [Google Scholar]
- Suzuki H., Reddy M.S.S., Naoumkina M.A., Aziz N., May G.D., Huhman D.V., Sumner L.W., Blount J.W., Mendes P., Dixon R.A. (2005). Methyl jasmonate and yeast elicitor induce differential transcriptional and metabolic re-programming in cell suspension cultures of the model legume Medicago truncatula. Planta 220: 696–707 [DOI] [PubMed] [Google Scholar]
- Tava A., Avato P. (2006). Chemical and biological activity of triterpene saponins from Medicago species. Nat. Prod. Commun. 1: 1159–1180 [Google Scholar]
- Tava A., Pecetti L. (1998). Hemolytic activity and saponin content in lucerne (Medicago sativa complex) genotypes. J. Genet. Breed. 52: 33–37 [Google Scholar]
- Tava A., Mella M., Avato P., Argentieri M.P., Bialy Z., Jurzysta M. (2005). Triterpenoid glycosides from leaves of Medicago arborea L. J. Agric. Food Chem. 53: 9954–9965 [DOI] [PubMed] [Google Scholar]
- Tava A., Oleszek W., Jurzysta M., Berardo N., Odoardi M. (1993). Alfalfa saponins and sapogenins: Isolation and quantification in two different cultivars. Phytochem. Anal. 4: 269–274 [Google Scholar]
- Tava A., Pecetti L., Romani M., Mella M., Avato P. (2011). Triterpenoid glycosides from the leaves of two cultivars of Medicago polymorpha L. J. Agric. Food Chem., 59: 6142–6149 [DOI] [PubMed] [Google Scholar]
- Tava A., Scotti C., Avato P. (2010). Biosynthesis of saponins in the genus Medicago. Phytochem. Rev. 10.1007/s11101–010–9169-x [Google Scholar]
- Trinh H., Barker D., Ratet P. (2001). Regeneration and transformation methods. Manual of the EMBO Practical Course on the New Plant Model System Medicago truncatula at http://www.isv.cnrs-gif.fr/embo01/manuels/index.html
- Weigel D., et al. (2000). Activation tagging in Arabidopsis. Plant Physiol. 122: 1003–1013 [DOI] [PMC free article] [PubMed] [Google Scholar]
- Yoshiki Y., Kudou S., Okubo K. (1998). Relationship between chemical structures and biological activities of triterpenoid saponins from soybean. Biosci. Biotechnol. Biochem. 62: 2291–2299 [DOI] [PubMed] [Google Scholar]
Associated Data
This section collects any data citations, data availability statements, or supplementary materials included in this article.


