

Abstract
After many years of development, position-sensitive avalanche photodiodes (PSAPDs) are now being incorporated into a range of scintillation detector systems, including those used in high-resolution small-animal PET and PET/MR scanners. In this work, the signal, noise, signal-to-noise ratio (SNR), flood histogram and timing resolution were measured for lutetium oxyorthosilicate (LSO) scintillator arrays coupled to PSAPDs ranging in size from 10–20 mm, and the optimum bias voltage and working temperature determined.
Variations in the SNR performance of PSAPDs with the same dimensions were small, but the SNR decreased significantly with increasing PSAPD size and increasing temperature. Smaller PSAPDs (10 mm and 15 mm in width) produced acceptable flood histograms at 24 °C, and cooling lower than 16 °C produced little improvement. The optimum bias voltage was about 25 V below the break down voltage. The larger 20 mm PSAPDs have lower SNR and require cooling to 0–7 °C for acceptable performance. The optimum bias voltage also is lower (35 V or more below the break down voltage depending on the temperature). Significant changes in the timing resolution were observed as the bias voltage and temperature were varied. Higher bias voltages provided better timing resolution. The best timing resolution obtained for individual crystals was 2.8 ns and 3.3 ns for the 10 mm and 15 mm PSAPDs, respectively. The results of this work provide useful guidance for selecting the bias voltage and working temperature for scintillation detectors that incorporate PSAPDs as the photodetector.
Keywords: Avalanche photodiode, signal-to-noise ratio, positron emission tomography, small animal imaging
1. Introduction
Avalanche photodiodes (APD) have attractive properties such as high quantum efficiency, thin cross-section and tolerance to high magnetic fields. They have been used as the photodetector in a range of scintillation detector applications, including small-animal positron emission tomography (PET) scanners (Bergeron et al., 2009; Vaska et al., 2004; Lecomte et al., 1996) and MR-compatible small-animal and clinical PET scanners (Judenhofer et al., 2008; Cherry et al., 2008; Pichler et al., 2010). Position-sensitive APDs (PSAPDs) are a novel variant of the single element APDs developed by Radiation Monitoring Devices (RMD) Inc. (Watertown, MA) (Shah et al., 2004; Shah et al., 2002). The back face of the APD consists of a resistive layer with four small corner contacts (anodes) that can provide position information based on comparison of the signal measured at each anode corner. Thus the device produces four position-related signals that vary in a continuous manner for events across the surface of the APD. The continuous position-sensing property typically allows PSAPDs (with appropriate cooling) to resolve smaller crystals as compared with position sensitive or multi-channel PMTs (St James et al., 2009; Yang et al., 2011). PSAPDs had been used by our laboratory in developing a MRI-compatible small-animal PET scanner (Catana et al., 2006; Wu et al., 2009a) and by other groups in developing PET (Levin et al., 2004; Zhang et al., 2007; Burr et al., 2004) and SPECT (Kim et al., 2010) detectors.
For several years we have been developing depth-encoding PET detectors in which scintillator arrays are readout from both ends by PSAPDs. The goal of such designs is to simultaneously obtain high spatial resolution, high efficiency and high (and uniform) depth-of-interaction resolution in designs for small-animal PET scanners (Yang et al., 2006; Yang et al., 2008; Yang et al., 2009; St James et al., 2009) and for a dedicated breast PET scanner (Chaudhari et al., 2008). These depth-encoding detector modules will be used in our next generation MR-compatible PET scanner and a dedicated high resolution mouse brain PET scanner. To guide the selection and optimal operating point of the PSAPDs in these detectors, in this work we measure the signal, noise, flood histograms and timing resolution of three different-sized PSAPDs as the temperature and bias voltages is varied.
2. Methods
A 6×6 LSO array, with a crystal pitch of 1.3 mm and a length of 20 mm, and polished crystal surfaces separated by enhanced specular reflector (3M, St. Paul, MN), was used in the measurements. PSAPDs with three different dimensions were studied, as summarized in Table 1. One end of the LSO array was coupled to the center of the PSAPDs with optical grease and teflon tape reflector was placed over the far end of the array. The detector module and PSAPD readout boards were placed in a black box that was cooled by cold, dry air using an Air-Jet Crystal Cooler (FTS Systems, Inc, Stone Ridge, NY). Data from each PSAPD was measured at several different temperatures, and for each temperature measured at several different bias voltages. The local temperature was measured by a K-type thermocouple probe located 5 mm from the PSAPDs.
Table 1.
Dimensions of the three types of PSAPDs evaluated.
| PSAPD | Physical area | Imaging area |
|---|---|---|
| 10 mm | 10×10 mm2 | 8×8 mm2 |
| 15 mm | 15×15 mm2 | 13×13 mm2 |
| 20 mm | 20×20 mm2 | 18×18 mm2 |
A 20 μCi 22Na point source was placed 50 mm above the LSO array. First, a measurement was performed using the computer internal clock as the data acquisition trigger (Judenhofer et al., 2005), thus sampling the noise distribution. The full width at half maximum (FWHM) of the measured signals (the sum of the four position-encoding output signals of PSAPD) was obtained by Gaussian fitting and treated as a measure of the noise of the PSAPD. Second, a measurement was performed with the detector signal as the data acquisition trigger. Detector flood histograms and energy spectra were obtained from this measurement. The amplitude of the 511 keV photopeak signal in the energy spectrum is proportional to the gain of PSAPD and was treated as the PSAPD signal. The signal-to-noise ratio (SNR) was computed from these two measurements. The shaping time of the spectroscopy amplifier was 100 ns in both cases. In total, three 10 mm, two 15 mm and two 20 mm PSAPDs were tested. Multiple devices were used to provide information on the consistency of performance across different devices with the same dimensions
To quantitatively compare the flood histograms, a flood histogram quality parameter k was calculated from the flood histogram of the central four crystals (figure 1) in the array as:
where wxi and wyi are the full widths at half maximum (FWHM) of the x and y projections of the flood histogram of the ith crystal, and xi and yi are the centroids of the x and y projections of the flood histogram of the ith crystal. The reason for using the middle four crystals is to avoid confounding edge effects when comparing flood histograms obtained from PSAPDs of different sizes. The same LSO array was used for all PSAPDs; therefore edge effects would be relatively larger for PSAPDs with smaller dimensions. k corresponds to the width of the crystal as measured in the flood histogram ratio space divided by the separation between neighboring spots in the vertical and horizontal directions, averaged over the central four crystals. Smaller values of k correspond to better separation of the crystals in the flood histogram.
Figure 1.
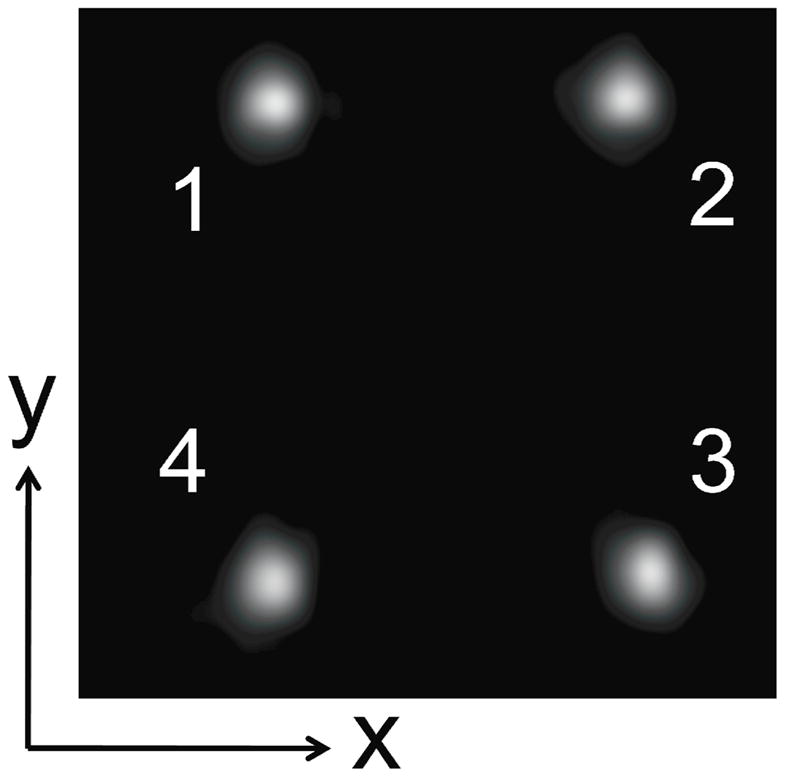
The four central crystals and coordinate system used to calculate the flood histogram quality parameter, k.
The timing resolution of a 10 mm PSAPD and a 15 mm PSAPD also was measured using a PMT detector (Hamamatsu R6231 single channel PMT + an LSO block measuring 18×18×10 mm3) as a timing reference. The experimental setup was similar to that previously published (Wu et al., 2009b) with standard NIM electronics used for obtaining timing spectra. The same 22Na point source was placed centrally between the PMT detector and PSAPD detector with a detector separation of 100 mm. The PSAPD was coupled to the same LSO array described above. To synchronize the time to amplitude (TAC) output signal with the four position-encoding energy signals so that the TAC signal and energy signals can be simultaneously recorded by the data acquisition system, a shaping time of 1 μs (compared to 100 ns employed in the previous measurements) was used for the energy signals. Since the flood histogram from the 20 mm PSAPD measured using this 1 μs shaping time was not of sufficient quality to resolve the crystals in the array, the timing resolution of this PSAPD was not measured. The calibrated TAC signal (the timing difference between the PMT detector and the PSAPD detector) was stored in list mode together with the position-encoding energy signals of the PSAPD. Each PSAPD was measured at four temperatures (2 °C to 19°C) and at five bias voltages for each temperature. A lower energy threshold of 250 keV was applied to the data. A crystal look up table (LUT) was obtained from the flood histogram and used to determine the timing spectra of individual crystals. The FWHM timing resolution and the peak position of the timing spectra (indicating relative timing offset for different crystal locations) were obtained by Gaussian fitting of the corresponding timing spectra.
3. Results
Figure 2 shows the signal, noise and SNR as a function of temperature and bias voltage for three PSAPDs (one of each size). At each temperature the highest bias voltage at which measurements are taken is about 5 V below the breakdown voltage of the PSAPD and represents the highest practical voltage that can be used. Both signal and noise slowly increase as the bias voltage increases and then increase rapidly as the breakdown voltage is approached. At the breakdown voltage, the PSAPD signal and noise sharply increases and the PSAPD ceases to function properly. The breakdown voltage is observed to increase by ~20 V for every 8 °C temperature increase. At a fixed bias voltage, both signal and noise decrease as temperature increases. The signal decreases more rapidly than the noise, therefore the SNR decreases as temperature increases. At the lower temperatures tested, the SNR slowly increases at lower voltages, reaches a maximum, and then decreases as the bias voltage becomes close to the breakdown voltage. At higher temperatures, the SNR decreases monotonically as the bias voltage increases. Bias voltage was only evaluated in the range from 45 V to 5 V below breakdown, as this represents the typical working range for these devices.
Figure 2.

Signal, noise and SNR vs. bias voltage curves for three different size PSAPDs at four different temperatures.
Figure 3 summarizes the SNR measured for all seven PSAPDs measured in this study at a temperature of 0 °C. The SNR of PSAPDs with the same dimensions is similar even though their working bias voltage may be quite different, as illustrated by the two 15 mm devices. Consistent with the findings in Figure 2, this larger sample of PSAPDs shows that SNR decreases as PSAPD size increases. At 0 °C, the maximum SNRs are 80 (10 mm PSAPD), 52 (15 mm PSAPD) and 24 (20 mm PSAPD). At 0 °C, the bias voltage that provides the best SNR is about 25 V below the breakdown voltage for 10 mm and 15 mm PSAPDs, and about 35 V below breakdown for the 20 mm PSAPD. The SNR results agree with the theoretical prediction that the optimum SNR of APDs will always be found at some intermediate gain (Redus and Farrell, 1996).
Figure 3.

SNR vs. bias voltage curves (temperature 0°C) for all PSAPDs measured in this study.
The noise components includes both the noise from the detector itself, as well as noise from the associated readout electronics. For reference, the electronic noise measured without connecting the PSAPD is ~0.1 units using the same scale as Figure 2. Thus, once cooling reduces PSAPD noise close to this level, further cooling will not significantly improve performance.
Figure 4 shows flood histograms obtained from each different PSAPD size at different bias voltages. All measurements were made at 7 °C. By visual inspection, the flood histograms of the 10 mm and 15 mm PSAPDs measured at intermediate voltages (15–35 V below break down voltage) are better than those measured at the highest bias voltage. For 20 mm PSAPDs, it appears that flood histograms measured at the lower bias voltages (35 and 45 V below breakdown) are better.
Figure 4.

Flood histograms from three PSAPDs (one of each size) measured at different bias voltages. Bias voltage is expressed in terms of voltage below breakdown voltage for each PSAPD. Measurements were acquired at 7°C.
Figure 5 shows the bias voltage that produced the best flood histograms (determined as the flood histogram that gave the lowest value of the histogram quality parameter k) for each of the three PSAPD sizes at four different temperatures. The degradation of the flood histograms with increasing temperature and PSAPD size is readily observed.
Figure 5.

Optimal flood histograms obtained by changing bias voltage to minimize quality parameter for different PSAPD sizes and temperatures.
Figure 6 shows the flood histogram quality parameter, k, as a function of bias voltage and temperature for each of the three PSAPD sizes. Figure 7 shows k across all seven PSAPDs, measured at 0 °C. Interestingly, at 0 and 7 °C, the k values for the flood histograms from the 10 and 15 mm PSAPDs are similar although the corresponding SNRs are different (see Figures 2 and 3). This implies that other effects (such as the photoelectron statistics) rather than SNR are the dominant effect in determining flood histogram quality. Improving SNR, by further cooling or by using smaller PSAPD sizes, does not lead to significant improvements in the flood histogram. The flood histograms from the 20 mm PSAPDs, as determined by the parameter k, are significantly worse than the smaller PSAPDs and they continue to improve with additional cooling. Overall, the flood histograms from the 10 mm and 15 mm PSAPDs are not strongly dependent on temperature, and cooling to an operating temperature of 16 °C appears sufficient to achieve high performance. The 20 mm PSAPDs need to work at lower temperatures and should be cooled below 7 °C. The optimum bias voltage of PSAPDs, assessed in terms of flood histogram quality, is about 25 V below the breakdown voltage for both the 10 mm and 15 mm PSAPDs. For the 20 mm PSAPD, the optimum bias voltage is dependent on the working temperature. For temperatures of 0 and 7°C, the optimum voltage is 35 V below the breakdown voltage and at higher temperature the optimum bias voltage is more than 45 V below the breakdown voltage. Figure 7 clearly shows the performance advantage and relative insensitivity to the bias voltage for the 10 and 15 mm PSAPDs versus the 20 mm PSAPDs.
Figure 6.

Flood histogram quality parameter (lower value corresponds to better quality) vs. bias voltage curves for three different size PSAPDs measured at four temperatures.
Figure 7.

Flood histogram quality parameter vs. bias voltage curves for all seven PSAPD samples measured at 0 °C.
PSAPDs show a position-dependent timing shift since the rise time of the signal become slower as the location of events move from the edge to the center of the PSAPD. The characterization of these timing shift values and methods for correcting the timing shift can be found in previous publications (Wu et al., 2009b; Yang et al., 2008). This study focuses on comparing the timing resolution for PSAPDs at different bias voltages and temperatures. Figure 8 shows the average timing resolution of all the individual crystals in the LSO array. Note that for these timing measurements, the highest bias voltage measured is 10 V below the breakdown voltage. Significant changes in timing resolution were observed for different bias voltages and temperatures. Timing resolution degrades as the temperature and PSAPD size increase. The best crystal timing resolution obtained was 2.8 ns for the 10 mm PSAPD and 3.3 ns for the 15 mm. Higher bias voltage provides better timing resolution. However, the variation of the timing resolution for bias voltages of 10–30 V below the break down voltage is less than 20%. The timing resolution results agree well with the model prediction and the experimental results for the Hamamatsu S4641 APD published by Casey et al. (Casey et al., 2003).
Figure 8.

Average timing resolution of individual crystals vs. bias voltage curves for 10 mm (left) and 15 mm (right) PSAPDs at four different temperatures.
4. Discussion and Conclusions
PSAPDs are attractive photon detectors for small-animal PET scanners, MRI-compatible PET scanners and small-animal SPECT scanners. In this study we measured the signal, noise, SNR, flood histogram and timing resolution for PSAPDs with different dimensions, and at different bias voltage and temperatures, in order to find the optimum bias voltage and temperature for operating these PSAPDs.
In this study, we proposed and tested a simple method of measuring the detector noise by using internal computer clock as the data acquisition trigger. The method can also be used to measure noise of other types of detectors. We also proposed a new method to quantify the quality of measured flood histograms, to complement visual inspection and create an objective approach for measuring differences in flood histogram quality between detectors and operating conditions. This method uses the width of the individual crystals as seen in the flood histogram coordinate system, divided by the separation of neighboring crystals, as a figure of merit of the flood histogram quality. This flood histogram quality parameter can readily be calculated using automated software.
Our study shows that PSAPD performance (in terms of SNR, flood histogram quality and timing resolution) generally degrades as the temperature and PSAPD size increases. The breakdown voltage of the PSAPDs decreases ~20 V for every 8 °C decrease in temperature. For 10 mm and 15 mm PSAPDs, the flood histograms are of excellent quality at all temperatures tested when reading out a 1.3 mm pitch LSO array. Thus, mild cooling is sufficient. However, this does not obviate the need to control the working temperature of the PSAPDs very carefully, as the signal (gain) of the PSAPDs is a strong function of temperature at a given bias voltage. Significant changes in the timing resolution were observed for different bias voltages and temperatures. For 10 mm and 15 mm PSAPDs, the optimum bias voltage is about 25 V below the break down voltage for all measured temperatures. PSAPDs need to work at relatively lower bias voltage (40–50 V below break down) when the noise is higher (at higher temperature and for larger PSAPDs).
Importantly, the optimum bias voltage (25 V below break down) determined from SNR and flood histogram measurements coincides with the bias voltage that provides the best timing resolution for 10 mm and 15 mm PSAPDs. The results of this study provides critical information for deploying large numbers of these PSAPD photodetectors in future PET scanner designs in terms of the choice of APD size and working bias voltages and temperature.
Acknowledgments
This work was funded by NIH grants R01 EB006109 and R01 EB000993.
References
- Bergeron M, Cadorette J, Beaudoin JF, Lepage MD, Robert G, Selivanov V, Tetrault MA, Viscogliosi N, Norenberg JP, Fontaine R, Lecomte R. Performance evaluation of the LabPET APD-based digital PET scanner. IEEE Trans Nucl Sci. 2009;56:10–6. [Google Scholar]
- Burr KC, Ivan A, Castleberry DE, LeBlanc JW, Shah KS, Farrell R. Evaluation of a prototype small animal PET detector with depth-of-interaction encoding. IEEE Trans Nucl Sci. 2004;51:1791–8. [Google Scholar]
- Casey ME, Reynolds C, Binkley DM, Rochelle JM. Analysis of timing performance for an APD-LSO scintillation detector. Nucl Instrum Methods Phys Res Sect A-Accel Spectrom Dect Assoc Equip. 2003;504:143–8. [Google Scholar]
- Catana C, Wu YB, Judenhofer MS, Qi JY, Pichler BJ, Cherry SR. Simultaneous acquisition of multislice PET and MR images: Initial results with a MR-compatible PET scanner. J Nucl Med. 2006;47:1968–76. [PubMed] [Google Scholar]
- Chaudhari AJ, Yang YF, Farrell R, Dokhale PA, Shah KS, Cherry SR, Badawi RD. PSPMT/APD hybrid DOI detectors for the PET component of a dedicated breast PET/CT system - A feasibility study. IEEE Trans Nucl Sci. 2008;55:853–61. [Google Scholar]
- Cherry SR, Louie AY, Jacobs RE. The integration of positron emission tomography with magnetic resonance imaging. Proceedings of the IEEE. 2008;96:416–38. [Google Scholar]
- Judenhofer MS, Pichler BJ, Cherry SR. Evaluation of high performance data acquisition boards for simultaneous sampling of fast signals from PET detectors. Phys Med Biol. 2005;50:29–44. doi: 10.1088/0031-9155/50/1/003. [DOI] [PubMed] [Google Scholar]
- Judenhofer MS, Wehrl HF, Newport DF, Catana C, Siegel SB, Becker M, Thielscher A, Kneilling M, Lichy MP, Eichner M, Klingel K, Reischl G, Widmaier S, Rocken M, Nutt RE, Machulla HJ, Uludag K, Cherry SR, Claussen CD, Pichler BJ. Simultaneous PET-MRI: a new approach for functional and morphological imaging. Nature Medicine. 2008;14:459–65. doi: 10.1038/nm1700. [DOI] [PubMed] [Google Scholar]
- Kim S, McClish M, Alhassen F, Seo Y, Shah KS, Gould RG. Phantom experiments on a PSAPD-based compact gamma camera with submillimeter spatial resolution for small animal SPECT. IEEE Trans Nucl Sci. 2010;57:2518–23. doi: 10.1109/TNS.2010.2056386. [DOI] [PMC free article] [PubMed] [Google Scholar]
- Lecomte R, Cadorette J, Rodrigue S, Lapointe D, Rouleau D, Bentourkia M, Yao R, Msaki P. Initial results from the Sherbrooke avalanche photodiode positron tomograph. IEEE Trans Nucl Sci. 1996;43:1952–7. [Google Scholar]
- Levin CS, Foudray AMK, Olcott PD, Habte F. Investigation of position sensitive avalanche photodiodes for a new high-resolution PET detector design. IEEE Trans Nucl Sci. 2004;51:805–10. [Google Scholar]
- Pichler BJ, Kolb A, Nagele T, Schlemmer HP. PET/MRI: paving the way for the next generation of clinical multimodality imaging applications. J Nucl Med. 2010;51:333–6. doi: 10.2967/jnumed.109.061853. [DOI] [PubMed] [Google Scholar]
- Redus R, Farrell R. Gain and noise in very high gain avalanche photodiodes: theory and experiment. Hard X-Ray/Gamma-Ray and Neutron Optics, Sensors, and Applications; Denver, CO, USA. Proc. SPIE; 1996. p. 2859. [Google Scholar]
- Shah KS, Farrell R, Grazioso R, Harmon ES, Karplus E. Position-sensitive avalanche photodiodes for gamma-ray imaging. IEEE Trans Nucl Sci. 2002;49:1687–92. [Google Scholar]
- Shah KS, Grazioso R, Farrell R, Glodo J, McClish M, Entine G, Dokhale P, Cherry SR. Position sensitive APDs for small animal PET imaging. IEEE Trans Nucl Sci. 2004;51:91–5. [Google Scholar]
- St James S, Yang YF, Wu YB, Farrell R, Dokhale P, Shah KS, Cherry SR. Experimental characterization and system simulations of depth of interaction PET detectors using 0.5 mm and 0.7 mm LSO arrays. Phys Med Biol. 2009;54:4605–19. doi: 10.1088/0031-9155/54/14/015. [DOI] [PMC free article] [PubMed] [Google Scholar]
- Vaska P, Woody CL, Schlyer DJ, Shokouhi S, Stoll SP, Pratte JF, O’Connor P, Junnarkar SS, Rescia S, Yu B, Purschke M, Kandasamy A, Villanueva A, Kriplani A, Radeka V, Volkow N, Lecomte R, Fontaine R. RatCAP: Miniaturized head-mounted PET for conscious rodent brain imaging. IEEE Trans Nucl Sci. 2004;51:2718–22. [Google Scholar]
- Wu YB, Catana C, Farrell R, Dokhale PA, Shah KS, Qi JY, Cherry SR. PET Performance Evaluation of an MR-Compatible PET Insert. IEEE Trans Nucl Sci. 2009a;56:574–80. doi: 10.1109/TNS.2009.2015448. [DOI] [PMC free article] [PubMed] [Google Scholar]
- Wu YB, Ng TSC, Yang YF, Shah K, Farrell R, Cherry SR. A study of the timing properties of position-sensitive avalanche photodiodes. Phys Med Biol. 2009b;54:5155–72. doi: 10.1088/0031-9155/54/17/006. [DOI] [PMC free article] [PubMed] [Google Scholar]
- Yang YF, Dokhale PA, Silverman RW, Shah KS, McClish MA, Farrell R, Entine G, Cherry SR. Depth of interaction resolution measurements for a high resolution PET detector using position sensitive avalanche photodiodes. Phys Med Biol. 2006;51:2131–42. doi: 10.1088/0031-9155/51/9/001. [DOI] [PubMed] [Google Scholar]
- Yang YF, Qi JY, Wu YB, St James S, Farrell R, Dokhale PA, Shah KS, Cherry SR. Depth of interaction calibration for PET detectors with dual-ended readout by PSAPDs. Phys Med Biol. 2009;54:433–45. doi: 10.1088/0031-9155/54/2/017. [DOI] [PMC free article] [PubMed] [Google Scholar]
- Yang YF, St James S, Wu YB, Du HN, Qi JY, Farrell R, Dokhale PA, Shah KS, Vaigneur K, Cherry SR. Tapered LSO arrays for small animal PET. Phys Med Biol. 2011;56:139–53. doi: 10.1088/0031-9155/56/1/009. [DOI] [PMC free article] [PubMed] [Google Scholar]
- Yang YF, Wu YB, Qi J, James ST, Du HN, Dokhale PA, Shah KS, Farrell R, Cherry SR. A prototype PET scanner with DOI-encoding detectors. J Nucl Med. 2008;49:1132–40. doi: 10.2967/jnumed.107.049791. [DOI] [PMC free article] [PubMed] [Google Scholar]
- Zhang J, Foudray AMK, Cott PD, Farrell R, Shah K, Levin CS. Performance characterization of a novel thin position-sensitive avalanche photodiode for 1 mm resolution positron emission tomography. IEEE Trans Nucl Sci. 2007;54:415–21. [Google Scholar]