

Abstract
The sensitivity of magnetic resonance imaging (MRI) contrast agents is highly dependent on the rate of water exchange between the inner-sphere of a paramagnetic ion and bulk water. Normally, identifying a paramagnetic complex that has optimal water exchange kinetics is done by synthesizing and testing one compound at a time. We report here a rapid, economical on-bead combinatorial synthesis of a library of imaging agents. Eighty different DOTA-tetraamide peptoid derivatives were prepared on beads using a variety of charged, uncharged but polar, hydrophobic and variable-sized primary amines. A single chemical exchange saturation transfer (CEST) image of the on-bead library easily distinguished those compounds having the most favorable water exchange kinetics. This combinatorial approach will allow rapid screening of libraries of imaging agents to identify the chemical characteristics of a ligand that yield the most sensitive imaging agents. This technique could be automated and readily adapted to other types of MRI or MR/PET agents as well.
Keywords: Combinatorial, PARACEST, MRI contrast agents, Peptoids
Introduction
Magnetic resonance imaging (MRI) is one of the most important diagnostic imaging tools in clinical medicine today. Exogenous paramagnetic metal complexes are often used as contrast agents to shorten the relaxation times of the water protons and thereby enhance tissue contrast in regions where such agents accumulate. Over the past few years, new methods have been explored for introducing image contrast1 including those based on chemical exchange saturation transfer (CEST) mechanisms.2-11 Briefly, CEST contrast arises as a result of selective saturation (through application of a suitable radiofrequency field) of a proton pool that is in slow-to-intermediate exchange with bulk water protons. Chemical transfer of those saturated spins originally on the agent into the water pool results in a decrease in the measured water signal, hence darkening of the image. Originally, the attention was focused on protons from small diamagnetic molecules with –NH and –OH protons in exchange with bulk water.8,12-13 However, the chemical shift difference between the exchanging protons and bulk water in such diamagnetic CEST agents is typically < 5 ppm. This makes it technically more difficult to saturate one proton pool without inadvertently also partially affecting the other as well. One advantage of using paramagnetic lanthanide complexes as CEST agents (PARACEST) is that the chemical shift difference between the two exchangeable pools can be increased substantially. For example, a slowly exchanging bound water resonance near 50 ppm is often seen in CEST spectra of EuDOTA-tetraamide complexes such as those shown in Fig. 1.7 This makes it easy to selectively saturate this exchanging pool without affecting the bulk water signal. PARACEST agents such as these have some potential advantages over the more conventional T1 and T2 relaxation agents because image contrast is under operator control and can be turned on and off at will.8 A second advantage is that the CEST signal produced by EuDOTA-tetraamide complexes is quite sensitive to the rate of water molecule exchange between the inner-sphere of the Eu(III) coordination site and bulk water.14 This makes it easy to design responsive agents that alter this rate by ligand electronic effects, stereochemistry and polarity of the neighboring substituents [Fig. 1(R1 and R2)].6 The primary disadvantage of current PARACEST agents is their low sensitivity compared to conventional T1 and T2 agents.5
Figure 1.

Schematic representation of a Eu(III)-DOTA-based PARACEST agent where the position of the Eu(III)-bound water molecule is shown (arrows). The exchange kinetics of this water molecule with bulk water is modulated by the surrounding ligands on the four arms of the DOTA scaffold (e.g. R1 and R2 represent the two peptoid residues that build diversity into the combinatorial library developed in this study).
Previous experiments have shown that a complex interplay of chemical factors contribute to water exchange in these complexes and that CEST sensitivity may be improved substantially by dramatically slowing the rate of water exchange in these complexes.6 However, it is a difficult challenge to understand how all these possible parameters collectively influence the CEST signal by synthesizing and studying one agent at a time, the usual approach. Also, this is a major limitation in identifying the optimal PARACEST agents using this time consuming conventional solution phase synthesis and MRI analysis. For this reason, we have been exploring the possibility of introducing a large number of chemical variables into the basic DOTA scaffold using on-bead combinatorial chemical methods in an effort to directly identify those chemical features that yield optimal water exchange rates for CEST imaging. The advantages of collecting a single CEST image of a small library of polypeptides in solution have been demonstrated previously.15-16 Here, we report (i) a rapid, convenient on-bead synthesis of a library of 80 different PARACEST agents that differ only in the chemical identity of side arms on the DOTA scaffold [Fig. 1(R1 and R2)] and (ii) a method for simultaneous CEST imaging of the entire library without removal of the agents from the beads. The resulting images provide a direct readout of those structures that display the best water exchange properties for CEST imaging.
Experimental Methods
On-bead bulk synthesis of parent compound 16
TentaGel macrobeads were placed in 5 peptide reaction vessels (total 1g, 200 mg/vessel), swelled in DMF and treated with Fmoc-Met-OH, HBTU and NMM in DMF overnight. After washing with DMF, Fmoc group was removed (20% piperidine in DMF). Peptoid portion (addition of two methoxyethylamine units) was carried out using two step (bromoacetylation and methoxyethylamine substitution) microwave-assisted synthesis protocol [10 % power (2 × 15 s)] as previously reported.17 Then Fmoc-β-Ala-OH was coupled as described above for the methionine coupling. After removal of Fmoc group, beads were treated with bromoacetic acid/DIC in the microwave oven at 10 % power (2 × 15 s). Beads were then treated with 1 M DO3A-tris(tBu ester) solution in the microwave oven at 10 % power (3 × 15 s). After washing with DMF and DCM, tert-butyl groups were removed (95% TFA, 2.5 % triisopropylsilane, and 2.5 % water, 4 h). After washing with DCM and DMF, beads were treated with N-Boc-1,2-diaminoethane, HBTU and NMM for 24 h. Finally, Boc group was removed as described above using 95% TFA condition.
Synthesis of the Library
The library was synthesized starting from the parent compound 16 (Scheme 2) and adding two peptoid moieties onto each of the three free arms of the DOTA scaffold. Bromoacetic acid coupling of the first peptoid residue was performed in bulk synthesis. Then, beads were equally (∼10 mg/well) distributed into a 96-AcroWell™ filter plate (PALL). The first eight amines (Chart 1, some were protected accordingly) were added (2M, 180 μl/well) to each row of the plate (shaking 2h, 250 rpm). After DMF washing by centrifugation, bromoacetic acid/DIC was added for 30 min, twice (shaking 2h, 250 rpm). After DMF washing, ten amines (Chart 1) were added to each column of the plate. Beads containing β-Alanine and 1,2-diaminoethane were transferred to another TFA resistant 96-well plate, treated with 95% TFA, 2.5 % triisopropylsilane, and 2.5 % water mixture for 4 h to remove tert-butyl and Boc protection group. Beads were washed with DCM and DMF and finally neutralized with 20% piperidine in DMF for 5 min and transferred to the previous plate. All wells were washed with water and allowed to swell in water for 1 h. The metal complexation was performed with a 0.2 M EuCl3 solution at pH = 6.3 overnight. Finally, beads were washed with water (5 ×), dried and stored at 4 °C.
Scheme 2.
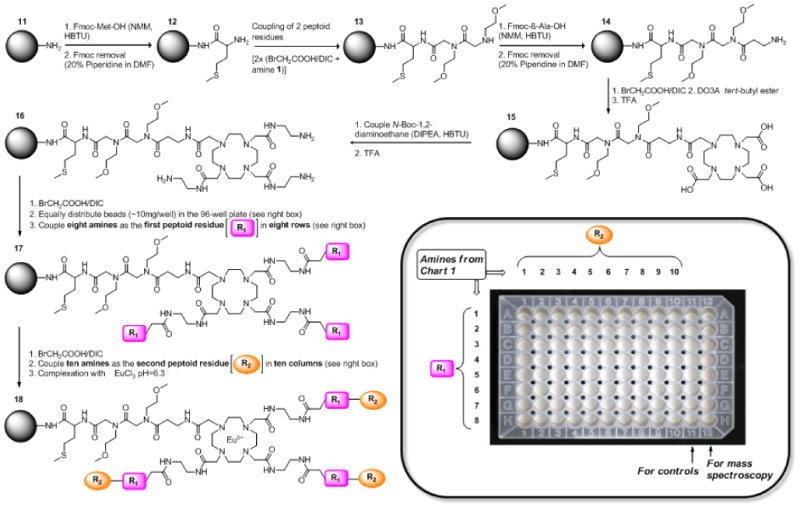
The flow chart of the complete library synthesis.
Chart 1.
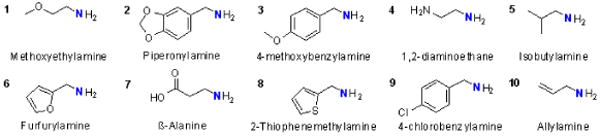
Structures of the 10 primary amines used to build the library.
Cleavage, purification and mass analysis
The cyanogen bromide cleavage18 was used to confirm the synthesis of each step up to compound 16 and then the ten representative compounds of the library. Beads were treated with the cleavage solution (0.28 M CNBr in a 5:4:1 acetonitrile:acetic acid:water mixture) overnight. CNBr and acetic acid were removed under a nitrogen flow. Residue was redissolved in acetonitrile:water at 1:1 mixture for mass and HPLC analysis.
NMR
CEST spectra were collected on beads placed in 3 mm NMR tubes filled with water using a Varian 9.4 T NMR system with the sample temperature maintained at 25 °C. A B1 of 300 Hz and 5 s duration was applied at each frequency prior to collection of a 1H spectrum of water.
CEST imaging of the library
In vitro imaging was performed on a Varian 9.4 T animal system using a 63 mm diameter quadrature volume coil. The samples were placed at the gradient iso-center with the temperature maintained at 20 °C using warmed air and thermocouple. A single coronal plane (64×64×2 mm) passing through the bottom portion of each sample well was selected for imaging. Image-based CEST-spectra acquired with the fast spin-echo sequence (TR/TE = 69.8/8.4 msec, echo train = 8, averages = 2, 64×64×1 pixel matrix) were used to measure the CEST frequency (Δω) for each well. Images were then acquired using the fast spin-echo sequence (TR/TE = 69.8/8.4 msec, echo train = 8, averages = 2, 64×64×1 pixel matrix) with saturation at both 50 ppm (“on”) and -50 ppm (“off”). A 5 second long, 10 μT saturation pulse was used for every TR. A CEST image was created by subtracting the two images (“off”-“on”). Spatial susceptibility effects within the samples were minimized using two methods. First, the 8×11 sample wells were surrounded by a 2 well thick boarder of pure water. Second, after the first set of images was taken, the sample was rotated by 180° and imaged again. The two CEST images at 0° and 180° were then averaged. These methods assured that the CEST variations from well to well were due to changes in chemical configuration and not susceptibility effects.
Eu(III) quantitative assay
Ten beads from each of the individual wells selected were isolated and collected in Eppendorf tubes. 2.0 M HCl (50 μL/tube) was added and incubated at 37 °C for 2 h. Then samples were neutralized using 2.0 M NaOH (55 μL/tube). The enhancement solution was added (115 μL/tube) and incubated for 30 min at 37 °C. Fluorescence emission at 615 nm was detected using SpectraMax M5 Spectrophotometer.
Results and Discussion
The solid-phase synthesis strategy was to (i) attach a DOTA scaffold to TentaGel™ macrobeads (300 μM diameter) through a linker to a single carboxyl group, (ii) couple ethylenediamine to the remaining three carboxyl groups of DOTA to provide terminal amines for building the library, and (iii) add two rounds of ‘peptoid’ monomers to the three free primary amino groups to create the ligand library. Peptoids were selected as the diversity component [Fig. 1(R1 and R2)] because the chemistry is simple and fast and many primary amines are available that would introduce a variety of chemical properties into the ligand side-arms (hydrophobicity, size, charge). The well-established on-bead peptoid synthesis is based on simple two step chemical reactions; an acylation step using diimide-activated bromoacetic acid followed by nucleophilic displacement of the bromide with a primary amine (Scheme 1).19 These reactions are not air-sensitive or particularly moisture sensitive and typically take place in high yield at each step. Thus, the entire process can be automated, adapted to most commercial peptide synthesizers, and even accelerated to less than one minute using microwave irradiation.17 The amines chosen for the library provided variable charge, polarity, and steric bulk around the Eu(III)-water exchange site (Chart 1). The blue colored nitrogen atom in each amine (Chart 1) will be incorporated to the peotoid backbone (See, Scheme 1, 2nd step), leaving the remaining portion as the “R” group.
Scheme 1.
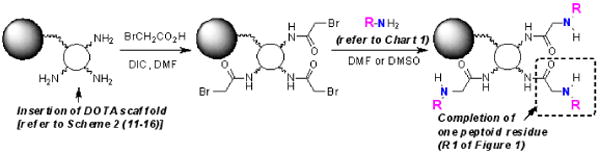
Two basic peptoid synthesis steps carried out on bead attached DOTA scaffold adding one peptoid residue.
The synthesis scheme is shown in Scheme 2. The initial common synthetic steps [steps 11→16, Scheme 2] were carried out in bulk using standard glassware while the remaining diverse regions [steps 17→18, Scheme 2] were carried out using a 96-well synthesis filter plate [Scheme 2 (insert)]. First, a spacer between the bead and the DOTA scaffold was introduced. Methionine was added as the first residue of the spacer arm so the final product could be cleaved from the resin with cyanogen bromide for subsequent mass spectroscopic confirmation. To obtain reasonably symmetrical DOTA-tetraamide products and to limit possible steric hindrance between the EuDOTA complex and the bead surface, two neutral methoxyethylamine moieties were added next. Here, both the bromoacetic acid addition and amine coupling reactions were assisted by microwave irradiation.17,19 Then, β-alanine was added to mimic the ethylendiamine spacer planned for the other three DOTA arms and finally DO3A tert-butylester was coupled. The three remaining carboxyl groups of DOTA were then reacted with mono-protected 1,2-diaminoethane [step 15→16, Scheme 2] to yield 16, the starting material for building the peptoid library.
A critical test was carried out at this point to verify that resin-bound DOTA-tetraamide forms a complex with Eu(III) and to test whether a CEST signal could be detected with the EuDOTA-tetraamide complex bound to the beads. Eu(III) complexation was performed by addition of ∼15-fold excess EuCl3 at pH=6.3 overnight, followed by removal of excess Eu(III) by washing the resin several times with water. A few beads were then removed and placed in a glass capillary for collection of a CEST spectrum using a vertical bore 400 MHz NMR spectrometer. Importantly, a large Eu(III)-bound water-exchange peak was observed in the CEST spectrum near 50 ppm (Fig. 2, squares). No CEST was observed for ligand 16 alone [no Eu(III)] or empty beads treated with EuCl3, confirming that the CEST signal reflects Eu*16 attached to the beads (Fig. 2). The CEST signal of a solution of Eu*16 after it was cleaved from beads (see supplementary Fig. S2 online) displayed a similar chemical shift as the bead-bound complex but the exchange peak was slightly broader (Fig. 2, crosses). This implies that water exchange may be somewhat slower for the complex attached to beads, although absolute comparisons of exchange rates were not possible because the concentrations of the two samples were unknown. Most importantly, these data show that the CEST signal from a covalently-attached complex (Eu*16) is not strongly influenced by the presence of the Tentagel beads. This observation allowed us to proceed with the synthesis of a diverse chemical library of CEST ligands, including hydrophobic side-arms that might not ordinarily be soluble when prepared in bulk.
Figure 2.
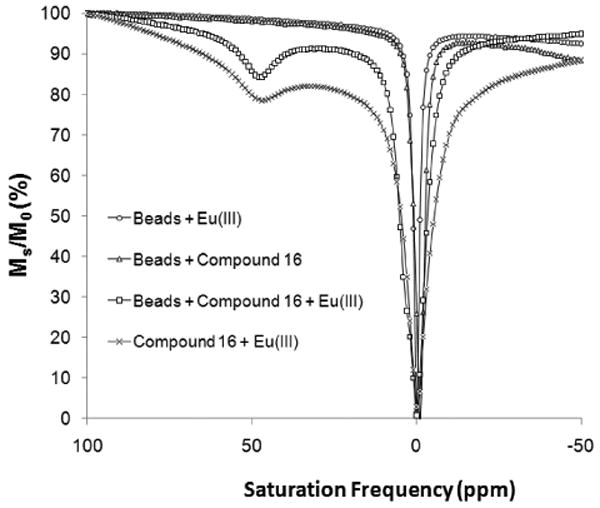
A comparison of Z-spectra of Eu*16 attached to beads with different controls [Eu*16 attached to beads, Eu*16 in solution without the beads, beads alone (no 16, but treated with Eu(III)) or beads with ligand 16 but no added Eu(III)].
The parallel combinatorial synthesis approach was used to couple two peptoid residues onto 16. Bromoacetic acid was coupled (of the first peptoid residue) to 16 in bulk before the beads were distributed equally into a 96-well synthesis plate [Scheme 2 (insert)]. To avoid possible inhomogeneous microwave irradiation in the different wells of the plate, the remaining peptoid coupling steps were performed for an extended period of time at room temperature.17 The first eight rows and ten columns were used for synthesis of the library; column 11 was used for controls and column 12 was used for synthesis of additional eight random combinations of amines (see supplementary Table S3 online) for cleavage and mass spectroscopy analyses.
Eight different amines [1-8, Chart 1] were coupled to remaining three arms of DOTA to complete the first residue in each row [i.e., R1 in row 1 was methoxyethylamine (1), R1 in row 2 was piperonylamine (2), R1 in row 3 was 4-methoxybenzylamine (3), etc]. This was followed by a second bromoacetic acid coupling step to prepare for the second amine. Amines 1-10 (Chart 1) were chosen as residue R2; 1 was added to each of eight wells in column 1, 2 was added to each of eight wells in column 2, etc. to yield an array of compounds having the same first peptoid along each row (R1 = 1-8) and the same second residue along each column (R2 = 1-10). This simple approach allowed rapid access to 8 × 10 = 80 different compounds, all built on the same parental DOTA-tetraamide scaffold and differing only in the chemical identity of R1 and R2. Finally, Eu(III) complexation was performed as described previously. Before proceeding with the MRI measurements, the quality of the library was checked by analyzing the representative compounds synthesized in the 12th column using MALDI-TOF MS to confirm the complete synthesis of all 8 compounds (see supplementary Table S3 online). Random samples were not withdrawn from the actual 80 compound library for this purpose in order to have same number of beads in each well for imaging.
To register a single image for all 80 compounds plus controls, the beads were first transferred from the synthesis/filtration plate to the central 80 wells of a 145 well-plate to maximize the height of the packed beads in 4 mm diameter well. All 145 wells were filled with water, including those on the perimeter that did not contain beads, to make the sample as homogeneous as possible. The plate was then positioned in the center of a 63 mm quadrature volume coil and CEST imaging was performed by applying a 10 μT frequency-selective presaturation pulse for 5 s followed by a spin-echo sequence using a 9.4 T Varian scanner. A 2 mm-thick coronal slice was selected near the bottom of each well to insure that each image would reflect an equal number of beads (the height of packed beads in each well was > 3 mm). The resulting CEST image (Fig. 3) is defined as the difference in water intensities in an image collected with the presaturation pulse set to -50 ppm (control) minus a second image collected with the presaturation pulse set to 50 ppm. This experiment was repeated on another day and the same image was obtained thereby confirming the reproducibility of this library imaging experiment.
Figure 3.
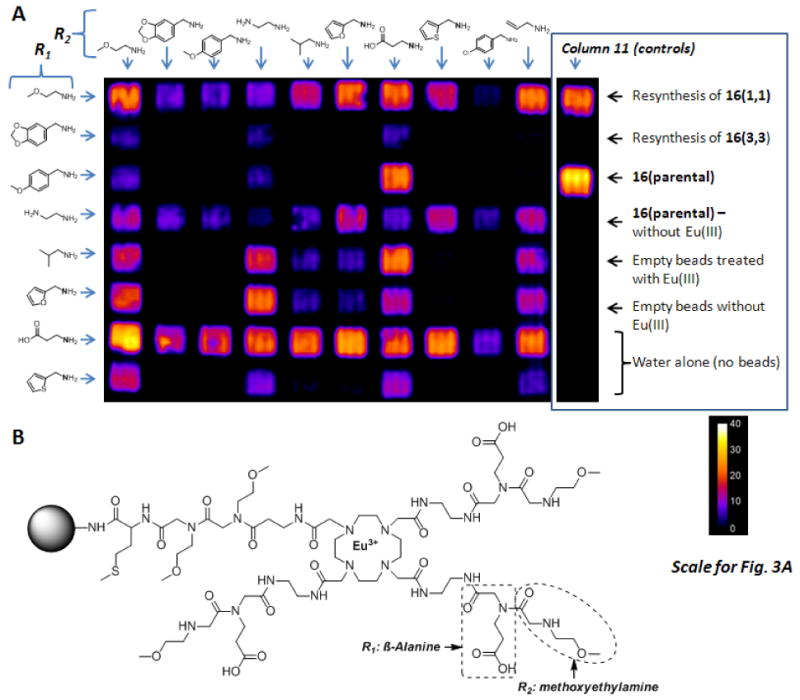
A: CEST image of 80 compound library of Eu(III)-DOTA tetraamide peptoid derivatives attached to beads. The color scale displays the percent change in bulk water intensity (1-Ms/Mo) with a presaturation pulse set either off resonance (Mo) or on resonance (Ms). The chemical structures of each amine used to build the library are shown along each horizontal row (R1) and each vertical column (R2). A number of control samples were located in Column 11, identified as indicated in the figure. B: The structure of the Eu(III)DOTA-tetraamide peptoid (bead attached form) in well (7,1) that showed the highest CEST intensity.
After the plate was imaged, 10 beads were collected from each of eleven wells selected from those that showed large variations in CEST signal intensities that includes empty beads and beads from the well containing Eu*16. These beads were treated with HCl to displace all Eu(III) from each chelate and analyzed for total Eu(III) using a commercially available fluorescence enhancement assay.20-21 These data (Fig. 4) indicated that there was an identical amount of total Eu(III) in each 10-bead sample and that empty beads treated with Eu(III) did not retain a significant amount of ion. Thus, any intensity differences in the CEST images shown in Fig. 3 could be attributed solely to consequences of the chemical differences of the side-arms in the 80 different EuDOTA-tetraamide complexes and not differences in agent concentrations.
Figure 4.
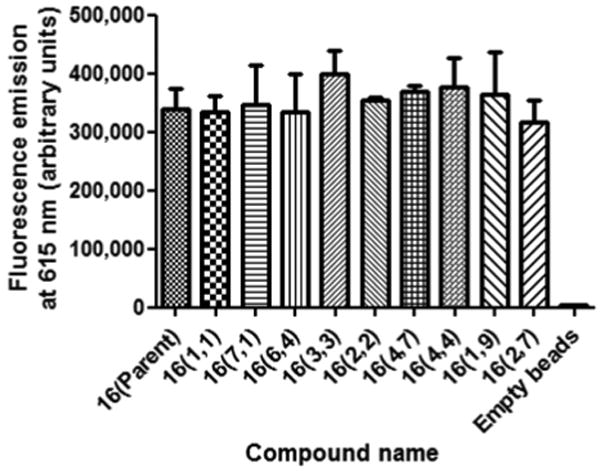
Eu(III) quantification of 10 beads collected from each of eleven wells (as identified below each column).
The resulting CEST image (Fig. 3) illustrates the power of the technique; the CEST signal in some wells was quite intense (up to a 30% reduction in water intensity) while little to no CEST was detected in other wells. To check whether this may be due to frequency differences in the exchanging Eu(III)-bound water resonance in each complex, complete CEST spectra were collected on several individual wells (Fig. 5) and to show that the spectra were consistent with the imaging data. For those wells showing a CEST signal, the Eu(III)-bound water exchange peak appeared between 50-51 ppm (Fig. 5) in all cases. The quantitative % CEST signal (1-(M(+50)/M(-50)*100) from each well varied from zero to 25% (Table 1, Supplementary Information) and was consistent with the qualitative image intensities shown in Fig. 3. The most intriguing part of the study came from a comparison of the combined effects of various physico-chemical properties of R1 and R2 on water exchange at each Eu(III) center.
Figure 5.
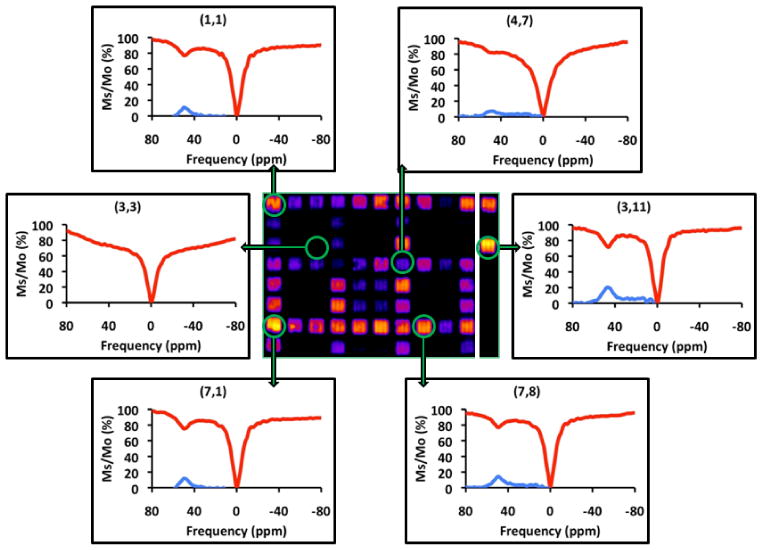
On-bead Z-spectra collected from each of six selected wells of the library.
The most intense CEST signals came from wells containing Eu(III) complexes with small ether, polar, or charged residues like methoxyethyl (1), carboxyethyl (7), or the furans (6 and 8) [compounds in wells (1,1), (1,6), (1,7), (7,1), (7,6), (7,7) and (7,8); where the designation (R1,R2) refers to (row, column), Fig. 3A]. Interestingly, the position of each residue also had consequences on the CEST signal intensity. A more intense CEST signal was seen when a carboxyethyl group (7) was the first residue, (almost independent of which residue was present at the second position; see row 7) compared to when it was the second residue (column 7). For example, equally intense CEST signals were seen for compounds containing the carboxyethyl group (7) in the first peptoid position and either 2-methylfuran (7,6) or 2-methylthiophene (7,8) in the second position but when the sequence was inverted [(6,7) and (8,7)], both resulted in a weak CEST signal. Thus, one can conclude that the presence of a negatively charged group in the peptoid positioned closest to the Eu(III) center has a positive influence on the CEST signal. This is consistent with previous data reporting that EuDOTA-tetraglycinate has one of the slowest water exchange rates of any CEST agent reported to date.22 The opposite trend was seen for the positively-charged aminoethyl group (4). Here, the CEST intensities did depend on the identity of the second group but, in general, a larger CEST signal was seen for those compounds where the positively charged group (4) occupied the second position of the peptoid sequence, not the first (compare the three bright signals in column 4 with the virtually all dark signals in row 4). This was highlighted even further for those compounds having one positively and one negatively charged group together in one sequence; in this case, as usual the best CEST signal was found for those compounds with the negatively charged carboxyethyl group (7) closest to the metal center (7,4). When the positively charged aminoethyl group (4) occupied the first position, this cancelled most of the advantage of having the negatively charged carboxyethyl group in the second position [compare the signal intensity of (4,7) with that of (3,7) or (5,7)]. This suggests that having a non-polar group close to the metal center is more advantageous than having a positively charged group near the metal center, as long as the second position is occupied by the negatively charged, carboxyethyl group [(1,7) (3,7), (5,7), (6,7)].
In all cases, the bulkier aromatic groups, 5-benzyl-1,3-dioxole (2), 4-methoxybenzyl (3), or 4-chlorobenzyl (9) resulted in the weakest CEST signals, regardless of their position in the peptoid sequence (compare the number of dark wells in columns 2, 3, 8 and 9 with any of the other columns). This is in agreement with our prior observations that bulkier aromatic residues such as these increase the rate water exchange in EuDOTA-tetraamide complexes.23 Interestingly, the smaller aliphatic, hydrophobic isobutyl group (5) did not show a similar trend. When this group appeared in combination with a carboxylethyl group (in either order), the CEST intensities were similar [compare wells (5,7) with (7,5)]. A similar but less obvious trend was observed with 2-methylfuran (6) or 2-methylthiophene (8) acting as the small non-polar residue in combination with a charged group (either positive or negative) as the second component [(6,4)(8,4)(6,7)(8,7)]. This suggests that having a small non-polar group closest to the Eu(III)-water exchange site may act to slow dissociation of the inner-sphere water molecule from the Eu(III) coordination site while the charged group further away acts to organize second-sphere water molecules to slow their entrance into a position where they can be in a position to exchange with the single, inner-sphere water molecule.
It has been reported that the resonance frequency of the bound-water is quite sensitive to the identity of the first amide side-chain group in a series of tetra-substituted amino acids, for example.24 This did not hold true for the 80 complexes prepared in this library because all four side-chains were positioned well away from the central EuDOTA structure by the four ethylenediamine arms. In this case, the frequency of the water exchange peak did not vary substantially (all were near 50-51 ppm) because the ethylendiamine spacer placed the chemically diverse substituents far enough away from the metal to minimize any changes in ligand field. Nevertheless, the most surprising finding of this study was that the water exchange rate and hence the CEST intensity can vary substantially even with these chemically diverse groups are positioned well-away from the central Eu(III). Thus, the differences in CEST signal intensities observed here can only reflect differences in water accessibility to the inner-sphere coordination sphere.
The use of peptoids as the diversity component has some advantages for future potential applications. These include rapid and inexpensive synthesis of peptoid libraries.19,25-28 In addition, peptoids are serum stable,28-29 more cell permeable30 and non-immunogenic31, important considerations for any potential clinical application.
Conclusion
We have presented a combinatorial approach for an easy, rapid and cost effective synthesis and screening of a library of possible PARACEST contrast agents by utilizing peptoid chemistry and the chelating property of the DOTA structure. By changing the amines and the basic structure of the system, many different combinations can be prepared and studied in a single screening assay with the agents attached to the solid support, a much easier way than the conventional solution phase practices. This parallel synthesis principle can directly be applied to many systems diversifying and/or modifying peptide/ peptoid backbones and also can be extended to other types of MRI or MR/PET agents as well. Thousands of different amines are commercially available to bring the ligand diversity. Today, high throughput parallel synthesizers are also commercially available, making these studies even easier to apply. Upon use of these automated synthesizers, the diversity can be applied to all four arms of DOTA-scaffold equally and thereby near symmetrical and even much larger DOTA-libraries can be synthesized in the future. Nonetheless, the best compounds we isolated in this study can also be synthesized with full symmetry in solution phase for practical applications as better CEST agents. Studies are being continuing to validate these compounds further both in vitro and in vivo applications.
Supplementary Material
Acknowledgments
We thank the National Institutes of Health (CA115531, RR02584, and EB004582), the Robert A. Welch Foundation (AT-584) and UT-Southwestern Medical Center for the financial support. Also, we thank Dr. Kathlynn Brown for providing access to the fluorescence spectrophotometer.
Footnotes
SUPPORTING INFORMATION: Detailed experimental procedures, chemical structure of compound 16 (CNBr cleaved form), spectral data (MALDI-MS, HPLC) of compound 16 and the library and complete author list for ref 29 is available free of charge via the Internet at http://pubs.acs.org
References
- 1.Terreno E, Dastru W, Delli Castelli D, Gianolio E, Geninatti Crich S, Longo D, Aime S. Curr Med Chem. 2010;17:3684–3700. doi: 10.2174/092986710793213823. [DOI] [PubMed] [Google Scholar]
- 2.Hancu I, Dixon WT, Woods M, Vinogradov E, Sherry AD, Lenkinski RE. Acta Radiol. 2010;51:910–923. doi: 10.3109/02841851.2010.502126. [DOI] [PMC free article] [PubMed] [Google Scholar]
- 3.Wu Y, Soesbe TC, Kiefer GE, Zhao P, Sherry AD. J Am Chem Soc. 2010;132:14002–14003. doi: 10.1021/ja106018n. [DOI] [PMC free article] [PubMed] [Google Scholar]
- 4.Wu Y, Zhao P, Kiefer GE, Sherry AD. Macromolecules. 2010;43:6616. doi: 10.1021/ma100776d. [DOI] [PMC free article] [PubMed] [Google Scholar]
- 5.Sherry AD, Woods M. Annu Rev Biomed Eng. 2008;10:391–411. doi: 10.1146/annurev.bioeng.9.060906.151929. [DOI] [PMC free article] [PubMed] [Google Scholar]
- 6.Woods M, Woessner DE, Sherry AD. Chem Soc Rev. 2006;35:500–511. doi: 10.1039/b509907m. [DOI] [PMC free article] [PubMed] [Google Scholar]
- 7.Zhang S, Merritt M, Woessner DE, Lenkinski RE, Sherry AD. Acc Chem Res. 2003;36:783–790. doi: 10.1021/ar020228m. [DOI] [PubMed] [Google Scholar]
- 8.Ward KM, Aletras AH, Balaban RS. J Magn Reson. 2000;143:79–87. doi: 10.1006/jmre.1999.1956. [DOI] [PubMed] [Google Scholar]
- 9.Vinogradov E, He H, Lubag A, Balschi JA, Sherry AD, Lenkinski RE. Magn Reson Med. 2007;58:650–655. doi: 10.1002/mrm.21393. [DOI] [PubMed] [Google Scholar]
- 10.Liu G, Ali MM, Yoo B, Griswold MA, Tkach JA, Pagel MD. Magn Reson Med. 2009;61:399–408. doi: 10.1002/mrm.21863. [DOI] [PMC free article] [PubMed] [Google Scholar]
- 11.Zhao JM, Har-el YE, McMahon MT, Zhou J, Sherry AD, Sgouros G, Bulte JW, van Zijl PC. J Am Chem Soc. 2008;130:5178–5184. doi: 10.1021/ja710159q. [DOI] [PMC free article] [PubMed] [Google Scholar]
- 12.Ling W, Regatte RR, Navon G, Jerschow A. Proc Natl Acad Sci U S A. 2008;105:2266–2270. doi: 10.1073/pnas.0707666105. [DOI] [PMC free article] [PubMed] [Google Scholar]
- 13.McMahon MT, Gilad AA, Zhou J, Sun PZ, Bulte JW, van Zijl PC. Magn Reson Med. 2006;55:836–847. doi: 10.1002/mrm.20818. [DOI] [PMC free article] [PubMed] [Google Scholar]
- 14.Zhang S, Sherry AD. Journal of solid state chemistry. 2003;171:38–43. [Google Scholar]
- 15.Liu G, Gilad AA, Bulte JW, van Zijl PC, McMahon MT. Contrast Media Mol Imaging. 2010;5:162–170. doi: 10.1002/cmmi.383. [DOI] [PMC free article] [PubMed] [Google Scholar]
- 16.McMahon MT, Gilad AA, DeLiso MA, Berman SM, Bulte JW, van Zijl PC. Magn Reson Med. 2008;60:803–812. doi: 10.1002/mrm.21683. [DOI] [PMC free article] [PubMed] [Google Scholar]
- 17.Olivos HJ, Alluri PG, Reddy MM, Salony D, Kodadek T. Org Lett. 2002;4:4057–4059. doi: 10.1021/ol0267578. [DOI] [PubMed] [Google Scholar]
- 18.Simpson LS, Burdine L, Dutta AK, Feranchak AP, Kodadek T. J Am Chem Soc. 2009;131:5760–5762. doi: 10.1021/ja900852k. [DOI] [PMC free article] [PubMed] [Google Scholar]
- 19.Zuckermann RN, Kerr JM, Kent SBH, Moos WH. J Am Chem Soc. 1992;114:10646–10647. [Google Scholar]
- 20.De Silva CR, Vagner J, Lynch R, Gillies RJ, Hruby VJ. Anal Biochem. 2010;398:15–23. doi: 10.1016/j.ab.2009.10.031. [DOI] [PMC free article] [PubMed] [Google Scholar]
- 21.Handl HL, Vagner J, Yamamura HI, Hruby VJ, Gillies RJ. Anal Biochem. 2005;343:299–307. doi: 10.1016/j.ab.2005.05.040. [DOI] [PubMed] [Google Scholar]
- 22.Dixon WT, Ren J, Lubag AJ, Ratnakar J, Vinogradov E, Hancu I, Lenkinski RE, Sherry AD. Magn Reson Med. 2010;63:625–632. doi: 10.1002/mrm.22242. [DOI] [PMC free article] [PubMed] [Google Scholar]
- 23.Mani T, Tircso G, Togao O, Zhao P, Soesbe TC, Takahashi M, Sherry AD. Contrast Media Mol Imaging. 2009;4:183–191. doi: 10.1002/cmmi.279. [DOI] [PMC free article] [PubMed] [Google Scholar]
- 24.Viswanathan S, Ratnakar SJ, Green KN, Kovacs Z, De Leon-Rodriguez LM, Sherry AD. Angew Chem Int Ed Engl. 2009;48:9330–9333. doi: 10.1002/anie.200904649. [DOI] [PMC free article] [PubMed] [Google Scholar]
- 25.Alluri PG, Reddy MM, Bachhawat-Sikder K, Olivos HJ, Kodadek T. J Am Chem Soc. 2003;125:13995–14004. doi: 10.1021/ja036417x. [DOI] [PubMed] [Google Scholar]
- 26.Udugamasooriya DG, Dineen SP, Brekken RA, Kodadek T. J Am Chem Soc. 2008;130:5744–5752. doi: 10.1021/ja711193x. [DOI] [PubMed] [Google Scholar]
- 27.Udugamasooriya DG, Dunham G, Ritchie C, Brekken RA, Kodadek T. Bioorg Med Chem Lett. 2008;18:5892–5894. doi: 10.1016/j.bmcl.2008.07.023. [DOI] [PMC free article] [PubMed] [Google Scholar]
- 28.Zuckermann RN, Kodadek T. Curr Opin Mol Ther. 2009;11:299–307. [PubMed] [Google Scholar]
- 29.Simon RJ, et al. Proc Natl Acad Sci U S A. 1992;89:9367–9371. doi: 10.1073/pnas.89.20.9367. [DOI] [PMC free article] [PubMed] [Google Scholar]
- 30.Kwon YU, Kodadek T. J Am Chem Soc. 2007;129:1508–1509. doi: 10.1021/ja0668623. [DOI] [PMC free article] [PubMed] [Google Scholar]
- 31.Astle JM, Udugamasooriya DG, Smallshaw JE, Kodadek T. Int J Pept Res Ther. 2008;14:223–227. [Google Scholar]
Associated Data
This section collects any data citations, data availability statements, or supplementary materials included in this article.