Abstract
Lanthanide(iii) chelates of DOTA-tetraamide ligands have been an area of particular interest since the discovery that water exchange kinetics are dramatically affected by the switch from acetate to amide side-chain donors. More recently these chelates have attracted interest as potential PARACEST agents for use in MRI. In this paper we report the results of studies using chemical exchange saturation transfer (CEST) and some more recently reported chelates to re-examine the exchange processes in this class of chelate. We find that the conclusions of Parker and Aime are, for the most part, solid; water exchange is slow and a substantial amount of prototropic exchange occurs in aqueous solution. The extent of prototropic exchange increases as the pH increases above 8, leading to higher relaxivities at high pH. However, amide protons are found to contribute only a small amount to the relaxivity at high pH.
Introduction
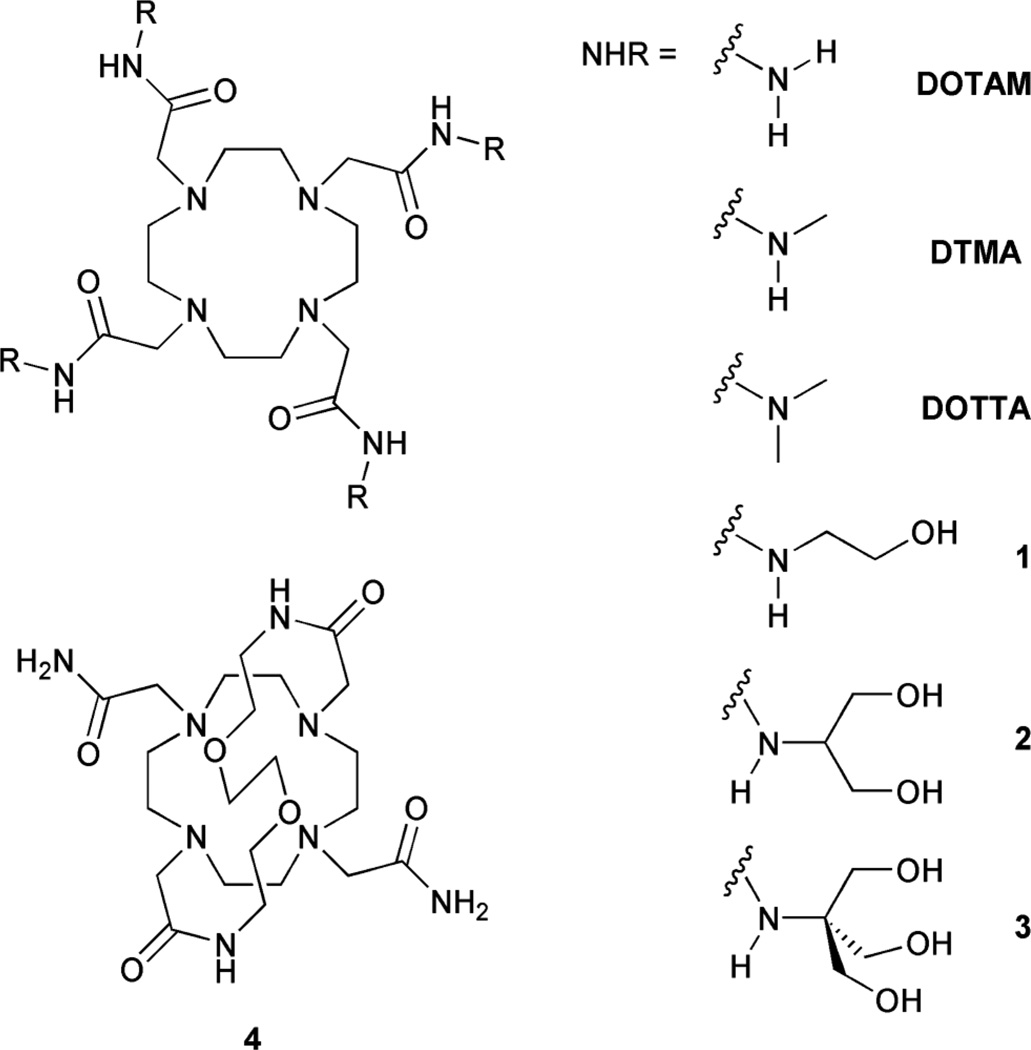
A little more than a decade ago the research groups of Parker and Aime published a series of influential papers that reported some fundamental properties of the lanthanide chelates of three simple DOTA-tetraamide ligands, DOTAM, DTTA and DOTTA (Chart 1).1–3 This work impacted the design of MRI contrast agents,4 including the design of responsive imaging agents,5,6 and, perhaps most importantly, they opened the door for the development of paramagnetic chemical exchange saturation (PARACEST) agents.7,8 The questions addressed in these papers centered around the processes by which the coordinated water molecule and its protons exchange with bulk solvent water molecules and protons. The rates of these exchange processes are important parameters in determining the relaxivity (r1) and hence the efficacy of a T1-based contrast agent (relaxivity is defined as the increase in solvent proton relaxation rate per unit concentration of the agent). The rate of water exchange in these tetraamide chelates was found to be so slow that it limited relaxivity at most pH conditions except for the extremes of pH, above 8 and below 2. Above and below these extremes of pH, the relaxivity of these chelates was found to rise indicating faster exchange. The authors concluded that this was the result of two combined effects, an increase in the rate of proton exchange from the bound water molecule plus a contribution from amide proton exchange to the relaxivity.
Chart 1.
The analysis of these systems was complicated, not only by the presence of three possible exchange processes, but also by the presence of two coordination isomers in solution. In common with their parent LnDOTA chelates,9 LnDOTA-tetraamide chelates can adopt a square antiprismatic (SAP) or a twisted square antiprismatic (TSAP) geometry and these coordination isomers interconvert in solution. Since one of the major findings was that water exchange in the TSAP isomer was about 50-fold faster than in the SAP isomer,1–3 it is important to be able to resolve the effects of these two isomers if these exchange processes are to be clearly understood. Faced with these obstacles these Aime, Parker and their co-workers were remarkably successful in drawing solid conclusions about exchange in these chelates. However, the last decade has seen some advances and discoveries that may help shed even more light upon the behaviour of these chelates.7,10–12 In this paper we have taken advantage of these advances and re-examine some of the conclusions reached in this series of papers.
Results and Discussion
Exchange at the coordinated water molecule
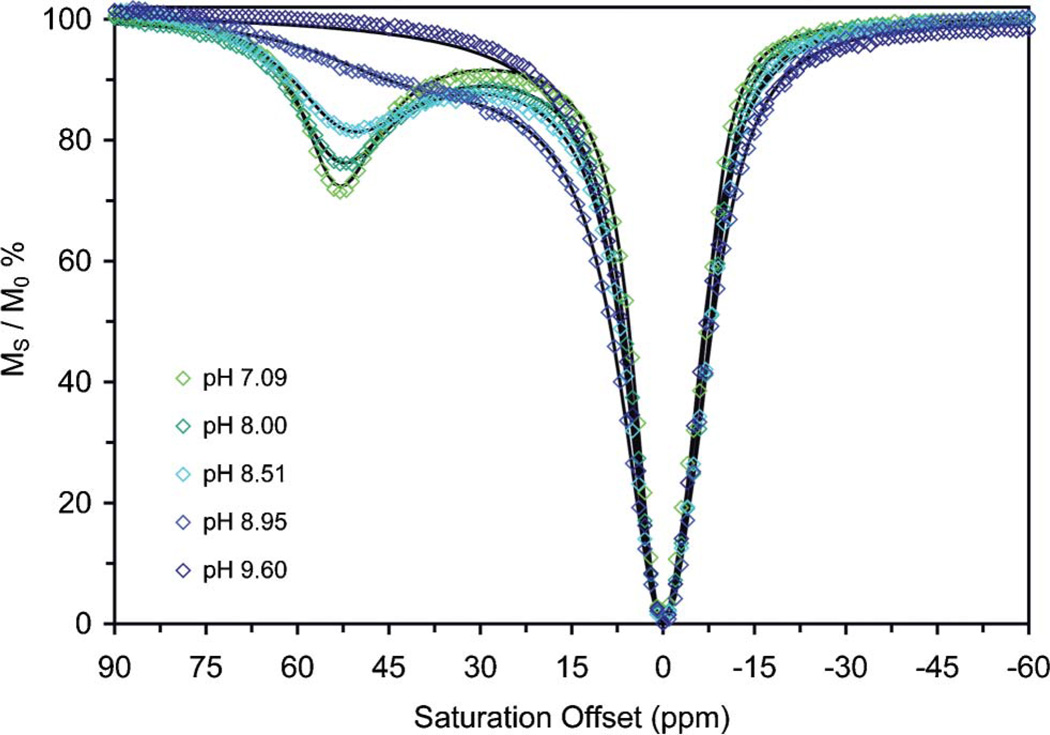
Our interest in DOTA-tetraamide chelates stems from their potential application as contrast agents for chemical exchange saturation transfer (CEST) imaging. The idea of using exogenous CEST agents to generate image contrast in MR images is a relatively recent one13 although chemical exchange principles have long been used in NMR. Contrast is produced by applying a presaturation pulse to protons that exchange with water but are in a chemically distinct environment. Exchange of these protons with those of the solvent water result in a net transfer of saturated spins to the bulk solvent and a decrease in the water signal intensity and negative image contrast.11 Given the slower water exchange rates and large chemical shifts for the coordinated water molecule in LnDOTA-tetraamide chelates such as DOTAM, these chelates are now favoured for use as PARACEST agents. The effectiveness of a CEST agent is assessed by measuring a CEST-spectrum, in which the signal intensity of the solvent water, as a percentage of its initial intensity, is plotted as a function of the frequency of the pre-saturation pulse. Sample CEST spectra of EuDOTAM were recorded over the pH range 4 to 10 (Fig. 1). At the lower end of this pH range, the spectra are characteristic of most other EuDOTA-tetraamide chelates with one large peak at 0 ppm arising from direct saturation of the solvent water and another at about 50 ppm corresponding to CEST from the bound water of the SAP isomer.7 Although the TSAP isomer also exists in this sample (~20% as estimated by 1H NMR),3,12 no peak corresponding to CEST from the coordinated water molecule of the TSAP isomer is observed at the expected chemical shift of ~10 ppm. This result was expected since the reported water exchange rate in this isomer (kex = 3.8 × 10⁵ s−1)3 greatly exceeds the slow exchange condition (Δω ≥ kex, where Δω is the shift difference in Hz) for this NMR frequency.
Fig. 1.
CEST spectra collected on 10 mM solutions of EuDOTAM at various pH values between 7 and 10. The spectra recorded between pH 4 and 7 are almost identical to that recorded at pH 7.09 and are not shown for clarity. Spectra were recorded at 298 K, B0 = 500 MHz, B1 = 1000 Hz, pre-saturation time = 2s. The points on each curve show the original CEST data while the solid lines through the data reflect the fitted results.
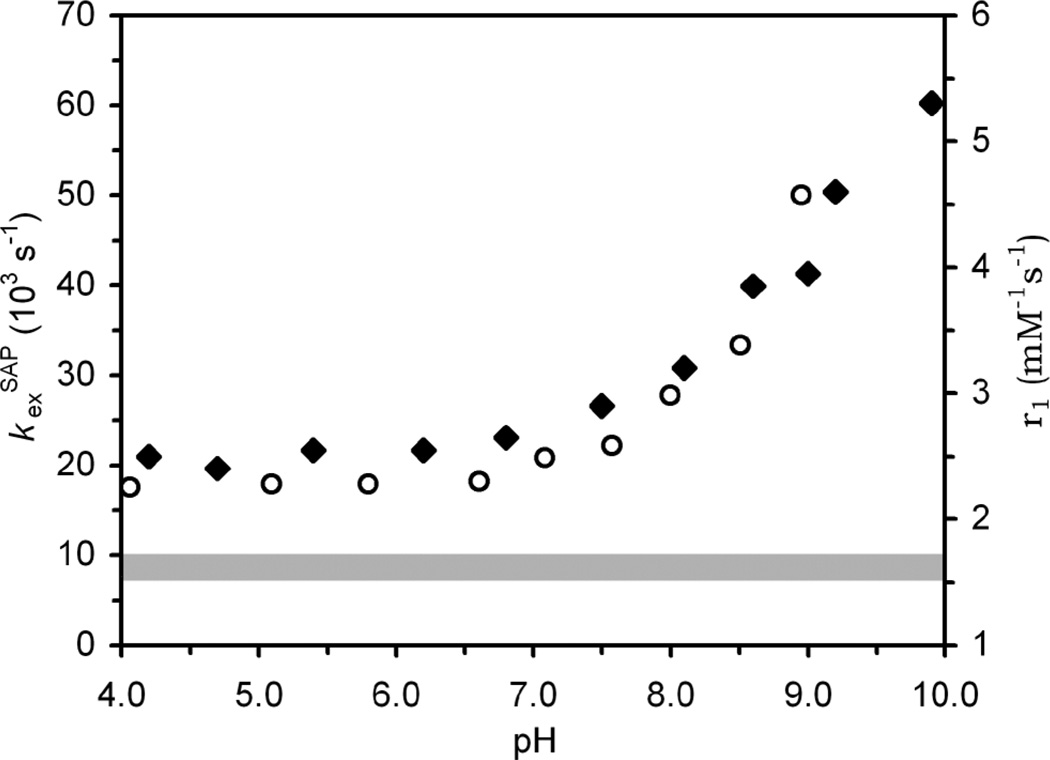
Increasing the pH of a solution of EuDOTAM from 4 to 7 has no significant effect upon the CEST spectrum. But, as the pH is raised above 7, the CEST peak from the coordinated water molecule begins to broaden and lose intensity until the pH reaches ~10 when the exchange peak is completely lost. Such behaviour is consistent with an acceleration of the rate of exchange above the slow exchange limit. A complete solution to the Bloch equations modified for exchange10 enables these CEST spectra to be fitted to accurately14 affording the water proton exchange rate, kexobs, at each pH. The rate constants for the coordinated water protons of the SAP isomer determined by fitting the CEST spectra of EuDOTAM are plotted on the same pH axis as the relaxivity pH profile of GdDOTAM (Fig. 2). It should be noted that the relaxivity is a weighted average of contributions from the SAP and TSAP isomers while CEST reflects only the SAP isomer. Nonetheless, the phenomena: proton exchange, CEST and relaxivity, follow the same general trend-remaining relatively insensitive to pH below ~7, then gradually increasing with pH. It is apparent that the increase in relaxivity at higher pH is the result of accelerated exchange of Gd3+-bound water protons with those of bulk solvent.1–3
Fig. 2.
The observed exchange rate constant, kexobs, determined for the SAP isomer of EuDOTAMfromCEST experiments (open circles) and the relaxivity (20MHz, 25 °C) of GdDOTAM (closed diamonds) plotted as a function of pH. The grey area represents the probable range of whole water exchange rate constants for the SAP isomer in these chelates as determined from values in Table 1.
A comparison of the rate constants determined by CEST with those previously reported1–3,15 is complicated by two factors. At first glance kexobs appears to be a factor of 2 larger than any of the previously reported rate constants for the SAP isomer of a DOTAM chelate (Table 1). However, earlier studies required the use of slightly wet acetonitrile as solvent in order for the signals from the two coordination isomers to be resolved spectroscopically.1–3,15 Not surprisingly, it has already been shown that increasing the mole fraction of water in the solvent leads to an increase in kex.16 NMR is the technique of choice for determining kex in Ln3+ chelates but the choice of observed nucleus can also influence the information obtained. Direct observation of 17O affords information about whole water molecule exchange while measurements taken by 1H NMR reflect the sum of whole water and prototropic exchange. The values of τM (the water residence lifetime, = 1/kex) determined in acetonitrile solution are not significantly different, regardless of the nucleus chosen for observation, 1H or 17O.1–3,15 This suggests that the contribution of prototropic exchange is small in acetonitrile and exchange occurs principally by whole water exchange. No direct, independent measure of the rate of whole water exchange in the SAP isomer of DOTAM has been made by 17O NMR in aqueous solution so the actual molecular exchange rate is unknown. However, an overall rate constant has been determined by 17O for GdDOTAM with the value obtained reflecting a weighted average of the contributions of two coordination geometries (kex17O = 52.6 × 10³ s−1).3 Given the assumption that the relative rate of water exchange in the SAP and TSAP isomers is constant regardless of solvent (a factor of 40–46 × faster in the TSAP isomer)3,15 then an estimate of the rate constants for both the SAP and TSAP isomers can be derived from the known populations of each isomer in solution (89% SAP, 11% TSAP for GdDOTAM) (eqn 1 & 2).12
| (1) |
| (2) |
where A is the ratio of the SAP and TSAP exchange rate constants in acetonitrile, either 4015 or 46.3 The range of kexSAP values estimated in this way lies very close to, although slightly on the faster side, of the values determined in acetonitrile, suggesting that whole water exchange is accelerated only slightly on going from acetonitrile to aqueous solution, consistent with a dissociative exchange mechanism. Therefore, the difference between kexSAP for whole water exchange and kexobs would appear to represent the extent of prototropic exchange in the SAP isomer. This would indicate that in aqueous solution, the rate of prototropic exchange is more significant than in acetonitrile, equivalent to the rate of whole water exchange between pH 4–7. A similar phenomenon has been observed for other DOTA-tetraamide chelates on going from acetonitrile to aqueous solution in which exchange rates were determined by line fitting techniques.8 As the solution pH rises above 7, prototropic exchange rapidly becomes the dominant exchange mechanism as evidenced by the observation that whole water exchange was found to occur at the same rate irrespective of pH (pH 2–12).3 Thus, as concluded by Parker and Aime, it is the contribution from prototropic exchange that gives rise to the increase in relaxivity at higher pH.1–3
Table 1.
The water residence lifetimes of the SAP and TSAP isomers of LnDOTAM chelates
Prototropic exchange is not thought to be a major exchange mechanism in Ln3+ chelates with polyanionic ligands such as DOTA. The occurrence of prototropic exchange, along with the deceleration of whole water exchange, has been attributed to the change in pendant armligating group from anionic to neutral. This change renders the metal ion more electron poor and increases its demand for electron density from the coordinated water molecule. The result is that the protons of the coordinated water molecule are more acidic and thus more readily undergo exchange. Parker and Aime reported a pKa of 7.90 for the Gd3+-bound water molecule in the GdDTMA (I = 0.1 M, NMe4NO3).2,3 At the same time they reported that the number of coordinated water molecules remained constant (q = 1) over the pH range 2–92,3 (qEu = 0.92 after correction for other proximate oscillators)17 as determined by Horrocks’ method.17–19 Similarly, Morrow and co-workers observed no change in either q or the non degenerate 5D0 → 7F0 emission band for EuDOTAM with changing pH.20 As Horrocks’ method directly measures the number of OH oscillators in close proximity to a Eu3+ or Tb3+ ion, deprotonation of the coordinated water molecule will be registered in the q value determination as loss of one OH oscillator, or half a water molecule.17 Assuming that the Henderson–Hasselbalch relationship holds true for these chelates, a pKa of 7.90 would afford q = 0.75 at pH 7.90 and q = 0.54 at pH 9. We measured the q values of the Eu3+ and Tb3+ chelates of DOTAM at pH(D) 9.9 using Horrocks’ method and obtained values of qEu = 0.85 and qTb = 0.82 after correcting for other proximate oscillators (kH2O = 1.80 ms−1, kD2O = 0.54 ms−1 (Eu3+) and kH2O = 0.61 ms−1, kD2O = 0.39 ms−1 (Tb3+).17 This is consistent with potentiometric titrations that suggest that the pKa of the coordinated water molecule lies between 10.5 and 11.0 for EuDOTAM.21 Any pKa in the region of 7–8 must be the result of deprotonation at another site. One possible site would be the amide protons that would also be rendered more acidic by coordination to the Ln3+ ion. This is consistent with the observation that relaxivity increases as pH increases rather than decreases as would be expected if deprotonation of the coordinated water molecule had occurred.
Most other GdDOTA-tetraamide chelates exhibit generally similar relaxivity pH profiles to that observed for GdDOTAM, although the absolute pH at which the relaxivity begins to increase can vary somewhat.5,6 One notable exception to this pattern is GdDOTTA, a tetraamide chelate that is also atypical in that it exists largely as the TSAP coordination isomer,1–3 although other tertiary amide chelates are observed to behave similarly.22 The relaxivity of GdDOTTA between pH 2 and 7 indicates that it is not limited by slow water exchange, also expected for a TSAP coordination isomer. However, since we are unable to detect CEST arising from the more rapidly exchanging TSAP isomer, we were not able to assess the relative contributions of the whole water and prototropic exchange in this chelate.
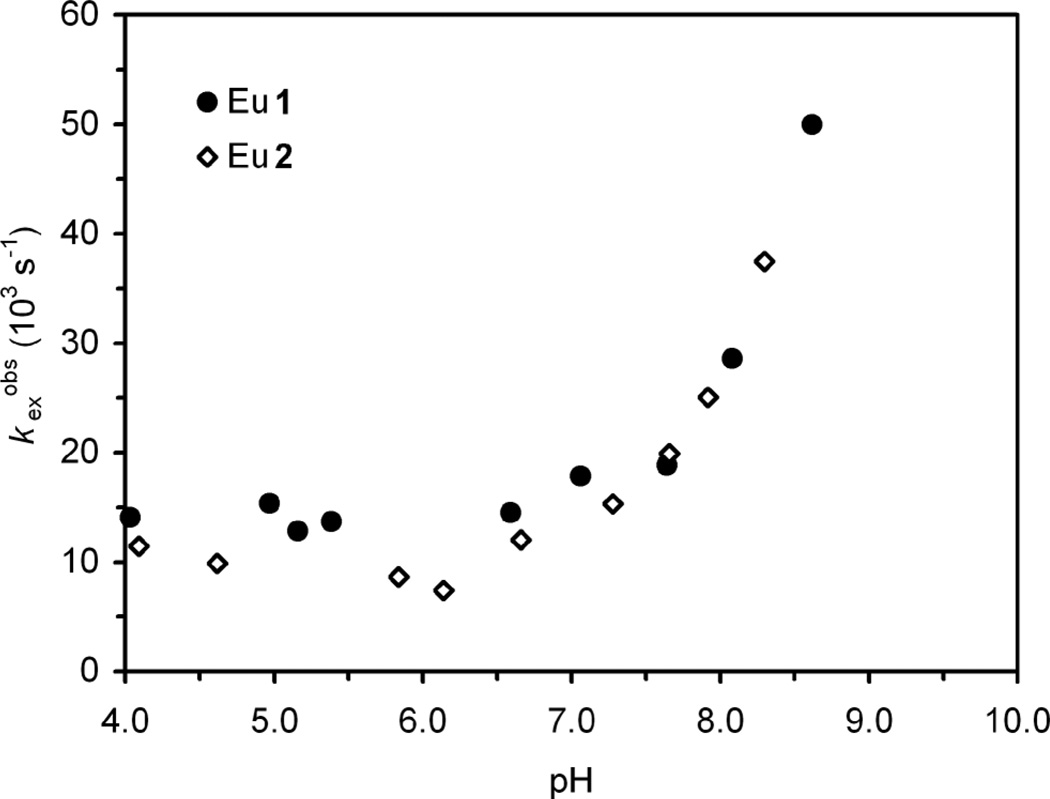
To illustrate the generality of increasing prototropic exchange with increasing pH, the exchange rate constants of the Eu3+ chelates of two DOTA-tetraamide ligands 1 and 2 determined by CEST have been plotted as a function of solution pH (Fig. 3). These chelates were engineered in our lab along with a third, 3, as part of a program to investigate improving the in vivo tolerance of such chelates.23,24 It should be noted that all three chelates were found to adopt the SAP isomer exclusively and all three exhibited CEST properties typical of that coordination geometry (supplementary information). The CEST properties of Eu1 and Eu2 were almost identical and fitting of the CEST data afforded similar overall exchange rates, kexobs, which accelerate with increasing pH in a comparable manner to EuDOTAM (Fig. 3). Eu3 exhibited a much smaller CEST effect than either Eu1 or Eu2, but a suitable fitting using the standard three-pool model used for the other chelates could not be achieved. Simulations of CEST have suggested that introducing a fourth exchanging pool, in this case the twelve hydroxyl protons, could have a significant effect on the magnitude of the CEST effect from the coordinated water molecule.10 If the exchange rate of this fourth pool were fast enough theory suggests that it could negatively impact the CEST effect observed for the water molecule. However, attempts to model this effect and fit the CEST data acquired for Eu3 were unsuccessful and the origin of the unexpectedly weak CEST effect observed for this chelate remains obscure. Nonetheless, from the decrease in CEST observed with increasing pH we may surmise that exchange is relatively rapid on the NMR time-scale and that prototropic exchange also accelerates with increasing pH in this chelate.
Fig. 3.
The observed exchange rate constants, kexobs, determined by fitting the CEST spectra of Eu1 (closed circles) and Eu2 (open diamonds) as a function of solution pH.
Exchange at the amide NH protons
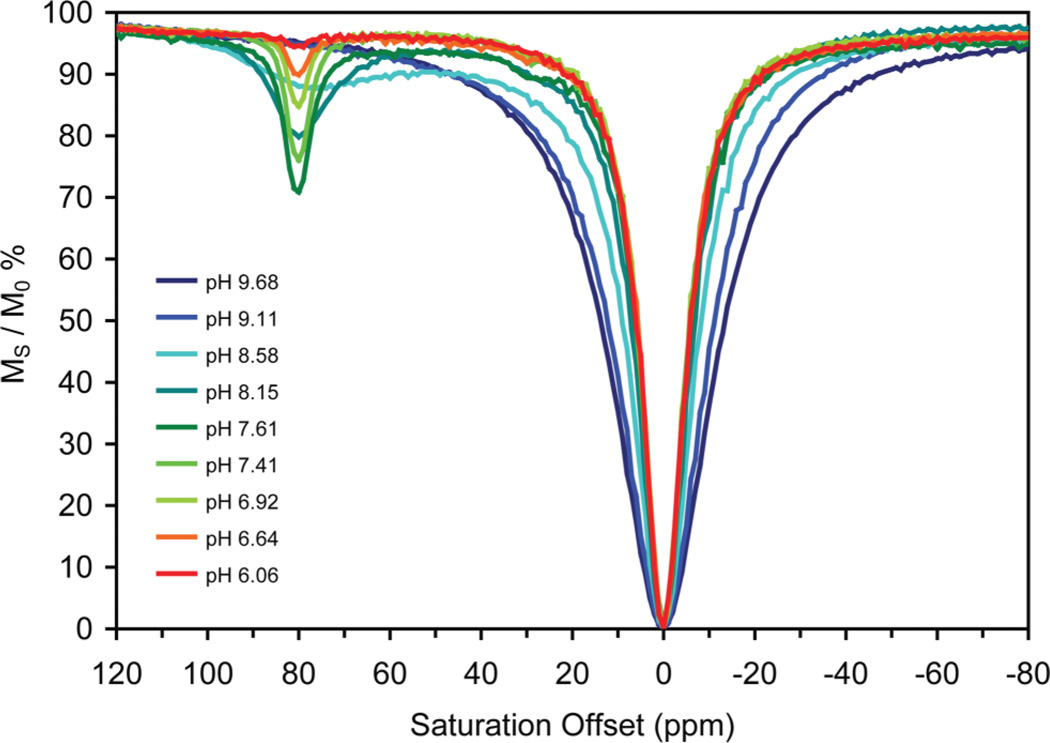
In addition to CEST from the coordinated water molecule, CEST can also be observed from the amide protons of these DOTA-tetraamide chelates.25,26 In the case of Eu3+ these protons are weakly shifted and are often poorly resolved (especially when using higher pre-saturation powers) from the bulk solvent peak itself. However, by using a lanthanide ion such as Dy3+ with greater hyperfine shift characteristics, the separation between amide and bulk water resonances can be increased. In DyDOTAM for example, CEST exchange peaks are well-resolved both for the amide protons of the SAP isomer at +80 ppm and the coordinated water at −720 ppm.11 The advantages of using the amide protons to generate CEST are two fold; 1) there are 8 amide protons in DyDOTAM compared to only two protons on a single coordinated water molecule so a 4-fold increase in CEST sensitivity can be expected and 2) the rate of amide proton exchange is acutely sensitive to pH.25 This pH sensitivity is illustrated in the CEST spectra of DyDOTAM, the down-field region of spectra acquired over the pH range 4–10 are shown in Fig. 4. Although the two protons on each amide in DyDOTAM are diastereotopic and therefore have slightly different chemical shifts, a single CEST peak is observed for the amide protons of the SAP isomer. A small peak near +30 ppm observed in some spectra corresponds to the amide protons of the TSAP isomer present in only about ~5% for DyDOTAM.12 Focussing on CEST arising from the SAP isomer, the behaviour with increasing pH is characteristic of increasing amide proton exchange. At low pH, the rate of exchange is extremely slow and no CEST is observed but as the pH is increased exchange becomes more rapid and a sharp CEST peak begins to grow until CEST reaches a maximum near pH 7.6. As exchange accelerates further at higher pH values, the CEST peak broadens and becomes less intense in a similar manner to the coordinated water in EuDOTAM. It is notable that the pH range over which the amide protons accelerate their exchange rate is much narrower, and slightly lower, than that observed for the coordinated water molecule in EuDOTAM.
Fig. 4.
CEST spectra of DyDOTAM (10 mM in water) at different pH values recorded at 500 MHz, 298 K, B1 = 1000 Hz, pre-saturation time = 2 s.
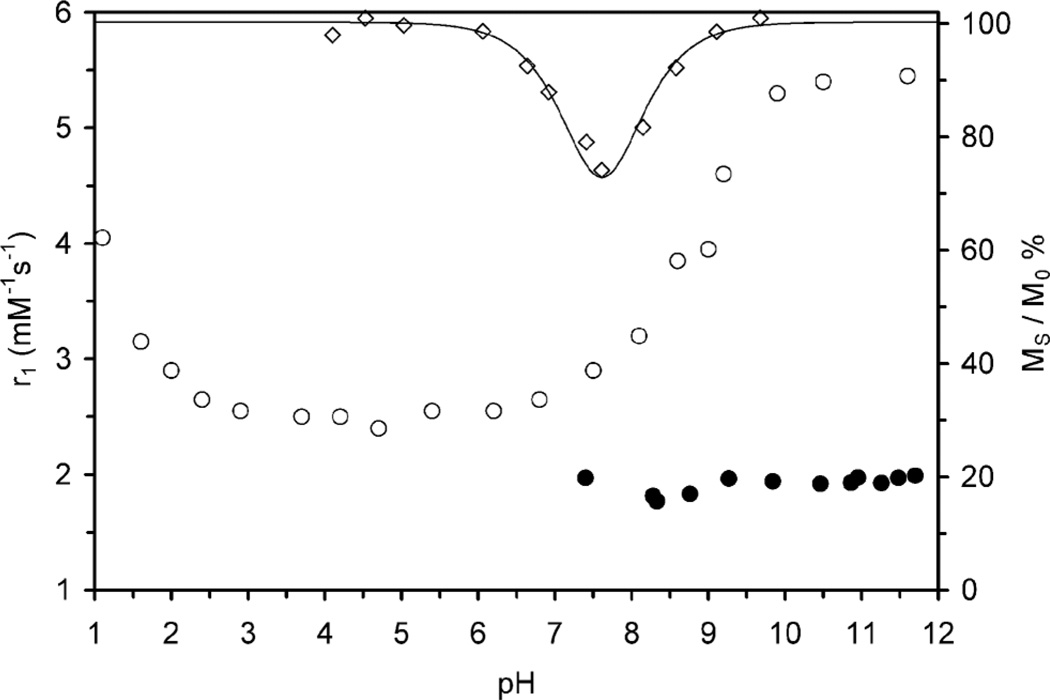
The rate of amide proton exchange could be important in understanding the relaxivity pH profile of DOTAM. Parker and Aime found that the relaxivities of GdDOTAM and GdDTMA at pH 11 could not be accounted for in terms of exchange from a single coordinated water molecule3 and suggested that a contribution from amide proton exchange was responsible for this additional relaxivity at high pH. Fig. 5 shows the magnitude of the CEST effect arising from the amide protons of the SAP isomer of DyDOTAM plotted on the same axis as the relaxivity pH profile of GdDOTAM. These data confirm that the acceleration in amide proton exchange occurs over a pH range appropriate to influence this change in relaxivity. Due to the problem of acquiring complete CEST spectra over a 900 ppm saturation offset range to cover the highly shifted DyDOTAM water peak, the individual CEST spectra were not fitted to the modified Bloch equations. Rather, the magnitude of the CEST effect for a system with comparable parameters was calculated using the Bloch equations modified for exchange10 over a range of exchange rates constants. When these predictions are overlaid onto the CEST data, it reveals that the rate constant kexNH appears to increase by about 4-orders of magnitude on going from pH 6 to 9, from ~ 102−~106 s−1. This is a much larger increase in rate acceleration by pH than that observed for prototropic exchange at the coordinated water molecule.
Fig. 5.
The relaxivity (20MHz, 25 °C) of GdDOTAM (open circles) and Gd4 (closed circles) plotted as a function of pH. The CEST contribution (MS/M0) from amide exchange (exchange peak at 80 ppm) in DyDOTAM is also shown (open diamonds); the line overlaid on these data is a simulation of the magnitude of CEST with increasing exchange rate from the Bloch equations modified for exchange.
The Ln3+ chelates of ligand 4 are unique in that they were found to have no water molecule coordinated directly to the Ln3+ ion.12 This afforded an opportunity to examine the extent to which amide protons contribute to relaxivity directly. The relaxivity pH profile of Gd4 is shown on the same axes as that of GdDOTAM(Fig. 5). The relaxivity of Gd4 at pH 7 is low, just 1.8 mM−1s−1, consistent with the relaxivity arising solely from an outer sphere mechanism. However, as the pH rises there is only a very small increase in relaxivity, ~0.2 mM−1s−1, which suggests that the contribution of amide protons to the relaxivity is extremely small. The reason for this is apparent when one examines crystallographic data for the two chelates. The Gd–H distance for the amide protons in the crystal structure of GdDOTAM (a SAP isomer) were found to be 4.782 Å and 5.118 Å.27,28 These values are comparable to those found for the Yb–H distance in the crystal structure of Yb4 (a TSAP isomer) 4.775 Å, 4.873 Å and 5.029 Å.12 These distances are all considerably longer than Ln–H distance for a coordinated water molecule, typically 2.9–3.1Å.4 Since the dipolar interactions responsible for the relaxation of protons are strongly distance dependent (r−6),29–33 the amide protons will experience a much smaller influence from paramagnetic Gd3+ than will the protons on the coordinated water molecule. This is entirely consistent with the observation that amide proton exchange in these chelates contributes very little to bulk water relaxivity. Below pH 7 the relaxivity of Gd4 was found to rise with decreasing pH (data not shown) and this was attributed to the dissociation of Gd3+ from the chelate. Dissociation of Gd4 was confirmed by placing a sample of the chelate in sodium acetate buffer (pH 4.76) with xylenol orange. Initially the test result was negative for free lanthanide but after incubation for 24 h at 298 K, a positive result was obtained. Potentiometric titration data also allowed a speciation diagram to be generated for Eu4 that clearly shows the chelate dissociating below pH 7 (supplementary information). Final confirmation of the dissociation of Ln4 chelates was provided by q value determinations of Tb4 performed using the modified Horrocks’ method.17 The q value of Tb4 at pH 4.5 (0.54) was found to be much higher than that determined at pH 8.4 (0.27), consistent with the presence of larger quantities of free terbium.
The distance of closest approach of water protons in the second hydration sphere of a chelate can be much shorter than the Ln–H distance of amide protons, <4 Å in the solid phase.34 However, the interaction between the triflate counter-ions and these DOTA-tetraamide chelates can limit the approach of the second hydration sphere. Crystal structures of GdDOTAM reveal the proximity of these counter-ions and the nature of their interactions,27,28 and other studies have shown the importance of the counter-ion on the properties of DOTA-tetraamide chelates.28 As in the studies of Aime and Parker,1–3 and Merbach,15 triflate counter-ions were used throughout this study in order to ensure that comparisons were justified. Triflates can form hydrogen bonding interactions with the protons of the coordinated water molecule and exclude water from the second sphere.27,28 Parker and Aime used 19F NMR to study the relaxation rates of triflate counter-ions and discovered that as the pH increases so does the T1 of the 19F of the triflates.1–3 This strongly suggests that an increase in the rate of prototropic exchange disrupts the interactions between the coordinated water protons and triflate counter-ions. Thus, at higher pH values, the triflate counter-ions tend to lie further from the chelate than they do at low pH, allowing the second hydration sphere closer access to the chelate. This would in turn improve the relaxivity arising from a second sphere mechanism,35 also contributing to an increase in observed relaxivity with increasing pH. We suggest that it is an increase in the second sphere relaxivity rather than a contribution from the amide protons that accounts for the additional increase in observed relaxivity at high pH in these LnDOTA-tetraamide chelates.
Conclusions
The earlier papers published by Parker and Aime were fundamentally important in their contribution to our understanding of the chemistry of these lanthanide chelates.1–3 The fundamental conclusions of those papers concerning slow water exchange kinetics and substantial prototropic exchange contributions have been supported by subsequent work into the behaviour of other LnDOTA-tetraamide chelates.7,8 However, in the decade since these papers were published we have been able to refine our understanding of these systems.
As a result of the central lanthanide ion being somewhat electron-poor, the rate of water molecule exchange is slower in the LnDOTA-tetraamide chelates than in the corresponding LnDOTA chelates. In acetonitrile, exchange is dominated by molecular exchange but in aqueous solution, molecular and prototropic exchange contribute nearly equally to the observed exchange rate over the pH range 2–8. As the pH is raised above 8 the rate of prototropic exchange increases taking the chelate out of the slow exchange condition. This acceleration of prototropic exchange, combined with an increased second sphere contribution as interactions with counter-ions are disrupted, leads to an increase in relaxivity at higher pH. Although the amide protons exchange rapidly at high pH they lie too far from the Gd3+ ion to contribute significantly to relaxivity. This behaviour appears to be common to all LnDOTA-tetraamide chelates that exist in solution largely as the SAP coordination isomer.5,6 Chelates that adopt a TSAP coordination geometry are more difficult to study so these same details remain less well understood.
Experimental Section
DOTAM;3,23 ligands 1, 2 and 3;23 and ligand 412 were all prepared by previously described methods. Lanthanide chelates were prepared from the appropriate lanthanide triflate salts by previously described methods.3 CEST spectra were recorded on a Varian Inova 500 operating at 499.99 MHz. Samples were of 10 mM concentration in 100% water. Irradiation times of 2 s were used with a pre-saturation power of 1000 Hz. CEST spectra were fitted using a home-written algorithm in the commercially available MATLAB programme. Relaxivity measurements were made using the inversion recovery method on a MRS-6 NMR analyzer from the Institut “Jožef Stefan”, Ljubljana, Slovenjia operating at 20 MHz.
Supplementary Material
Acknowledgements
This research was supported by grants from the National Institutes of Health (EB-11687 (MW); RR-02584 and CA-115531 (ADS)); ONAMI (N00014-11-1-0193); the Hungarian Scientific Research Found (OTKA K84291) (GT); the TÁMOP 4.2.1./B-09/1/KONV-2010-0007 project (GT) implemented through the New Hungary Development Plan, co-financed by the European Social Fund and the European Regional Development Fund; the M.J. Murdock Charitable Trust and the Robert A Welch Foundation (AT-584).
Notes and References
- 1.Aime S, Barge A, Botta M, De Sousa AS, Parker D. Angew. Chem. Int. Ed. 1998;37:2673. doi: 10.1002/(SICI)1521-3773(19981016)37:19<2673::AID-ANIE2673>3.0.CO;2-#. [DOI] [PubMed] [Google Scholar]
- 2.Aime S, Barge A, Botta M, Parker D, De Sousa AS. J. Am. Chem. Soc. 1997;119:4767. [Google Scholar]
- 3.Aime S, Barge A, Bruce JI, Botta M, Howard JAK, Moloney JM, Parker D, de Sousa AS, Woods M. J. Am. Chem. Soc. 1999;121:5762. [Google Scholar]
- 4.Caravan P, Ellison JJ, McMurry TJ, Lauffer RB. Chem. Rev. 1999;99:2293. doi: 10.1021/cr980440x. [DOI] [PubMed] [Google Scholar]
- 5.Woods M, Zhang S, Ebron VH, Sherry AD. Chem. Eur. J. 2003;9:4634. doi: 10.1002/chem.200305159. [DOI] [PubMed] [Google Scholar]
- 6.Kalman FK, Woods M, Caravan P, Jurek P, Spiller M, Tircso G, Kiraly R, Brucher E, Sherry AD. Inorg. Chem. 2007;46:5260. doi: 10.1021/ic0702926. [DOI] [PMC free article] [PubMed] [Google Scholar]
- 7.Zhang S, Winter P, Wu K, Sherry AD. J. Am. Chem. Soc. 2001;123:1517. doi: 10.1021/ja005820q. [DOI] [PubMed] [Google Scholar]
- 8.Zhang S, Wu K, Biewer MC, Sherry AD. Inorg. Chem. 2001;40:4284. doi: 10.1021/ic0003877. [DOI] [PubMed] [Google Scholar]
- 9.Hoeft S, Roth K. Chem. Ber. 1993;126:869. [Google Scholar]
- 10.Woessner DE, Zhang S, Merritt ME, Sherry AD. Magn. Reson. Med. 2005;53:790. doi: 10.1002/mrm.20408. [DOI] [PubMed] [Google Scholar]
- 11.Woods M, Woessner DE, Sherry AD. Chem. Soc. Rev. 2006;35:500. doi: 10.1039/b509907m. [DOI] [PMC free article] [PubMed] [Google Scholar]
- 12.Vipond J, Woods M, Zhao P, Tircso G, Ren JM, Bott SG, Ogrin D, Kiefer GE, Kovacs Z, Sherry AD. Inorg. Chem. 2007;46:2584. doi: 10.1021/ic062184+. [DOI] [PMC free article] [PubMed] [Google Scholar]
- 13.Ward M, Aletras AH, Balaban RS. J. Magn. Reson. 2000;143:79. doi: 10.1006/jmre.1999.1956. [DOI] [PubMed] [Google Scholar]
- 14.Dixon WT, Ren J, Lubag AJM, Ratnakar J, Vinogradov E, Hancu I, Lenkinski RE, Sherry AD. Magn. Reson. Med. 2010;63:625. doi: 10.1002/mrm.22242. [DOI] [PMC free article] [PubMed] [Google Scholar]
- 15.Dunand A, Aime S, Merbach AE. J. Am. Chem. Soc. 2000;122:1506. [Google Scholar]
- 16.Woods M, Woessner DE, Zhao P, Pasha A, Yang M-Y, Huang C-H, Vasalitiy O, Morrow JR, Sherry AD. J. Am. Chem. Soc. 2006;128:10155. doi: 10.1021/ja061498t. [DOI] [PMC free article] [PubMed] [Google Scholar]
- 17.Beeby A, Clarkson IM, Dickins RS, Faulkner S, Parker D, Royle L, de Sousa AS, Williams JAG, Woods M. J. Chem. Soc. Perkin Trans. 2. 1999:493. [Google Scholar]
- 18.Horrocks WD, Jr, Sudnick DR. Acc. Chem. Res. 1981;14:384. [Google Scholar]
- 19.Horrocks WD, Jr, Sudnick DR. J. Am. Chem. Soc. 1979;101:334. [Google Scholar]
- 20.Amin S, Voss DA, Jr, Horrocks WD, Lake CH, Churchill MR, Morrow JR. Inorg. Chem. 1995;34:3294. [Google Scholar]
- 21.Pasha A, Tircso G, Tircsóné Benyó E, Brucher E, Sherry AD. Eur. J. Inorg. Chem. 2007:4340. doi: 10.1002/ejic.200700354. [DOI] [PMC free article] [PubMed] [Google Scholar]
- 22.Miller KJ, Saherwala AA, Webber BC, Wu Y, Sherry AD, Woods M. Inorg. Chem. 2010;49:8662. doi: 10.1021/ic101489t. [DOI] [PMC free article] [PubMed] [Google Scholar]
- 23.Pasha A, Lin M, Tircso G, Rostollan CL, Woods M, Kiefer GE, Sherry AD, Sun X. J. Biol. Inorg. Chem. 2009:421. doi: 10.1007/s00775-008-0459-3. [DOI] [PMC free article] [PubMed] [Google Scholar]
- 24.Sherry AD, Caravan P, Lenkinski RE. J. Magn. Reson. Imag. 2009;30:1240. doi: 10.1002/jmri.21966. [DOI] [PMC free article] [PubMed] [Google Scholar]
- 25.Zhang S, Michaudet L, Burgess S, Sherry AD. Angew. Chem. Int. Ed. 2002;41:1919. [PubMed] [Google Scholar]
- 26.Terreno E, Castelli Daniela D, Cravotto G, Milone L, Aime S. Invest. Radiol. 2004;39:235. doi: 10.1097/01.rli.0000116607.26372.d0. [DOI] [PubMed] [Google Scholar]
- 27.Bombieri G, Marchini N, Clattini S, Mortillaro A, Aime S. Inorg. Chim. Acta. 2006;359:3405. [Google Scholar]
- 28.Thompson AL, Parker D, Fulton DA, Howard JAK, Pandya SU, Puschmann H, Senanayake K, Stenson PA, Badari A, Botta M, Avedano S, Aime S. Dalton Trans. 2006:5605. doi: 10.1039/b606206g. [DOI] [PubMed] [Google Scholar]
- 29.Bloembergen N. J. Chem. Phys. 1957;27:572. [Google Scholar]
- 30.Bloembergen N, Morgan LO. J. Chem. Phys. 1961;34:842. [Google Scholar]
- 31.Bloembergen N, Purcell EM, Pound RV. Phys. Rev. 1948;73:679. [Google Scholar]
- 32.Solomon I. Phys. Rev. 1955;99:559. [Google Scholar]
- 33.Solomon I, Bloembergen N. J. Chem. Phys. 1956;25:261. [Google Scholar]
- 34.Avecilla F, Peters JA, Geraldes CFGC. Eur. J. Inorg. Chem. 2003:4179. [Google Scholar]
- 35.Botta M. Eur. J. Inorg. Chem. 2000:399. [Google Scholar]
Associated Data
This section collects any data citations, data availability statements, or supplementary materials included in this article.


