

Abstract
Objective
To determine if heart rate variability changes during hot flashes recorded during sleep.
Methods
This study was performed in a university medical center laboratory with 16 menopausal women demonstrating at least four hot flashes per night. Polysomnography, heart rate, and sternal skin conductance to indicate hot flashes were recorded in controlled, laboratory conditions.
Results
For the frequency bin of 0–0.15 Hz, spectral power was greater during waking compared to nonREM sleep and less during Stages 3, 4 compared to Stages 1 and 2. Power was greater during hot flashes compared to subsequent periods for all hot flashes. Power was greater during hot flashes compared to preceding and subsequent periods for those recorded during Stage 1 sleep. For waking hot flashes, power in this band was higher before hot flashes than during or after them.
Conclusions
These data are consistent with our theory of elevated sympathetic activation as a trigger for menopausal hot flashes and with previous work on heart rate variability during the stages of sleep.
Keywords: Hot flashes, heart rate variability, sleep, thermoregulation, sympathetic activation
INTRODUCTION
Hot flashes are triggered by small elevations in core body temperature acting within a reduced thermoneutral zone in symptomatic menopausal women. This reduction is due to estrogen withdrawal and increased sympathetic activation, among other factors.1 The increase in sympathetic activation has been inferred from the fact that yohimbine, a compound that increases central sympathetic activation, provokes hot flashes and clonidine, a drug that reduces this activation, ameliorates them.2 Additionally, MHPG (3-methoxy-4-hydroxyphenylglcol), the main metabolite of plasma norepinephrine, is significantly higher in symptomatic vs. asymptomatic menopausal women and is significantly higher during hot flashes compared to preceding and subsequent periods.3 However, there are limitations to the interpretation of plasma MHPG measurements. First, an unknown amount of it is metabolized peripherally to VMA (vanamillic acid); thus, its source is ambiguous.4 Secondly, the half-life (30 minutes) of plasma MHPG is quite long compared to the length of most hot flashes (≈5–10 minutes).5 For these reasons, it would be desirable to develop additional measures of sympathetic activation, particularly more rapidly changing ones.
Over the past several years, research has developed to suggest that measures of heart rate variability in the frequency domain reflect different components of sympathetic and parasympathetic activation. Heart rate variability reflects beat-to-beat fluctuations in sinus rhythm. Vagal afferent stimulation leads to reflex excitation of vagal efferent activity and inhibition of sympathetic efferent activity. Opposing reflex effects are mediated by stimulation of sympathetic afferent activity. For a given signal, the power spectrum gives a plot of the portion of a signal’s power (energy per unit time) falling within given frequency bins. Computed using spectral analysis, Power in the frequencies of heart rate variability greater than 0.15 Hz reflects parasympathetic activation, whereas, power in frequencies below 0.15 Hz in part reflects sympathetic activation.6 Moreover, these changes are rapid and occur within seconds.
Recent studies have shown that some components of heart rate variability change during hot flashes7 and during sleep.8 We therefore sought to determine heart rate variability in menopausal hot flashes occurring during waking and during the stages of sleep. We hypothesized that heart rate variability in frequencies below 0.15 Hz would be significantly greater during waking compared to sleeping and greater during hot flashes compared to preceding and subsequent intervals.
METHODS
Participants
Data for the present study were collected during a previous investigation of 102 women, in the age range of 44–56 years, who reported disturbed sleep.9 The present data were selected on the basis of being free of artifacts and containing at least four hot flashes within the 8-hour period in bed.
Women were recruited using advertisements in local newspapers. They were given a telephone interview to eliminate those with chronic disorders affecting sleep (eg, chronic pain) and those using medications that would distort sleep (eg, antidepressants) or affect hot flashes (eg, hormone therapy). Women were then interviewed to give histories and written informed consent. All procedures were approved by the Wayne State University Human Investigation Committee. Subjects were paid for their participation. The characteristics of the16 participants whose data were selected for use in the present study are shown in Table 1.
TABLE 1.
Characteristics of subjects (mean ± SE, n = 20)
| Subject Number | Age (Years) | Race | Weight (Pounds) | Height (Inches) | BMI | STRAW Stage |
|---|---|---|---|---|---|---|
| 1549 | 44 | AA | 175 | 67 | 27 | +1 |
| 1579 | 50 | W | 148 | 66 | 24 | +1 |
| 1589 | 52 | AA | 173 | 61 | 32 | +1 |
| 1595 | 54 | AA | 235 | 63 | 42 | +1 |
| 1598 | 49 | AA | 210 | 65 | 35 | +1 |
| 1599 | 47 | W | 150 | 68 | 23 | +1 |
| 1567 | 52 | AA | 150 | 62 | 26 | +1 |
| 2501 | 54 | W | 230 | 63 | 41 | +2 |
| 2505 | 52 | W | 110 | 62 | 20 | +1 |
| 2508 | 49 | W | 138 | 63 | 24 | +1 |
| 2509 | 47 | AA | 250 | 65 | 45 | +2 |
| 2513 | 51 | AA | 150 | 64 | 27 | +1 |
| 2514 | 55 | AA | 160 | 62 | 29 | +1 |
| 2515 | 53 | W | 154 | 72 | 21 | +1 |
| 2521 | 48 | W | 215 | 64 | 37 | +1 |
| 2524 | 51 | AA | 136 | 66 | 22 | +1 |
| 50.8 ± 0.7 | 11 African-American 9 White |
172 ± 10 | 65 ± 6 | 29 ± 1.8 |
BMI, body mass index; STRAW, Stages of Reproductive Aging Workshop.15
Procedures
Women wore cotton scrub suits and were covered with a light blanket in a temperature (23°C) and humidity (RH = 45%) controlled laboratory. They remained in bed for 8 hours at their usual bedtimes.
Standard polysomnography leads (C3A2, O2A1, ROC/A1, LOC/A2, submental EMG, and ECG (lead I)) were recorded using published methods10 on a Grass Heritage System. Sleep stages were manually scored from the computer screen in 30 second epochs using the revised AASM10 criteria. This was done by a registered polysomnographic technologist. Hot flashes were recorded using sternal skin conductance (SCL) according to previously published methods.11 All data were digitized at 100Hz and stored on CD ROMs for subsequent analyses.
Heart rate variability measurements
The Grass Gamma Review software version 4.2 was used to generate an R-R interval curve from the ECG data for the entire 8-hour recording. Prior to generating the R-R curve, a band pass filter, 5–50 Hz, was applied to the ECG data and an amplitude threshold level set to remove artifacts.
A trend analysis was performed on the SCL data to determine the location of hot flashes that occurred during sleep and the particular sleep stage associated with each hot flash. The R-R interval plug-in allows a Fast Fourier Transform (FFT) to be determined over a specified block of R-R data. A 5-minute block just before the hot flash, a 5-minute block at the start of the hot flash, and a 5-minute block after the hot flash were chosen. An additional 5-minute block of waking data was selected prior to the subjects’ onset of sleep. The FFT software allows the selection of bin widths. A width of 0.15 Hz was chosen, yielding 0–0.15 Hz, 0.15–0.30 Hz, and 0.30–0.45 Hz bin widths containing the Power Spectral Density (PSD) in units of (seconds RMS) ^2/Hz. The 5-minute time blocks as well as the frequency bins were selected according to previously published recommendations.12
Statistical analysis
Data were analyzed with SPSS v. 18.0 for Windows. The digitized heart rate data were first log-transformed, as done previously.7 These data were then analyzed using mixed-model repeated-measures analyses of variance with Period (5 minutes before, 5 minutes during, 5 minutes after) and Hot Flash as the repeated-measures factors and stage of sleep as a fixed factor. This was done separately for each of the three frequency bands. In scoring the sleep stages, Stages 3 and 4 were considered as a single stage.10 The analyses of variance utilized a variance-covariance matrix assuming compound symmetry. The minimum level of statistical significance for all analyses was P < 0.05.
RESULTS
The only significant effects obtained were for the frequency bin of 0–0.15 Hz. The analysis of variance showed significant effects for Period (P < .03) Stage (P < .003), and Period x Stage (P< .03). Table 2 shows that spectral power was significantly higher during hot flashes compared to subsequent periods. Table 3 shows that spectral power was significantly (P < .02) higher during waking compared to Stage 2 and to Stages 3, 4 (P < .01) and significantly (P < .04) higher in Stage 1 compared to Stages 3, 4. The Period x Stage interaction effect was then broken into the lower order simple effects. These demonstrated significant Period effects for waking (P < .001) and Stage 1 (P < 0.002); see Table 4 and Fig. 1. Data shown in the tables are raw values, i.e., not log-transformed. There were no other significant effects whatsoever for any analysis.
TABLE 2.
Hert rate variability in frequency band 0 – 0.15 Hz (mean ± SE), Hz before, during, and after all hot flashes
Significantly different from each other, P < 0.02.
N = number of observations.
TABLE 3.
Heart rate variability in frequency band 0 – 0.15 Hz during Hz sleep stages (mean ± SE)
| Stage | Mean | N | SE |
|---|---|---|---|
| Awakea | 1.41 | 47 | 0.16 |
| Stage 1b | 1.34 | 17 | 0.22 |
| Stage 2a | 0.89 | 10 | 0.11 |
| Stages 3, 4a,b | 0.31 | 9 | 0.30 |
| REM | 1.06 | 6 | 0.35 |
Significantly different from each other, P < 0.02, planned comparison with Bonferroni correction for degrees-of-freedom.
Significantly different from each other, P < 0.05, planned comparison with Bonferroni correction for degrees-of-freedom.
N = number of observations.
TABLE 4.
Heart rate variability in frequency band 0 – 0.15 Hz (mean ± SE), before, during, and after hot flashes during waking and Stage 1 sleep
Significantly different from each other, P < 0.003, planned comparison with Bonferroni correction for degrees-of-freedom.
Significantly different from each other, P < 0.001, planned comparison with Bonferroni correction for degrees-of-freedom.
Significantly different from each other, P < 0.03, planned comparison with Bonferroni correction for degrees-of-freedom.
N = number of observations.
FIG. 1.
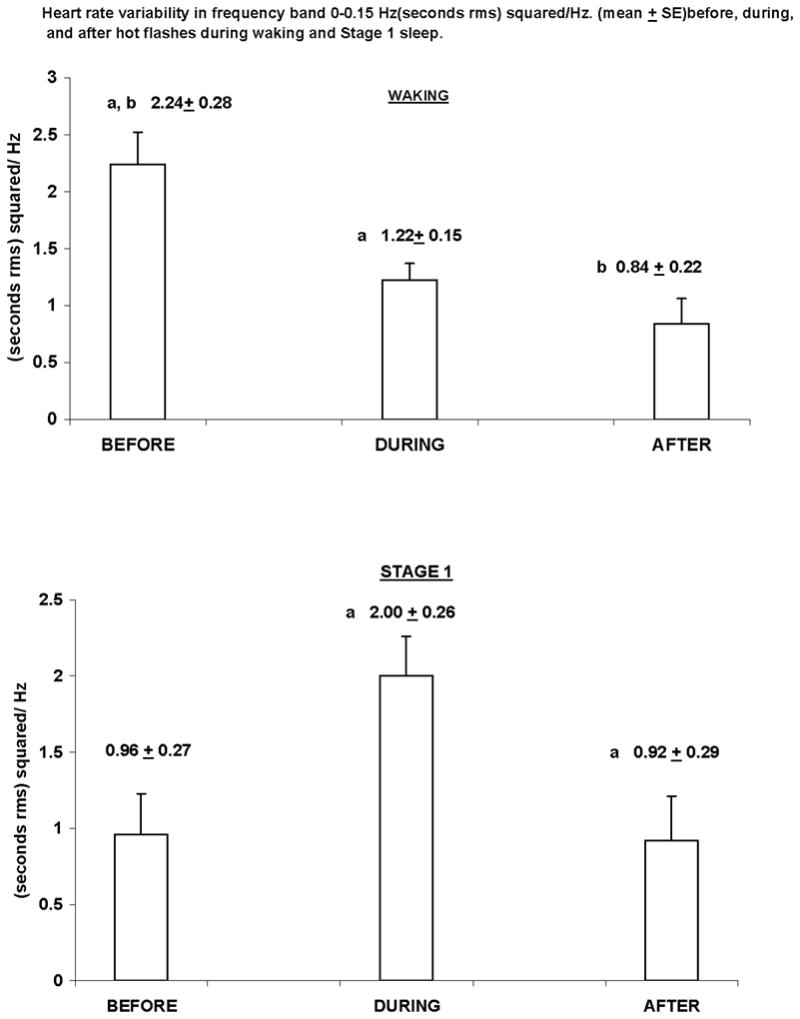
WAKING
aSignificantly different from each other, P < 0.003, planned comparison with Bonferroni correction for degrees-of-freedom.
bSignificantly different from each other, P <0.001, planned comparison with Bonferroni correction for degrees-of-freedom.
STAGE 1
aSignificantly different from each other, P <0.03, planned comparison with Bonferroni correctionfor degrees-of-freedom.
DISCUSSION
In the present investigation, we found greater heart rate variability in the frequency band of 0–0.15 Hz during waking compared to nonREM sleep (Stages 2, 3, 4) and less during delta sleep (Stages 3, 4) compared to waking and to Stages 1 and 2. These findings reflect the well known decline in autonomic activation at sleep onset13 and during delta sleep.14
We found that heart rate variability in this frequency band was significantly higher during hot flashes compared to subsequent periods. We also found that heart rate variability increased significantly during hot flashes relative to preceding and subsequent periods for those recorded during Stage 1 sleep. Our results are consistent with those of a previous study,8 which also reported that power in this band significantly increased during hot flash intervals compared to asymptomatic intervals. The present investigation is advantageous for two reasons. First, sleep was recorded in controlled, laboratory conditions and staging determined using standard, polysomnographic procedures. Second, hot flashes were physiologically demarcated as opposed to being reported in diaries.
Based on our previous MHPG data3 and on data obtained during sleep,8 we hypothesized that heart rate variability in the 0–0.15 Hz band would be greater during hot flashes compared to preceding and subsequent periods at all times. In the present data, only the comparison between the “During” and “After” periods was statistically significant. Significant differences among all three periods were obtained only during Stage 1 sleep. We do not know why this was not found during the other sleep stages. Our finding of increased heart rate variability before vs. during and vs. after waking hot flashes probably reflects the elevation in sympathetic activation triggering hot flashes. The discrepancy with the MHPG findings is best explained by the poor temporal resolution of this measurement.
Our results differ from those of a recent study,7 which found that heart rate variability within the frequency band of 0.15–0.50 Hz decreased significantly during hot flashes, relative to periods before and after hot flashes. However, it should be noted that the methods in that study were quite different from ours: data were averaged into 1-minute blocks and were recorded during waking as opposed to sleeping periods. Additional studies using those methods would be worthwhile.
CONCLUSIONS
The present study demonstrates that spectral power in the frequency band of 0–0.15 Hz is greater during waking compared to nonREM (Stages 2, 3, 4) sleep and less during delta (Stages 3, 4) sleep compared to waking and to Stages 1 and 2. We also found that heart rate variability in this band was significantly higher during hot flashes compared to subsequent periods and increased significantly relative to preceding and subsequent periods in hot flashes recorded during Stage 1 sleep. Finally, in the case of waking hot flashes, we found significantly greater power in this band prior to hot flashes compared to subsequent periods, consistent with our theory of sympathetic activation triggering hot flashes.
This study is distinguished by the fact that data were recorded during controlled laboratory conditions and analyzed using accepted published methods. Our data on spectral power during stages of sleeping and waking are consistent with previously published work. Further research on sympathetic activation during hot flashes in various states of consciousness and of reproductive aging would be of great interest and would extend the generalizability of the present findings.
Acknowledgments
We are grateful to Edward L. Peterson, Ph.D., for help with the statistical analyses.
Funding/support: This work was supported by a grant from the National Institutes of Health: R01-MH-63089 (Dr. Freedman, Principal Investigator).
Footnotes
Financial disclosure/conflicts of interest: None reported.
References
- 1.Freedman RR, Krell W. Reduced thermoregulatory null zone in postmenopausal women with hot flashes. Am J Obstet Gynecol. 1999;181:66–70. doi: 10.1016/s0002-9378(99)70437-0. [DOI] [PubMed] [Google Scholar]
- 2.Freedman RR, Woodward S, Sabharwal SC. Adrenergic mechanism in menopausal hot flushes. Obstet Gynecol. 1990;76:573–578. [PubMed] [Google Scholar]
- 3.Freedman RR, Woodward S. Elevated α2-adrenergic responsiveness in menopausal hot flushes: pharmacologic and biochemical studies. In: Lomax P, Schönbaum E, editors. Thermoregulation: The Pathophysiological Basis of Clinical Disorders. Basel: Karger; 1991. pp. 6–9. [Google Scholar]
- 4.Lambert GW, Kaye DM, Vaz M, et al. Regional origins of 3-methoxy-4-hydroxyphenlglycol in plasma: effects of chronic sympathetic nervous activation and denervation and acute reflex sympathetic stimulation. J Auton Nerv Syst. 1995;55:169–178. doi: 10.1016/0165-1838(95)00041-u. [DOI] [PubMed] [Google Scholar]
- 5.Kopin IJ, Blombery P, Ebert MH, et al. Disposition and metabolism of MHPG-CD3 in humans: plasma MHPG as the principal pathway of norepinephrine metabolism and as an important determinant in CSF levels of MHPG. In: Usdin E, et al., editors. Frontiers in Biochemical and Pharmacological Research in Depression. New York, NY: Raven Press; 1984. pp. 57–68. [PubMed] [Google Scholar]
- 6.Ng J, Sundaram S, Kadish AH, Goldberger JJ. Autonomic effects on the spectral analysis of heart rate variability after exercise. Am J Physiol Heart Circ Physiol. 2009;297:H1421–H1428. doi: 10.1152/ajpheart.00217.2009. [DOI] [PMC free article] [PubMed] [Google Scholar]
- 7.Thurston RC, Christie IC, Matthews KA. Hot flashes and cardiac vagal control: a link to cardiovascular risk? Menopause. 2010;17:456–461. doi: 10.1097/gme.0b013e3181c7dea7. [DOI] [PMC free article] [PubMed] [Google Scholar]
- 8.Hoikkala H, Haapalahti P, Viitasalo M, et al. Association between vasomotor hot flashes and heart rate variability in recently postmenopausal women. Menopause. 2010;17:315–320. doi: 10.1097/gme.0b013e3181c2bb6d. [DOI] [PubMed] [Google Scholar]
- 9.Freedman RR, Roehrs TA. Sleep disturbance in menopause. Menopause. 2007;14:1–4. doi: 10.1097/GME.0b013e3180321a22. [DOI] [PubMed] [Google Scholar]
- 10.Iber C, Ancoli-Israel S, Chesson A, Quan SF, editors. The AASM Manual for the Scoring of Sleep and Associated Events: Rules, Terminology, and Technical Specification. 1. Westchester, IL: American Academy of Sleep Medicine; 2007. [Google Scholar]
- 11.Freedman RR. Laboratory and ambulatory monitoring of menopausal hot flashes. Psychophysiology. 1989;26:573–579. doi: 10.1111/j.1469-8986.1989.tb00712.x. [DOI] [PubMed] [Google Scholar]
- 12.Task Force of the European Society of Cardiology the North American Society of Pacing Electrophysiology. Heart rate variability. Standards of measurement, physiological interpretation, and clinical use. Circulation. 1996;93:1043–1065. [PubMed] [Google Scholar]
- 13.Yang CCH, Lai C-W, Lai HY, Kuo TBJ. Relationship between electroencephalogram slow-wave magnitude and heart rate variability during sleep in humans. Neuroscience Letters. 2002;329:213–216. doi: 10.1016/s0304-3940(02)00661-4. [DOI] [PubMed] [Google Scholar]
- 14.Furlan R, Guzzetti S, Crivellaro W, et al. Continuous 24-hour assessment of the neural regulation of systemic arterial pressure and RR variabilities in ambulant subjects. Circulation. 1990;81:537–547. doi: 10.1161/01.cir.81.2.537. [DOI] [PubMed] [Google Scholar]
- 15.Harlow SD, Cain K, Crawford S, et al. Evaluation of four proposed bleeding criteria for the onset of late menopausal transition. J Clin Endocrinol Metab. 2006;91:3432–3438. doi: 10.1210/jc.2005-2810. [DOI] [PMC free article] [PubMed] [Google Scholar]