

Abstract
Inhibitory interneurons constitute ∼20% of auditory cortical cells and are essential for shaping sensory processing. Connectivity patterns of interneurons in relation to functional organization principles are not well understood. We contrasted the connection patterns of parvalbumin-immunoreactive cells in two functionally distinct cortical regions: the tonotopic, narrowly frequency-tuned module [central narrow band (cNB)] of cat central primary auditory cortex (AI) and the nontonotopic, broadly tuned second auditory field (AII). Interneuronal connectivity patterns and laminar distribution were identified by combining a retrograde tracer (wheat-germ agglutinin apo-horseradish peroxidase colloidal gold) with labeling of the Ca2+ binding protein parvalbumin (Pv), a marker for the GABAergic interneurons usually described physiologically as fast-spiking neurons. In AI, parvalbumin-positive (Pv+) cells constituted 13% of the retrograde labeled cells in the immediate vicinity of the injection site, compared to 10% in AII. The retrograde labeling of Pv+ cells along isofrequency countours was confined to the cNB. The spatial spread of labeled excitatory neurons in AI was more than twice that found for Pv+ cells. By contrast, in the AII, the spread of Pv+ cells was nearly equal to that of excitatory neurons. The retrograde labeling of Pv+ cells was anisotropic in AI and isotropic in AII. This demonstration of inhibitory networks in auditory cortex reveals that the connections of cat GABAergic AI and AII cells follow different anatomical plans and thus contribute differently to the shaping of neural response properties. The finding that local connectivity of parvalbumin-immunoreactive neurons in AI is closely aligned with spectral integration properties demonstrates the critical role of inhibition in creating distinct processing modules in AI.
Introduction
Understanding of the mechanisms of cortical processing of sensory information requires an examination of the relationships between excitatory and inhibitory cortical circuitry, functional architecture, and receptive field properties (Gilbert, 1993; Kisvarday et al., 1994; Read et al., 2001; Marino et al., 2005; Katzel et al., 2011). The functional contributions of inhibitory circuits in auditory cortex (AC) include sharpening of frequency and intensity tuning, and shaping of spectral modulation preferences (Suga and Manabe, 1982; Shamma and Symmes, 1985; Calford and Semple, 1995; Sutter et al., 1999; Sutter and Loftus, 2003; Wehr and Zador, 2003; Oswald et al., 2006; Wu et al., 2008). Inhibitory circuits dynamically coordinate with excitatory circuits to shape cortical spiking activities (Wehr and Zador, 2003; Zhang et al., 2003; Wu et al., 2006; Tan et al., 2007). However, little is known regarding how inhibitory networks are organized with respect to the functional organization of auditory cortex.
Fast-spiking (FS) parvalbumin-positive (Pv+) inhibitory cells represent the largest inhibitory subpopulation (∼40%) (Tamamaki et al., 2003). Their soma and axon initial segment targeting preference (Kisvarday et al., 1993; DeFelipe, 1997; DeFelipe et al., 1999; Markram et al., 2004) and fast-spiking behavior (McCormick et al., 1985; Bruno and Simons, 2002; Andermann et al., 2004; Bartho et al., 2004; Atencio and Schreiner, 2008) allow them to provide powerful feedforward and feedback inhibition for rapid control over the rate and timing of action potentials (Buzsaki and Eidelberg, 1981; McBain and Fisahn, 2001; Pouille and Scanziani, 2001; Jonas et al., 2004; Pouille and Scanziani, 2004; Freund and Katona, 2007). The specific functional roles of Pv+ inhibitory neurons in the auditory cortex have not been characterized, although fast-spiking neurons show some general functional differences from excitatory neurons (Atencio and Schreiner, 2008). How interneuronal distributions and connectivities are related to receptive field properties and whether cortical areas at different hierarchical levels express similar organizational principles of inhibition is still poorly understood (Yuan et al., 2010). To characterize such organizations, two functionally very disparate areas were chosen to assess and compare local inhibitory convergence patterns: the central narrow band (cNB) spectral integration module of the cat primary auditory cortex (AIcNB) (Read et al. 2001) and the second auditory field (AII) (Schreiner and Cynader, 1984).
Physiological differences between the primary region (AI) and the nonprimary region (AII) include disparities in tonotopicity (AI > AII), response threshold (AI < AII), and their spectral integration across broad frequency ranges (AII > AI) (Schreiner and Cynader, 1984; Schreiner and Mendelson, 1990; Pandya et al., 2008). It is likely that differences in the extent of inhibitory influences contribute to frequency tuning differences. Convergent horizontal connections between AI subregions with similarly narrow frequency tuning have been demonstrated (Read et al., 2001). How inhibitory connections contribute to the function of AI and AII is still unknown. Moreover, these fields represent different levels of information processing (Rouiller et al., 1991). Thus, contrasting the organization patterns of inhibitory circuits between these two physiologically and hierarchically distinct regions may help clarify the roles of local circuits in determining functional properties.
Materials and Methods
Surgical preparation.
Experiments were conducted on the right hemispheres of six female young adult cats. Surgical preparation, stimulus delivery, and recording procedures have been described previously (Schreiner and Mendelson, 1990) with exceptions noted below. Ketamine hydrochloride (30 mg/kg) and acetylpromazine maleate (0.15 mg/kg) were injected intramuscularly for initial sedation. After venous cannulation, pentobarbital sodium (15–30 mg/kg, i.v.) was administered for surgical procedures including tracheotomy and craniotomy. After surgically exposing AI and AII, lactated Ringer's solution (1–3 ml/kg/h), ketamine HCl (1–3 mg/kg/h), and diazepam (0.5–2 mg/kg/h) solution were infused continuously during physiological recording to maintain an areflexic level of anesthesia. All procedures were in accordance with an experimental protocol approved by the University of California, San Francisco, Institutional Animal Care and Use Committee.
Stimulus generation and delivery.
Experiments were conducted in a double-walled sound-shielded room (IAC). Auditory stimuli were presented through calibrated STAX-54 headphones, which were inserted into the external acoustic meatus via a sealed tube. The frequency response of the system was effectively flat from 100 Hz to 14 kHz, a range that included the preferred frequencies of most of the neurons in this study, and did not have major resonances deviating >6 dB from the average level. Above 14 kHz, the output rolled off at a rate of 10 dB per octave.
Tone bursts were generated and attenuated by a Tucker-Davis Technologies system. Additional attenuation was provided by a pair of passive attenuators. The duration of the tone bursts was 50 ms, including 3 ms rise and fall time. The interstimulus interval was 500 ms. Sounds were presented at equal sound pressure levels to each ear. Frequency response areas (FRAs) were constructed from responses to 675 tone bursts, which were presented in a pseudorandom sequence of different combinations of frequency (spanning three or four octaves) and level (5–75 dB SPL).
Recording procedure.
A picture of the AC surface was captured and digitized with a CCD digital camera (Cohu). Parylene-coated tungsten double microelectrodes (MicroProbe) with 0.5–1.0 MΩ impedance at 1 kHz were introduced into the auditory cortex orthogonally by a remote-controlled hydraulic microdrive (David Kopf Instruments). Recordings were made at layers IIIb and IV (∼800–1,000 μm). Effects of dimpling of the cortical surface from electrode insertion on the depth estimate were minimized by overinsertion and careful retraction of the electrode. Neuronal activity of multiple units was amplified, bandpass filtered, and digitized (RA16 Multi-Channel Neurophysiology Workstation; Tucker-Davis Technologies). Multiunit activity was quantified by the number of threshold crossings set to two to three times the background recording noise.
Most of the recordings were conducted along midfrequency (5–20 kHz) isofrequency contours to identify spectral integration modules in AI and were extended to the ventral border of AII. For each recording site, three response properties were measured and extracted from FRAs (Schreiner and Sutter, 1992): minimum threshold (the minimum sound pressure level evoking a response), characteristic frequency (CF; the tone frequency evoking a response at minimum threshold), and Q40 (CF divided by FRA bandwidth at 40 dB above minimum threshold; the higher the Q value, the narrower the spectral bandwidth). On a digital picture, recording sites with Q40 < 1.2, Q40 = 1.2–1.5, and Q40 > 1.5 were marked. A cluster of neurons centrally located in the isofrequency domain with Q40 > 1.5 was considered part of the AIcNB region (Read et al., 2001). The border between ventral AI and AII was estimated by the occurrence of loss of strict tonotopy, increased minimum response thresholds, and a further broadening of spectral bandwidth (Schreiner and Cynader, 1984). The ventral border of AII was indicated by sites unresponsive to pure-tone stimulation.
Connectional methods.
A retrograde tracer, wheat-germ agglutinin apo-horseradish peroxidase colloidal gold (WAHG) (Basbaum and Menetrey, 1987), was injected into the cNB region of AI or AII. The tracer (EY Laboratories) was concentrated by centrifugation and delivered by pressure injection (Nanoliter Injector; World Precision Instruments). Five 4.6 nl pulses were delivered through a glass micropipette (tip diameter, 25 μm) at four depths targeting layers III–VI (400–1600 μm) for a total volume of ∼80–100 nl. The exposed auditory cortex was then covered with silicon oil, and animals were maintained for ∼36 h for tracer transport. Animals were then given pentobarbital sodium (40 mg/kg, i.v.) and perfused transcardially with formalin (Shandon Zinc Formol Fixx; Thermo Electron). Cortex was dissected, stereotaxically blocked, cryoprotected, and cut transversely into slices of 30 to 40 μm thickness.
Immunohistochemistry.
For Pv colocalization, one of the series of frozen sections (40 μm thickness) was incubated in normal horse serum and then in primary monoclonal mouse anti-parvalbumin (Swant; 1:5000) with 2% N-hydroxysuccinimide overnight at 4°C. ABC immunoperoxidase processing (Vector Laboratories), and diaminobenzidine histochemistry revealed Pv+ profiles with a dark brown soma and proximal dendrites. Sections were silver intensified on the slide (Kierkegaard and Perry Laboratories) for 60 min, rinsed, and fixed in sodium thiosulfate, and then dehydrated, cleared, and coverslipped. WAHG and Pv double-labeled (DL) neurons had black cytoplasmic granules in the same focal plane as the brown-stained somata. WAHG single-labeled (SL-G) neurons were only indicated by a cluster of gold granules. Even sparsely labeled neurons are highly refractile in dark-field illumination; double- and single-labeled profiles were always confirmed in bright-field illumination. Nissl staining of an adjacent series was conducted to identify and plot the layers.
Analysis.
Pv was colocalized with the WAHG in a subset of cortical neurons. Double- and single-labeled cells were plotted across the hemisphere. Controls included sections incubated for Pv alone and sections silver intensified for the WAHG localization that produced no double labeling. Labeled neurons were plotted with a 40× objective on the Neurolucida image-analysis system (MicroBrightField). Plots of layers from adjacent Nissl sections were superimposed onto plotted cells to identify the laminar distribution (Yuan et al., 2010). To minimize analytical bias, cells and laminar borders were plotted by different investigators. Positions of blood vessels on the surface of cortex were used to align cellular plots with physiological maps. Each layer of auditory cortex was divided into 200-μm-wide bins throughout each injected hemisphere for quantitative analysis of neuronal density. Statistical tests, such as Student's t test, one-way ANOVA, and the multiple comparison test, were performed with MATLAB and included corrections for multiple comparisons (Bonferroni–Dunn or Tukey–Kramer procedures).
Results
In each animal, frequency response areas were reconstructed for 30–40 double electrode penetrations across AI and AII to physiologically identify suitable locations for neuroanatomical tracer injections (Fig. 1A,B). The dorsal and ventral AI and AII borders, and three subregions in AI [dorsal broadband (dBB), cNB, and ventral broad band (vBB)], were reliably identified by using spectral integration bandwidth, response threshold, and the consistency of the tonotopic gradient (Schreiner and Mendelson, 1990; Read et al., 2001, 2011). To make these assessments, we used the CF and Q40 value derived from multiunit responses for each recording site. Two detailed distributions of CF and Q40 values across the surface of mapped auditory cortex are illustrated in Figure 1, C and D. Recording sites were marked with differently colored dots, corresponding to different Q40 ranges (Fig. 1A,B). Multiunit recordings were focused on a narrow frequency range along the dorsoventral axis to minimize potential tissue damage by multiple penetrations. AII is identified by the loss of tonotopy, significantly lower values of Q40 (i.e., broader frequency tuning), and higher response thresholds than in AI (Schreiner and Cynader, 1984). cNB was characterized by Q40 values of >1.5 (Fig. 1E,F) (Read et al., 2001). The ventral and dorsal boundaries of the cNB were defined as the locations where a polynomial fit of the Q40 distribution fell below 1.5. The dorsoventral widths of the cNB and vBB along the isofrequency contour were 2162 ± 40 μm and 1050 ± 50 μm, respectively (n = 3).
Figure 1.
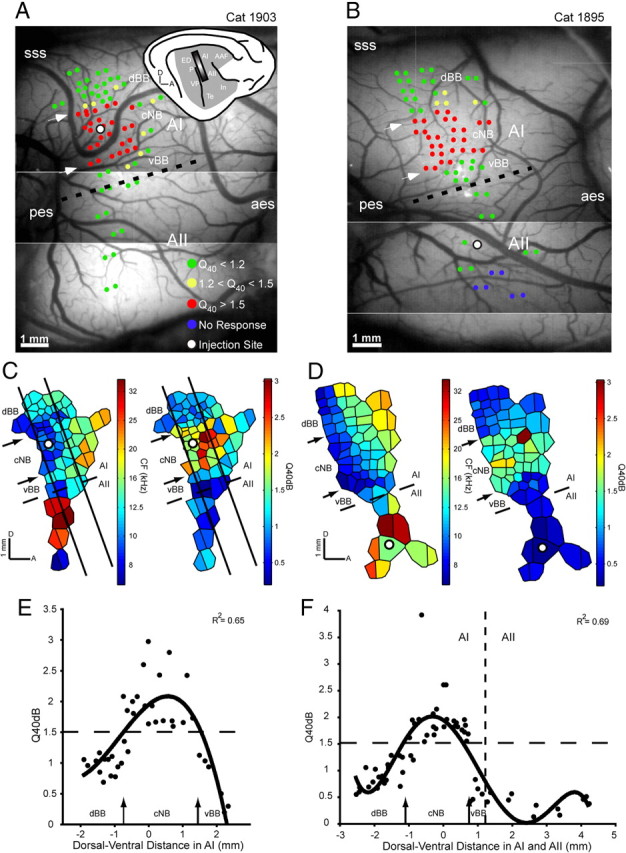
Representation of CF and frequency tuning bandwidth (Q40) in the AI and AII of two cats, 1903 and 1895. A, B, Lateral view of right auditory cortex with multiunit mapping sites. Recording sites within different Q40 values are represented with dots of different colors. The small inset on the right corner of A is a schematic view of a right hemisphere, indicating the approximate mapping area, which covers AI and AII (shaded rectangle). Dashed lines show the physiological border between AI and AII. White arrows point to the physiologically defined dorsal and ventral boundaries of the AIcNB. Sulci: aes, anterior ectosylvian sulcus; pes, posterior ectosylvian sulcus; SSS, superior sylvian sulcus; AAF, anterior auditory field; ED, posterior ectosylvian gyrus, dorsal part; In, insular cortex; P, posterior auditory cortex; Te, temporal cortex; VP, ventral posterior auditory area. Scale bar, 1 mm. C, D, Tessellated CF and Q40 maps for mapping area shown in A and B, respectively. Dashed lines and arrows correspond to those in A and B. E, F, Distribution of Q40 values as function of dorsoventral distance relative to injection sites in AI and AII, respectively. Zero along the x-axis indicates the position of an injection site. Q40 values of the recording sites located between the two oblique lines in C (approximate isofrequency) and all recording sites in D are displayed. A fifth-degree polynomial fit is applied to demonstrate the general distribution pattern of frequency tuning bandwidth (correlation coefficient is indicated in the top right corner). Horizontal dashed lines indicates a Q40 value of 1.5; the vertical dashed line in F indicates the boundary between AI and AII. Arrows correspond to those in A and B, respectively.
To reveal the pattern of neural connectivity in AI and AII, injections of a retrograde tracer, WAHG, were placed using a microinjector at four cortical depths (∼450, 900, 1350, and 1800 μm) across the six cortical layers (see Materials and Methods) after extracellular mapping. For the example case shown in Figure 1A, an injection was placed toward the dorsal region of the cNB (Fig. 1A). Injections into AII were ∼2 mm ventral to the AI/AII border approximately along the ventral extension of the 14–20 kHz isofrequency contours of AI (Fig. 1B). This location was at or near the crest of the ectosylvian gyrus. Examples of a bright-field and dark-field injection track in AI and AII, respectively, are shown in Figures 2, A and B. SL-G cells were outlined by gold granules. Pv+ cells had brown somata and proximal dendrites. DL cells had black cytoplasmic granules in the same focal plane as the brown-stained somata and were always confirmed in bright-field illumination (Fig. 2A).
Figure 2.
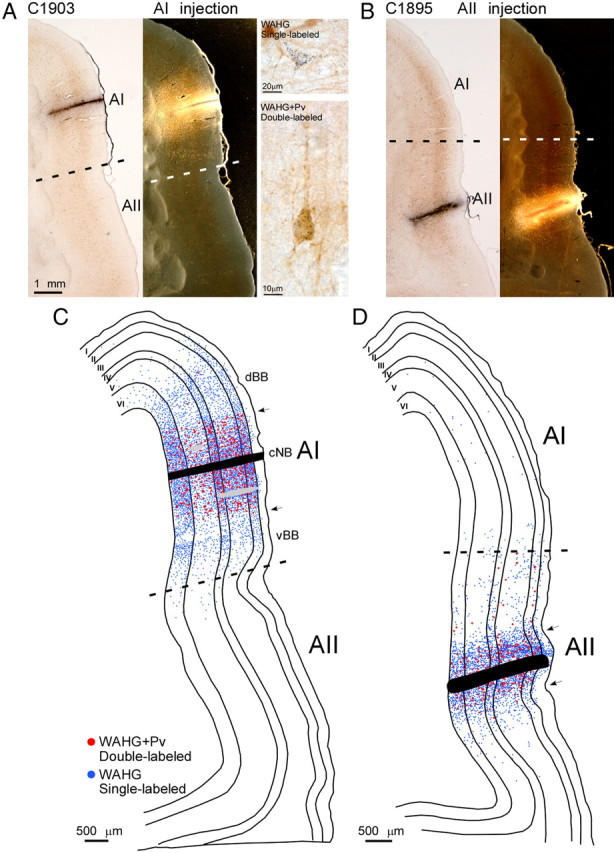
Dorsoventral spatial convergence profiles of SL-G and DL cells. A, Left to right, Bright-field view of a representative section with tracer (WAHG) injection track in AIcNB; dark-field view of the same section; WAHG SL example cell outlined by black gold granules (top); WAHG and Pv DL example cell (bottom). Dashed line indicates anatomical border between AI and AII. B, Left to right, Bright- and dark-field views of a representative section with tracer injection track in AII (same scale as in A). C, D, Neurolucida plots of the dorsoventral and laminar distribution of SL-G and DL cells from the two sections depicted in A and B, respectively. Arrows point to the edge of the region with a high density of DL cells. Blue and red dots represent SL-G and DL cells, respectively. Cortical layers are indicated by roman numerals I–VI. Dashed lines indicate the anatomical border between AI and AII. Gray bars in C indicate blood vessels.
Dorsoventral distribution patterns in AIcNB and AII
To characterize the distribution pattern of single- and double-labeled cells in the dorsoventral dimension of AI and AII, coronal sections were plotted containing an injection track (see Materials and Methods). SL-G and DL cells were plotted separately; cortical layers were drawn using adjacent Nissl-stained sections and then superimposed to reveal the laminar distribution of the retrogradely labeled cells (Fig. 2C,D). In both AI and AII, DL cells, i.e., WAHG and Pv+ cells, were found in all layers except layer I (Fig. 2C,D, red dots). According to the morphology of labeled cells, DL cells constituted mainly basket multipolar cells and bipolar cells. Since the optical resolution was limited by the dark background caused by immunoprocessing, the ratio of specific subtypes of DL cells could not be reliably assessed.
In AI, SL-G cells from cNB injections extended from the dorsal zone of auditory cortex to the AI/AII border with only few cells found in AII (Fig. 2C, light blue dots). In AII, SL-G cells were spread across the whole area with only a few cells found in the central and dorsal zones of AI (Fig. 2D, light blue dots). This indicates weak corticocortical interactions between AI and AII.
To quantify the spatial convergence profiles of both type of cells, we determined the number and proportion of DL cells found at different distances from the injection site along the dorsoventral dimension. Since double-labeled cells were not observed in layer I, further data analysis does not include data from layer I. We found that, unsurprisingly, SL-G cells were significantly more common than DL cells in both central AI and AII (n = 3; AI, 3458 ± 408 vs 382 ± 21; AII, 1682 ± 440 vs 180 ± 12; p < 0.01, one-way ANOVA) (Fig. 3A–D). In addition, the number of both cell types in central AI was significantly higher than in AII (n = 3; DL, 382 ± 21 vs 180 ± 12; SL-G, 3458 ± 408 vs 1682 ± 440; p < 0.01, one-way ANOVA) (Fig. 3A–D). The differences in dorsal–ventral distribution pattern between DL and SL-G cells and between central AI and AII became much clearer when numbers across all the layers were averaged (Fig. 4). Generally, the highest density of both cell types was observed near the injection site in both areas; however, the number of DL and SL-G cells declined at different rates as a function of distance from the injection boundary. In AI, the total number of labeled cells dropped to 50% of the maximum cell count at ∼800 ± 100 μm, which is indicated by the dashed line in Figure 4A. More than 80% of total DL cells were found within this 800 μm range; however, only <60% of SL-G cells were observed within that range. The number of the DL and SL-G cells dropped to 20% of the total at 1000 ± 100 and 1600 ± 100 μm, respectively, indicating that there are significantly more long-distance projecting SL-G cells than DL cells. Functionally, this difference probably means the neurons in the cNB integrate excitatory inputs from a range that is significantly wider than that of inhibitory inputs.
Figure 3.

Laminar distribution of the convergence profiles of SL-G and DL cells in the dorsoventral direction of AI and AII. A, B, Distribution of averaged DL cell count pooled from three cats with distance from injection site per layer. Layer I is not shown, since no DL cells were found. C, D, Distribution of averaged SL-G-cell count by layer (n = 3).
Figure 4.

The distribution pattern of SL-G and DL cells averaged across layers. A, B, Comparison of the mean SL-G and DL cell distribution pattern for three cats. Cell count was averaged across layers. Dashed lines indicate the cell count 50% below maximum, which is derived from the mean of the maximum of the dorsal and ventral portions. The distributions of SL-G and DL cells are indicated by different symbols.
In AII, the number of labeled cells dropped to 50% at ∼500 ± 100 μm, which indicates a spatially more restricted convergence range than in central AI (Fig. 4B). In AII, more DL cells were found at distances >1000 μm than in AI (7.6 ± 3.4% vs 0.9 ± 0.4%) (Fig. 4A,B); however, the number of DL cells in AII dropped to 50% (20%) within 500 ± 100 μm (700 ± 100 μm), from the injection site. These distances were significantly shorter than the corresponding distances of 800 ± 100 μm and 1000 ± 100 μm seen in AI (p < 0.05, Student's t test). These data suggest a more local innervation pattern by inhibitory neurons in AII than in AI.
Although these data suggest that the majority of DL and SL-G cells in AII were located much closer to the injection site than those in AI, the overall spatial spread of DL cells in AII was significantly wider than that in AI (p < 0.05, Student's t test) due to a few DL cells with long-distance projections. For the population shown in Figure 3, A and B, the most distant DL cells were found at 1800 ± 200 μm in AI and at 2133 ± 116 μm in AII, respectively. DL cells in AII extended up to the AI/AII border, but did not cross the border.
Rostrocaudal distribution patterns in AIcNB and AII
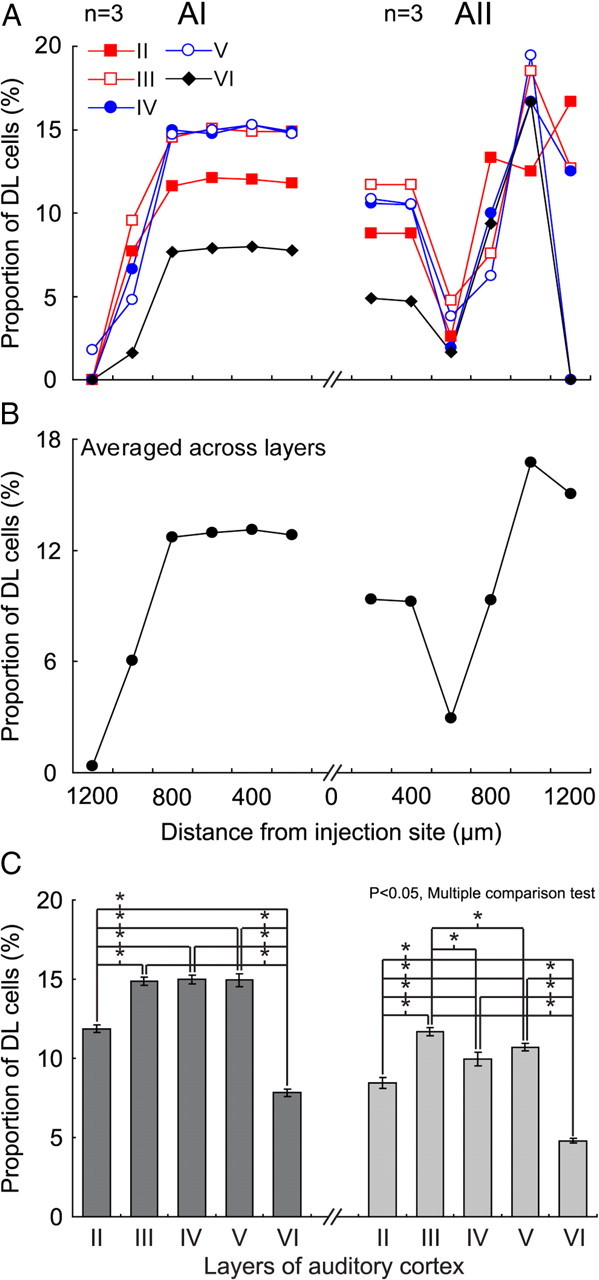
To estimate the distribution of DL cells along the rostrocaudal direction (i.e., along the frequency gradient of AI), DL cells were plotted for every fourth section, (i.e., every 160 μm) for one AI and one AII case (Fig. 5A,B). Again, the threshold of 50% of the maximum cell count was used to describe the distribution pattern of cells. Summed from layers II–VI, ∼95% of DL cells were confined within ±960 μm from the injection site in both AI and AII (Fig. 5C,D). Within the region defined by the 50% threshold, 63 and 59% of DL cells were observed in AI and AII, respectively. These numbers were significantly lower than the 90% (AI) and 70% (AII) obtained for the dorsoventral distribution, suggesting a more gradual decline of inputs with distance. We found it interesting that the 50% threshold distances for AI and AII were both close to 480 μm in the rostrocaudal extent. This was significantly shorter than the 900 μm in AI observed along dorsoventral dimension, but similar to the dorsoventral spread in AII (500 μm). The data strongly suggest that, along the rostrocaudal axis, the distribution pattern of DL cells in AIcNB and AII is similar, although AI is tonotopically organized, whereas AII is much less so. These findings demonstrate that AIcNB neurons receive fast-spiking inhibitory inputs in an anisotropic spatial manner, whereas inhibitory inputs to AII neurons appear to be isotropically distributed.
Figure 5.

Rostrocaudal laminar distribution of the DL cell convergence profiles. A, B, The rostrocaudal distribution of DL cell count with distance from the two representative sections shown in Figure 2, C and D. Data are from a series of coronal sections with 160 μm spacing. Cells from all layers but layer I are displayed; different layers are indicated by different combinations of color and marker style, and dashed lines indicate cell count 50% below maximum. C, D, The rostrocaudal distribution of DL cell count averaged across layers.
When considering long-distance projections in the rostrocaudal direction, 5.9% of DL cells in AI projected further than 1000 μm, versus 6.5% in AII. The comparison showed that there were more long-distance projecting DL cells in the rostrocaudal direction (5.9%) than in the dorsoventral direction (0.9%) in AI, but not in AII (6.5 vs 7.6%). The most distant DL cell along the rostrocaudal extent of AI was 2080 μm caudal to the injection site, and that in AII was found 2240 μm rostral.
Laminar distinctions in the distribution of parvalbumin-positive cells
We applied laminar-specific analysis to the population to examine the distribution pattern of DL and SL-G cells, since sensory processing follows a laminar organization (Atencio and Schreiner, 2010). In both AI and AII, the number of DL cells in layers III and V was significantly greater than in all other layers (p < 0.05, multiple comparison test).
As above, we used 50% of the maximum as threshold criterion. In both AI and AII, the number of DL and SL-G cells in all the layers except layer I declined with distance from the injection site (Fig, 3E–H). The number of DL cells in layers III and V was significantly greater than in all other layers (p < 0.05, multiple comparison test; see Materials and Methods). No significant difference was observed between layers III and V or between any of the other layers (Fig. 6A). In both areas, layer VI had the least DL cells. Layer III of AI had significantly more SL-G cells than layers II and IV, and layer IV had the least (Fig. 6B). In AII, the SL-G cell count in layer III was significantly greater than all other layers except layer V, and again, layer IV had the least SL-G cells. Generally, the variance of DL and SL-G cell count across layers in AI was similar to that in AII.
Figure 6.

Laminar mean and variance in SL-G- and DL- cell count in the dorsoventral direction. A, DL cells. Left, AI; right, AII. The number of DL cells in layers III and V of both AI and AII is significantly greater than in all other layers (*p < 0.05, multiple comparison test). B, SL-G cells. Left, AI; right AII. The number of SL-G cells in layers III and V of both AI and AII is also significantly greater than in all other layers (*p < 0.05, multiple comparison test).
Some retrograde labeling of Pv cells were found at >1000 μm from the injection site, and for convenience these are referred to as “distant” cells. In AI, only 0.7% of the DL cells were distant, whereas ∼8.0% were distant in AII (Fig. 7A). The latter percentage was similar to that of SL-G cells in AII, of which about 10.0% were distant. In AI, distant SL-G cells were significantly more abundant (27.0%; p < 0.05, multiple comparison test). The laminar distribution of distant DL cells also varied between areas. In AI, they were most abundant in layer V, but in AII they were mainly found in layers II–IV (Fig. 7B). The distant SL-G cells had a similar distribution in that they were also more abundant in layer V in AI and layers II–IV in AII. These results show layer-dependent differences in long-distance excitatory and inhibitory convergence between AI and AII.
Figure 7.
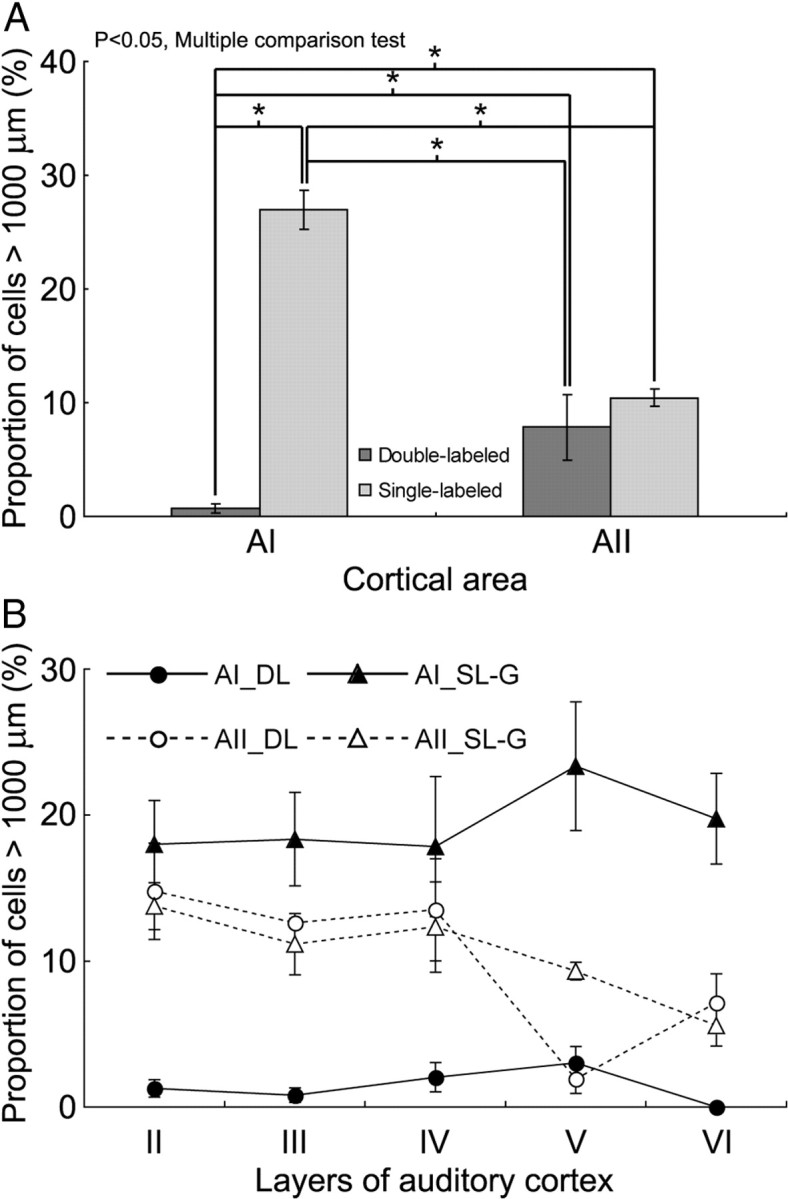
Long-distance projection profiles of SL-G and DL cells in the dorsoventral direction. A, Proportion of SL-G and DL cells >1000 μm from injection site. Light gray, SL-G cells; dark gray, DL cells. *p < 0.05, multiple comparison test. B, Laminar variance in the proportion of long-distance DL and SL-G projections (>1000 μm) in AI and AII.
To compare across AI and AII the relative inhibitory power provided by Pv+ cells as a function of distance from injection site, the proportion of DL cells relative to all labeled cells was calculated. In AI, the occurrence of DL cells along the dorsoventral dimension was confined to the range of 800 μm dorsal and ventral to the injection site, respectively (Fig. 3A; n = 3). Despite the continuous decline of the number of DL cells with distance, the proportion of DL to SL-G cells in all the layers was nearly constant within 800 μm, with a steep drop-off outside that range (Fig. 8A). Summed across all layers, the proportion of DL to SL-G cells remained constant through 800 μm (Fig. 8B). In AII, there was also a circumscribed region surrounding the injection site in which the proportion of DL cells was relatively constant, although this region was significantly narrower than in AI. As shown in Figure 8, A and B, this region was ±400 μm wide for all layers of the AII population. The averaged relative proportion of DL cells within the high-density region in AI (13.1 ± 0.7%) was significantly higher than in AII (9.8 ± 1.4%) (Fig. 8B). The data demonstrate that the spatial distribution of inhibitory power provided by Pv+ inhibitory cells is distinct for AIcNB and AII. When the proportion of DL cells was compared across layers, some variations were observed (Fig. 8C). In AI, the proportion of DL cells in layers III, IV, and V was similar (∼15%) and significantly higher than in layers II and VI (p < 0.05, multiple comparison test). However, layer III in AII exhibited a significantly greater proportion of DL cells than all the other layers (p < 0.05, multiple comparison test). In both AI and AII, the proportion of DL to SL-G cells in layer VI was the lowest, followed by layer II (p < 0.05, multiple comparison test). While the proportion of inhibition mediated by Pv+ cells is higher in AI than in AII, the overall variance of inhibitory power across layers is similar in AI and AII.
Figure 8.
The distribution of relative inhibitory contribution in dorsoventral projections. A, The distribution of the relative proportion of DL cells with distance from the injection site (0 μm) in different layers for the population average across three cats for AI and AII. Relative proportion of DL cells: DL cell count/(DL + SL-G cell count). B, Data averaged across layers for population (n = 3). C, Laminar variance in the relative proportion of DL cells. *p < 0.05, multiple comparison test.
Anatomical and physiological boundaries in AIcNB are closely aligned
The data analysis above shows that the spatial spread of DL cells in central AI was more limited than that of SL-G cells. The dorsoventral DL distribution was essentially confined to the central portion of AI, excluding dorsal and ventral regions of AI. Since the extent of the distribution of DL cells had relatively sharply defined borders, the question arises whether these projectional borders correlate with physiologically characterized borders between cNB and dorsal or ventral broadband regions (Fig. 1A, two white arrows in that mark the dorsal and ventral edge of the physiologically determined extent of cNB). To address this question, we measured the physiological boundaries of cNB along the isofrequency contour and the boundaries for the high-density inhibitory convergence region, within which the proportion of DL cells was relatively constant along layer IV, where most of the multiunit recordings were made and the physiological boundaries were defined.
For the individual AI case shown in Figure 1A, the most dorsal spread of Pv+ cells—a potential correlate of an anatomical cNB boundary—was 880 μm from the injection site, and the physiological Q40 boundary was at 790 μm, i.e., the location of these two measures were closely matched. Similarly, the boundaries for the ventral border were 1100 μm for the anatomy and 1150 μm for the physiology, again closely matched and suggestive of a close correspondence between anatomical and physiological organization. This is confirmed when assessing the relationship between the distance of the anatomical and physiological boundaries relative to the injection site for all three cases (Fig. 9). No significant difference between the location of the anatomical and physiological boundaries was observed across all cases (p > 0.05, paired t test). For the two cases in which the injection site was not equidistant from the dorsal and ventral physiological cNB borders, the anatomical boundaries showed a matching asymmetry. Accordingly, the differences in the distance between the injection site and the physiological cNB boundaries were highly correlated with the positions of the postulated anatomical boundaries defined as the extent of the converging DL population within the cNB region (r = 0.90; Fig. 9). This suggests that the narrow spectral tuning of cNB is supported by a spatially well-aligned network of Pv+ cells along the isofrequency domain. Additionally, the more broadly tuned regions, as assessed with multiunit responses (Schreiner et al., 2000), in dorsal (dBB) and ventral (vBB) AI do not appear to furnish fast-spiking inhibitory contributions to the cNB, indicating an anatomical tripartition of the AI isofrequency domain paralleling that derived from regional differences in functional properties (Schreiner et al., 2000; Read et al., 2001).
Figure 9.

Correlation between position of anatomical and physiological boundary in the AIcNB. Two of the three injections were not centered in the functionally identified AIcNB. Different cases are indicated by different colors. Filled dots, Dorsal boundary; open dots, ventral boundary.
Discussion
This investigation of the pattern of inhibitory networks in auditory cortex shows that functionally and hierarchically different areas in cat auditory cortex have different organizations of their parvalbumin-immunoreactive neurons, suggesting distinct functional consequences of local inhibitory networks. Furthermore, in AI, the distribution of Pv+ inhibitory connections is highly correlated with the extent of a physiologically definable region, the spectrally narrowly tuned cNB module. This establishes a correspondence of neuroanatomical and functional organization principles and supports the notion of three distinct processing modules in AI (Schreiner et al., 2000; Read et al., 2001).
In addition, we found that, in AII, Pv+ cells innervate excitatory cells over a more restricted spatial range. Furthermore, the density of Pv+ neurons in AII is lower than in AI; however, laminar differences in cell number and proportion are similar for AI and AII. Our findings suggest that the connection pattern of the inhibitory circuit is tailored to cooperate with excitatory circuits to enable specific local computations and to create functional modules. Even for the same type of cortical inhibitory neurons, the rules in which they are wired can vary within and across different cortical fields, sensory modality, and species. By revealing the organization principle of certain cortical circuits, the modeling of cortical function should become more realistic.
Inhibitory networks
Most cortical GABAergic interneurons do not project far and mainly function locally (Markram et al., 2004). In cat primary visual cortex (V1), inhibition provided by local inhibitory neurons balances excitation from local and distant excitatory neurons to generate invariant tuning of the spiking response, independent of location in the orientation preference map (Marino et al., 2005). In rat primary somatosensory cortex (S1), inhibitory neurons in most layers mainly innervate excitatory neurons in their home column, although some neurons in layer II/III influence activity in neighboring columns (Helmstaedter et al., 2009). Here we demonstrated that Pv+ inhibitory connections in cat AI are also local and coincide with the extent of functional groups with common spectral integration bandwidths. Thus, across different sensory cortices, the organization of fast-spiking inhibitory circuits appears functionally and organizationally specific.
Pv+ and fast-spiking GABAergic interneurons are closely associated (Kawaguchi and Kubota, 1993; Chow et al., 1999; Toledo-Rodriguez et al., 2004). Networks of FS cells generate large, synchronous inhibitory postsynaptic potentials in local excitatory neurons (Wang and Buzsaki, 1996; Hasenstaub et al., 2005). Cortical FS cells are most likely the only subtype of inhibitory interneurons receiving monosynaptic and strong excitation from the thalamus (Gibson et al., 1999). Retrogradely labeled Pv+ interneurons in AIcNB appear to share thalamic inputs with their targeting neurons around the tracer deposit track, as this region has been shown to receive different thalamic inputs than dorsal AI (Storace et al., 2011). They seem to form networks to shape spectral and temporal aspects of receptive fields via local modulation and to coordinate the activities of the excitatory network (Miller et al., 2001). Although neurons in dBB, cNB, and vBB of AI are organized within the same tonotopic layout, they exhibit notable differences in response properties, such as frequency tuning bandwidth, response threshold, and intensity preference (Schreiner et al., 2000). The present study provides evidence that one of these functionally distinguishable regions, cNB, has its own characteristic FS cell network that shapes its distinct physiological properties. We predict that the AI dBB and vBB regions, and other functionally distinguishable regions outside the AI, will exhibit their own inhibitory networks that are distinct from the cNB network.
AII is characterized by extremely broad frequency-intensity receptive field (Schreiner and Cynader, 1984) compared to those of AI, and it is believed that inhibitory interneurons play a role in shaping frequency tuning bandwidths (Metherate et al., 2005; Wu et al., 2008). We demonstrated that the number of Pv+ cells in AII is lower than in AI, but that their laminar proportions are similar in both fields, which is consistent with previous findings in the mouse (Cruikshank et al., 2001). This suggests that differences in spectral tuning bandwidth between the central AI and AII may not only be the consequence of thalamic input differences (Lee and Winer, 2008) but are also influenced by the differences in local distribution and the spatial extent of inhibitory interneurons. Which kind of information processing actually is enabled by these two different FS interneuronal networks in AI and AII requires further study.
Laminar properties
The majority of excitatory–inhibitory interactions occur within the same layer, although some translaminar inhibitory processes do exist (Katzel et al., 2011). The main inhibitory–excitatory types of interaction are similar between different sensory areas. The sources of horizontal inhibition between individual cells in V1 and S1 are usually located <550 μm from the target cell. In our tracer study, these distances are larger by a factor of 2 in the dorsoventral direction of AI. However, the radius of the local spread of the injection material may contribute to this difference. The convergence radius in second auditory cortex is more closely aligned with the single-cell data from V1 despite the fact that the injection size in AI and AII were similar.
In a morphology and distribution study of GABAergic neurons in AI, Prieto et al. (1994) showed significantly more GABAergic somata in layers III and IV in the central part of the AI, along the dorsoventral axis, where physiological studies report that the neurons are most sharply tuned (Schreiner and Mendelson, 1990). The current local projection study provides functionally verified evidence for a regional and laminar structural framework of the modular spectral integration organization of AI.
In visual and somatosensory cortex, lateral inhibition constrains the flow of information to columnar units in supragranular and infragranular layers, although columns in the granular layers are largely defined by the parcellation of the thalamocortical projections. In V1, the widest horizontal input is found in layers II/III and V, and the narrowest in layer IV (Katzel et al., 2011). In AI, our data indicate that the proportion of Pv+ long-distance projections (>1000 μm) is relatively high in layer V, whereas in AII, the proportion of long-distance projections is significantly higher in layers II, III, and IV. This laminar-specific difference between cortical fields may reflect difference in the composition of subtypes of Pv+ interneurons (Hasenstaub and Callaway, 2010) and establishes structural distinctions between AI and AII that likely contribute to different shaping of receptive field properties and their evolution within the laminar circuit. Furthermore, in V1, Pv+ cells receive strong and preferentially feedforward connections from thalamus and layer IV. As a consequence, they can provide a temporally precise control of spiking, likely providing fast and strong gain control (Ma et al., 2010). Similar properties in AI may help in generating precise response properties (Runyan et al., 2010) and maintaining sharpness of tuning of special relevance in the region of the narrowly frequency tuned AIcNB. The functional role of Pv+ interneurons in AII remains unclear at this time, in part due to the limited knowledge of AII functional properties.
Species differences
Some variations in the cellular and neural network architecture may exist across different species. In rat AI (Yuan et al., 2010), the extent of the high-density region of labeled Pv+ cells (∼90%) was ±500 μm, closely matching findings of a single unit channel–rhodopsin study in mice V1 and S1 (Katzel et al., 2011). By contrast, in cat AI, this range was ±900 μm, despite the use of nearly identical tracer volume in both studies. Cat AI showed an anisotropic distribution of Pv+ cells with a narrower range in the direction of the frequency gradient. In rat AI, the distribution of Pv+ cells was more isotropic, whereas the WAHG-only cells showed a wider convergence range along the frequency axis. Combined with the more isotropic pattern of Pv+ convergence in cat AII, this further supports the notion of physiological and neuroanatomical covariations in field organization.
Methodological considerations
Damage to the cortex caused by multiple electrode penetrations could interfere with the retrograde transportation of tracer. For this reason we kept our mapping density to a minimum. As a consequence, the dorsal narrow band (dNB) region that has been physiologically and anatomically characterized in cat AI (Schreiner and Mendelson, 1990; Read et al., 2001) was not identified in the present study, although it has not been consistently reported in more densely mapped animals. Anatomically, corticocortical connections between the dNB and cNB have been demonstrated (Read et al., 2001). In the current study, WAHG-labeled neurons were found dorsal of cNB, potentially reflecting connections with dNB. However, essentially no retrogradely labeled Pv+ cells have been observed dorsal of the cNB, suggesting that connectivity between the cNB and dorsal AI is restricted to Pv-negative neurons, likely corresponding to excitatory inputs. The probability that other subtypes of inhibitory interneurons, for example, somatostatin-positive interneurons, may project between the two narrow band modules still cannot be ruled out, since it has been shown that those interneurons tend to provide much longer distance projections than Pv+ neurons (Tomioka et al., 2005; Tomioka and Rockland, 2007).
Footnotes
This work was supported by NIDCD Grants R01DC02319 (J.A.W.) and R01DC2260 (C.E.S.). We thank Peter Ohara and Brian Malone for critical reading of this manuscript. We also thank Robert Froemke, Craig Atencio, Patrick Hullett, and Tom Babcock for comments and discussions; Katie Dorsch and David Larue for technical assistance; and Katie Fink, Heejae Kang, Weichen Xu, Ramy Salah, Johnny Kwon, Sawsan Dabilt, and Andy Noblet for assistance in data collection and analysis.
The authors declare no competing financial interests.
References
- Andermann ML, Ritt J, Neimark MA, Moore CI. Neural correlates of vibrissa resonance; band-pass and somatotopic representation of high-frequency stimuli. Neuron. 2004;42:451–463. doi: 10.1016/s0896-6273(04)00198-9. [DOI] [PubMed] [Google Scholar]
- Atencio CA, Schreiner CE. Spectrotemporal processing differences between auditory cortical fast-spiking and regular-spiking neurons. J Neurosci. 2008;28:3897–3910. doi: 10.1523/JNEUROSCI.5366-07.2008. [DOI] [PMC free article] [PubMed] [Google Scholar]
- Atencio CA, Schreiner CE. Laminar diversity of dynamic sound processing in cat primary auditory cortex. J Neurophysiol. 2010;103:192–205. doi: 10.1152/jn.00624.2009. [DOI] [PMC free article] [PubMed] [Google Scholar]
- Bartho P, Hirase H, Monconduit L, Zugaro M, Harris KD, Buzsaki G. Characterization of neocortical principal cells and interneurons by network interactions and extracellular features. J Neurophysiol. 2004;92:600–608. doi: 10.1152/jn.01170.2003. [DOI] [PubMed] [Google Scholar]
- Basbaum AI, Menetrey D. Wheat germ agglutinin-apoHRP gold: a new retrograde tracer for light- and electron-microscopic single- and double-label studies. J Comp Neurol. 1987;261:306–318. doi: 10.1002/cne.902610211. [DOI] [PubMed] [Google Scholar]
- Bruno RM, Simons DJ. Feedforward mechanisms of excitatory and inhibitory cortical receptive fields. J Neurosci. 2002;22:10966–10975. doi: 10.1523/JNEUROSCI.22-24-10966.2002. [DOI] [PMC free article] [PubMed] [Google Scholar]
- Buzsaki G, Eidelberg E. Commissural projection to the dentate gyrus of the rat: evidence for feed-forward inhibition. Brain Res. 1981;230:346–350. doi: 10.1016/0006-8993(81)90413-3. [DOI] [PubMed] [Google Scholar]
- Calford MB, Semple MN. Monaural inhibition in cat auditory cortex. J Neurophysiol. 1995;73:1876–1891. doi: 10.1152/jn.1995.73.5.1876. [DOI] [PubMed] [Google Scholar]
- Chow A, Erisir A, Farb C, Nadal MS, Ozaita A, Lau D, Welker E, Rudy B. K(+) channel expression distinguishes subpopulations of parvalbumin- and somatostatin-containing neocortical interneurons. J Neurosci. 1999;19:9332–9345. doi: 10.1523/JNEUROSCI.19-21-09332.1999. [DOI] [PMC free article] [PubMed] [Google Scholar]
- Cruikshank SJ, Killackey HP, Metherate R. Parvalbumin and calbindin are differentially distributed within primary and secondary subregions of the mouse auditory forebrain. Neuroscience. 2001;105:553–569. doi: 10.1016/s0306-4522(01)00226-3. [DOI] [PubMed] [Google Scholar]
- DeFelipe J. Types of neurons, synaptic connections and chemical characteristics of cells immunoreactive for calbindin-D28K, parvalbumin and calretinin in the neocortex. J Chem Neuroanat. 1997;14:1–19. doi: 10.1016/s0891-0618(97)10013-8. [DOI] [PubMed] [Google Scholar]
- DeFelipe J, Gonzalez-Albo MC, Del Rio MR, Elston GN. Distribution and patterns of connectivity of interneurons containing calbindin, calretinin, and parvalbumin in visual areas of the occipital and temporal lobes of the macaque monkey. J Comp Neurol. 1999;412:515–526. doi: 10.1002/(sici)1096-9861(19990927)412:3<515::aid-cne10>3.0.co;2-1. [DOI] [PubMed] [Google Scholar]
- Freund TF, Katona I. Perisomatic inhibition. Neuron. 2007;56:33–42. doi: 10.1016/j.neuron.2007.09.012. [DOI] [PubMed] [Google Scholar]
- Gibson JR, Beierlein M, Connors BW. Two networks of electrically coupled inhibitory neurons in neocortex. Nature. 1999;402:75–79. doi: 10.1038/47035. [DOI] [PubMed] [Google Scholar]
- Gilbert CD. Circuitry, architecture, and functional dynamics of visual cortex. Cereb Cortex. 1993;3:373–386. doi: 10.1093/cercor/3.5.373. [DOI] [PubMed] [Google Scholar]
- Hasenstaub AR, Callaway EM. Paint it black (or red, or green): optical and genetic tools illuminate inhibitory contributions to cortical circuit function. Neuron. 2010;67:681–684. doi: 10.1016/j.neuron.2010.08.039. [DOI] [PubMed] [Google Scholar]
- Hasenstaub A, Shu Y, Haider B, Kraushaar U, Duque A, McCormick DA. Inhibitory postsynaptic potentials carry synchronized frequency information in active cortical networks. Neuron. 2005;47:423–435. doi: 10.1016/j.neuron.2005.06.016. [DOI] [PubMed] [Google Scholar]
- Helmstaedter M, Sakmann B, Feldmeyer D. Neuronal correlates of local, lateral, and translaminar inhibition with reference to cortical columns. Cereb Cortex. 2009;19:926–937. doi: 10.1093/cercor/bhn141. [DOI] [PubMed] [Google Scholar]
- Jonas P, Bischofberger J, Fricker D, Miles R. Interneuron diversity series: fast in, fast out—temporal and spatial signal processing in hippocampal interneurons. Trends Neurosci. 2004;27:30–40. doi: 10.1016/j.tins.2003.10.010. [DOI] [PubMed] [Google Scholar]
- Katzel D, Zemelman BV, Buetfering C, Wolfel M, Miesenbock G. The columnar and laminar organization of inhibitory connections to neocortical excitatory cells. Nat Neurosci. 2011;14:100–107. doi: 10.1038/nn.2687. [DOI] [PMC free article] [PubMed] [Google Scholar]
- Kawaguchi Y, Kubota Y. Correlation of physiological subgroupings of nonpyramidal cells with parvalbumin- and calbindinD28k-immunoreactive neurons in layer V of rat frontal cortex. J Neurophysiol. 1993;70:387–396. doi: 10.1152/jn.1993.70.1.387. [DOI] [PubMed] [Google Scholar]
- Kisvarday ZF, Beaulieu C, Eysel UT. Network of GABAergic large basket cells in cat visual cortex (area 18): implication for lateral disinhibition. J Comp Neurol. 1993;327:398–415. doi: 10.1002/cne.903270307. [DOI] [PubMed] [Google Scholar]
- Kisvarday ZF, Kim DS, Eysel UT, Bonhoeffer T. Relationship between lateral inhibitory connections and the topography of the orientation map in cat visual cortex. Eur J Neurosci. 1994;6:1619–1632. doi: 10.1111/j.1460-9568.1994.tb00553.x. [DOI] [PubMed] [Google Scholar]
- Lee CC, Winer JA. Connections of cat auditory cortex: III. Corticocortical system. J Comp Neurol. 2008;507:1920–1943. doi: 10.1002/cne.21613. [DOI] [PMC free article] [PubMed] [Google Scholar]
- Ma WP, Liu BH, Li YT, Huang ZJ, Zhang LI, Tao HW. Visual representations by cortical somatostatin inhibitory neurons–selective but with weak and delayed responses. J Neurosci. 2010;30:14371–14379. doi: 10.1523/JNEUROSCI.3248-10.2010. [DOI] [PMC free article] [PubMed] [Google Scholar]
- Marino J, Schummers J, Lyon DC, Schwabe L, Beck O, Wiesing P, Obermayer K, Sur M. Invariant computations in local cortical networks with balanced excitation and inhibition. Nat Neurosci. 2005;8:194–201. doi: 10.1038/nn1391. [DOI] [PubMed] [Google Scholar]
- Markram H, Toledo-Rodriguez M, Wang Y, Gupta A, Silberberg G, Wu C. Interneurons of the neocortical inhibitory system. Nat Rev Neurosci. 2004;5:793–807. doi: 10.1038/nrn1519. [DOI] [PubMed] [Google Scholar]
- McBain CJ, Fisahn A. Interneurons unbound. Nat Rev Neurosci. 2001;2:11–23. doi: 10.1038/35049047. [DOI] [PubMed] [Google Scholar]
- McCormick DA, Connors BW, Lighthall JW, Prince DA. Comparative electrophysiology of pyramidal and sparsely spiny stellate neurons of the neocortex. J Neurophysiol. 1985;54:782–806. doi: 10.1152/jn.1985.54.4.782. [DOI] [PubMed] [Google Scholar]
- Metherate R, Kaur S, Kawai H, Lazar R, Liang K, Rose HJ. Spectral integration in auditory cortex: mechanisms and modulation. Hear Res. 2005;206:146–158. doi: 10.1016/j.heares.2005.01.014. [DOI] [PubMed] [Google Scholar]
- Miller LM, Escabi MA, Read HL, Schreiner CE. Functional convergence of response properties in the auditory thalamocortical system. Neuron. 2001;32:151–160. doi: 10.1016/s0896-6273(01)00445-7. [DOI] [PubMed] [Google Scholar]
- Oswald AM, Schiff ML, Reyes AD. Synaptic mechanisms underlying auditory processing. Curr Opin Neurobiol. 2006;16:371–376. doi: 10.1016/j.conb.2006.06.015. [DOI] [PubMed] [Google Scholar]
- Pandya PK, Rathbun DL, Moucha R, Engineer ND, Kilgard MP. Spectral and temporal processing in rat posterior auditory cortex. Cereb Cortex. 2008;18:301–314. doi: 10.1093/cercor/bhm055. [DOI] [PMC free article] [PubMed] [Google Scholar]
- Pouille F, Scanziani M. Enforcement of temporal fidelity in pyramidal cells by somatic feed-forward inhibition. Science. 2001;293:1159–1163. doi: 10.1126/science.1060342. [DOI] [PubMed] [Google Scholar]
- Pouille F, Scanziani M. Routing of spike series by dynamic circuits in the hippocampus. Nature. 2004;429:717–723. doi: 10.1038/nature02615. [DOI] [PubMed] [Google Scholar]
- Prieto JJ, Peterson BA, Winer JA. Morphology and spatial distribution of GABAergic neurons in cat primary auditory cortex (AI) J Comp Neurol. 1994;344:349–382. doi: 10.1002/cne.903440304. [DOI] [PubMed] [Google Scholar]
- Read HL, Winer JA, Schreiner CE. Modular organization of intrinsic connections associated with spectral tuning in cat auditory cortex. Proc Natl Acad Sci U S A. 2001;98:8042–8047. doi: 10.1073/pnas.131591898. [DOI] [PMC free article] [PubMed] [Google Scholar]
- Read HL, Nauen DW, Escabi MA, Miller LM, Schreiner CE, Winer JA. Distinct core thalamocortical pathways to central and dorsal primary auditory cortex. Hear Res. 2011;274:95–104. doi: 10.1016/j.heares.2010.11.010. [DOI] [PMC free article] [PubMed] [Google Scholar]
- Rouiller EM, Simm GM, Villa AE, de Ribaupierre Y, de Ribaupierre F. Auditory corticocortical interconnections in the cat: evidence for parallel and hierarchical arrangement of the auditory cortical areas. Exp Brain Res. 1991;86:483–505. doi: 10.1007/BF00230523. [DOI] [PubMed] [Google Scholar]
- Runyan CA, Schummers J, Van Wart A, Kuhlman SJ, Wilson NR, Huang ZJ, Sur M. Response features of parvalbumin-expressing interneurons suggest precise roles for subtypes of inhibition in visual cortex. Neuron. 2010;67:847–857. doi: 10.1016/j.neuron.2010.08.006. [DOI] [PMC free article] [PubMed] [Google Scholar]
- Schreiner CE, Cynader MS. Basic functional organization of second auditory cortical field (AII) of the cat. J Neurophysiol. 1984;51:1284–1305. doi: 10.1152/jn.1984.51.6.1284. [DOI] [PubMed] [Google Scholar]
- Schreiner CE, Mendelson JR. Functional topography of cat primary auditory cortex: distribution of integrated excitation. J Neurophysiol. 1990;64:1442–1459. doi: 10.1152/jn.1990.64.5.1442. [DOI] [PubMed] [Google Scholar]
- Schreiner CE, Sutter ML. Topography of excitatory bandwidth in cat primary auditory cortex: single-neuron versus multiple-neuron recordings. J Neurophysiol. 1992;68:1487–1502. doi: 10.1152/jn.1992.68.5.1487. [DOI] [PubMed] [Google Scholar]
- Schreiner CE, Read HL, Sutter ML. Modular organization of frequency integration in primary auditory cortex. Annu Rev Neurosci. 2000;23:501–529. doi: 10.1146/annurev.neuro.23.1.501. [DOI] [PubMed] [Google Scholar]
- Shamma SA, Symmes D. Patterns of inhibition in auditory cortical cells in awake squirrel monkeys. Hear Res. 1985;19:1–13. doi: 10.1016/0378-5955(85)90094-2. [DOI] [PubMed] [Google Scholar]
- Storace DA, Higgins NC, Read HL. Thalamocortical pathway specialization for sound frequency resolution. J Comp Neurol. 2011;519:177–193. doi: 10.1002/cne.22501. [DOI] [PubMed] [Google Scholar]
- Suga N, Manabe T. Neural basis of amplitude-spectrum representation in auditory cortex of the mustached bat. J Neurophysiol. 1982;47:225–255. doi: 10.1152/jn.1982.47.2.225. [DOI] [PubMed] [Google Scholar]
- Sutter ML, Loftus WC. Excitatory and inhibitory intensity tuning in auditory cortex: evidence for multiple inhibitory mechanisms. J Neurophysiol. 2003;90:2629–2647. doi: 10.1152/jn.00722.2002. [DOI] [PubMed] [Google Scholar]
- Sutter ML, Schreiner CE, McLean M, O'Connor KN, Loftus WC. Organization of inhibitory frequency receptive fields in cat primary auditory cortex. J Neurophysiol. 1999;82:2358–2371. doi: 10.1152/jn.1999.82.5.2358. [DOI] [PubMed] [Google Scholar]
- Tamamaki N, Yanagawa Y, Tomioka R, Miyazaki J, Obata K, Kaneko T. Green fluorescent protein expression and colocalization with calretinin, parvalbumin, and somatostatin in the GAD67-GFP knock-in mouse. J Comp Neurol. 2003;467:60–79. doi: 10.1002/cne.10905. [DOI] [PubMed] [Google Scholar]
- Tan AY, Atencio CA, Polley DB, Merzenich MM, Schreiner CE. Unbalanced synaptic inhibition can create intensity-tuned auditory cortex neurons. Neuroscience. 2007;146:449–462. doi: 10.1016/j.neuroscience.2007.01.019. [DOI] [PubMed] [Google Scholar]
- Toledo-Rodriguez M, Blumenfeld B, Wu C, Luo J, Attali B, Goodman P, Markram H. Correlation maps allow neuronal electrical properties to be predicted from single-cell gene expression profiles in rat neocortex. Cereb Cortex. 2004;14:1310–1327. doi: 10.1093/cercor/bhh092. [DOI] [PubMed] [Google Scholar]
- Tomioka R, Rockland KS. Long-distance corticocortical GABAergic neurons in the adult monkey white and gray matter. J Comp Neurol. 2007;505:526–538. doi: 10.1002/cne.21504. [DOI] [PubMed] [Google Scholar]
- Tomioka R, Okamoto K, Furuta T, Fujiyama F, Iwasato T, Yanagawa Y, Obata K, Kaneko T, Tamamaki N. Demonstration of long-range GABAergic connections distributed throughout the mouse neocortex. Eur J Neurosci. 2005;21:1587–1600. doi: 10.1111/j.1460-9568.2005.03989.x. [DOI] [PubMed] [Google Scholar]
- Wang XJ, Buzsaki G. Gamma oscillation by synaptic inhibition in a hippocampal interneuronal network model. J Neurosci. 1996;16:6402–6413. doi: 10.1523/JNEUROSCI.16-20-06402.1996. [DOI] [PMC free article] [PubMed] [Google Scholar]
- Wehr M, Zador AM. Balanced inhibition underlies tuning and sharpens spike timing in auditory cortex. Nature. 2003;426:442–446. doi: 10.1038/nature02116. [DOI] [PubMed] [Google Scholar]
- Wu GK, Li P, Tao HW, Zhang LI. Nonmonotonic synaptic excitation and imbalanced inhibition underlying cortical intensity tuning. Neuron. 2006;52:705–715. doi: 10.1016/j.neuron.2006.10.009. [DOI] [PMC free article] [PubMed] [Google Scholar]
- Wu GK, Arbuckle R, Liu BH, Tao HW, Zhang LI. Lateral sharpening of cortical frequency tuning by approximately balanced inhibition. Neuron. 2008;58:132–143. doi: 10.1016/j.neuron.2008.01.035. [DOI] [PMC free article] [PubMed] [Google Scholar]
- Yuan K, Fink KL, Winer JA, Schreiner CE. Local connection patterns of parvalbumin-positive inhibitory interneurons in rat primary auditory cortex. Hear Res. 2010;274:121–128. doi: 10.1016/j.heares.2010.06.014. [DOI] [PMC free article] [PubMed] [Google Scholar]
- Zhang LI, Tan AY, Schreiner CE, Merzenich MM. Topography and synaptic shaping of direction selectivity in primary auditory cortex. Nature. 2003;424:201–205. doi: 10.1038/nature01796. [DOI] [PubMed] [Google Scholar]