Abstract
The synthesis of polyaniline (PANI) nanospheres by a simple template-free method has been described. The polymerization of aniline in aqueous medium was accomplished using ammonium persulfate without any protonic acid. The UV-vis spectrum of PANI nanospheres displayed the characteristic absorption peak of π-π* transition of the benzenoid ring at 355 nm. The oxidation state of PANI nanospheres was identified with FT-IR spectroscopy by comparing the two bands at 1582 (ring stretching in quinoid unit) and 1498 cm−1 (ring stretching in bezenoid unit). The X-ray diffraction patterns demonstrated the low crystalline nature of PANI nanospheres. The morphology of PANI nanospheres was spherical and the mean diameter of nanospheres was found in the range of 3-12 nm. The thermal behavior of PANI nanospheres was studied by thermogravimetric analysis. The effect of doping of HCl and H2SO4 on PANI nanospheres was studied by measuring the current as a function of time of exposure. The high electrical conductivity of 6×10⁻² S cm−1 was obtained for PANI nanospheres at their optimum doping state by 100 ppm HCl.
Keywords: polyaniline; nanospheres; electrical conductivity, effect of doping; polymerization
INTRODUCTION
Polyaniline (PANI) is one of the most promising conducting polymers with enhanced conductivity, good environmental stability, easy control of doping level and conductivity, and diverse color changes corresponding to oxidation levels.1–4 In recent years, PANI nanostructures, including nanospheres, wires, rods, and tubes have been studied with the expectation that such materials will possess the advantages of both low-dimensional systems and organic conductors. These PANI nanostructures are promising candidates for the development of electronic devices, especially sensors.5–9 The high surface areas of the PANI nanostructures make them more responsive than bulk PANI to gases,10,11 an extremely desirable property for sensing applications.
Syntheses of PANI nanostructures have been achieved by chemical and electrochemical polymerization of monomer with the aid of either a ‘soft template’ or a ‘hard template’ method. ‘Soft template’ method includes emulsion,12,13 micro-emulsion,14,15 diffusion polymerization,16 and interfacial polymerization, which can be regarded as an efficient method for preparing PANI nanostructures.17 Though a number of methods are known for the synthesis of PANI nanostructures in aqueous medium without use of any acid,18–20 synthesis of PANI nanospheres is a challenging task mainly because the nanospherical morphology appears to be intrinsic to PANI while synthesized in aqueous medium.21 Unlike that of other PANI nanostructures, the use of PANI nanospheres is restricted due to this synthetic limitation and because most of the properties of the nanospheres are not completely understood. The nanospheres are particularly interesting for opto-electronics and sensors because of their large surface area compared to that of the nanofibers. It is also important to note that the nanospheres can be effectively solvated due to their globular nature, which enhances the solubility in common solvents for structural characterization by spectroscopic techniques.22 There are very few examples reported for the synthesis of PANI nanospheres, which includes use of templates such as polystyrene spheres,23 hydroxy alkyl cellulose24 and salicylic acid assisted polymerization,25 etc. Despite the variety of current synthetic approaches to PANI nanospheres, there is a need for a practical synthetic method capable of making pure, uniform, and template-free PANI nanospheres with small diameters (sub-10 nm) in bulk quantities. Such a synthetic method should prove useful for properties dependent on ultra-small, low-dimensional structures, such as sensors.
Herein, we report a facile one-pot synthesis of PANI nanospheres by chemical oxidation polymerization of aniline in aqueous medium without use of any templates and/or protonic acid in the beginning of polymerization. The structure of PANI nanospheres was characterized by X-ray diffraction (XRD) and UV-vis, FTIR and NMR spectroscopy. The morphology of PANI nanospheres was analyzed by transmission electron microscopy (TEM) and the thermal behavior of PANI nanospheres was studied by thermogravimetric analysis (TGA). The effect of doping of HCl and H2SO4 was studied by measuring the variation of current (I) as a function of time of exposure.
EXPERIMENTAL
Materials
The monomer, aniline was purchased from Aldrich and distilled under reduced pressure prior to use. The analytical grade ammonium persulfate was purchased from Aldrich and used without further purification.
Synthesis of PANI Nanospheres
In a typical synthesis, aniline (0.65 g, 7 mmol) was mixed with 20 mL DI water under magnetic stirring at room temperature for 10 min. After that, the mixture was maintained at 0–5 °C for 30 min before oxidative polymerization. The aqueous solution of ammonium persulfate (1.6g, 7 mmol) was then added to above mixture in one portion. The resulting solution was stirred for another half min to ensure complete mixing, and then the reaction was allowed to proceed under static condition for 12 h at 0–5 °C. The product thus resulted was washed with deionized water and dried under vacuum at 50 °C for 12 h.
Characterization
The NMR spectrum of PANI nanospheres was recorded using a 300 MHz Brucker NMR spectrometer and the IR spectrum was recorded with a Thermo-Nicolet IR 2000 FTIR spectrometer. The UV-vis spectrum of PANI nanospheres in DMSO was recorded by a Varian Cary 50 Bio UV-vis spectrophotometer. The TEM images were recorded using a Hitachi H-8100 microscope at 200 kV. For TEM measurements, the DMSO dispersion of the nanospheres was prepared under ultrasonic and deposited on a carbon coated copper grid. The powder X-ray diffraction pattern of the nanospheres was recorded by a Scintag X-ray diffractometer, model PAD X using Cu Kα emission. The TGA analysis of the PANI nanospheres was performed on a Perkin Elmer Diamond TG/DTA instrument at a heating rate of 10 °C/min from 25 to 800 °C under flowing nitrogen.
Electrical Measurements
The electrical measurements were performed with a two-electrode scheme using the Keithley 2400 multimeter. For the two-electrode scheme of measurement, a pair of silver electrodes with a gap of 200 μm between them was deposited on a glass substrate by vacuum thermal evaporation.26 The 5 wt% dispersion of PANI nanospheres in DMSO was cast on top of the electrode structure and dried well before initiating the measurement. The effect of doping was studied by exposing PANI nanospheres films to 100 and 200 ppm HCl and 200 ppm H2SO4 in a testing chamber of 1 liter volume. The required quantity of HCl and H2SO4 analytes were introduced into the airtight testing chamber using a graduated micro syringe. Then the variation of current (I) at a constant applied voltage (V) was measured as a function of time.
The electrical conductivity of PANI nanospheres at different time of exposure to 100 ppm HCl was evaluated by σ = LI/VA, where L is the distance of the silver electrodes, I the measured current, V the applied potential difference and A the cross-sectional area of the sample. The cross-sectional area was calculated as the film thickness multiplied by the width of the film. The thickness and width of the film was measured using atomic force microscope (AFM) in accordance with a method reported earlier.27,28
RESULTS AND DISCUSSION
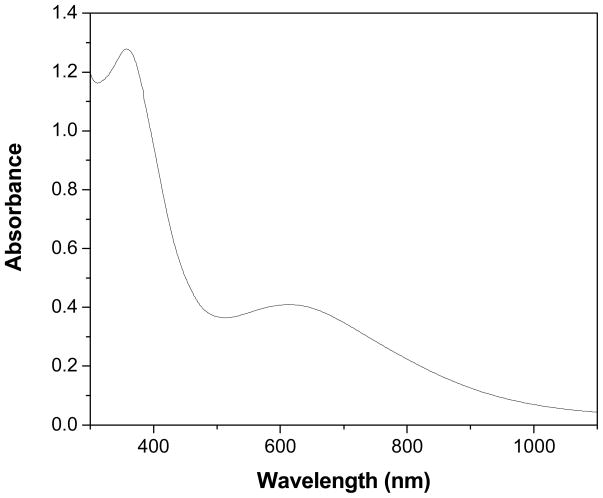
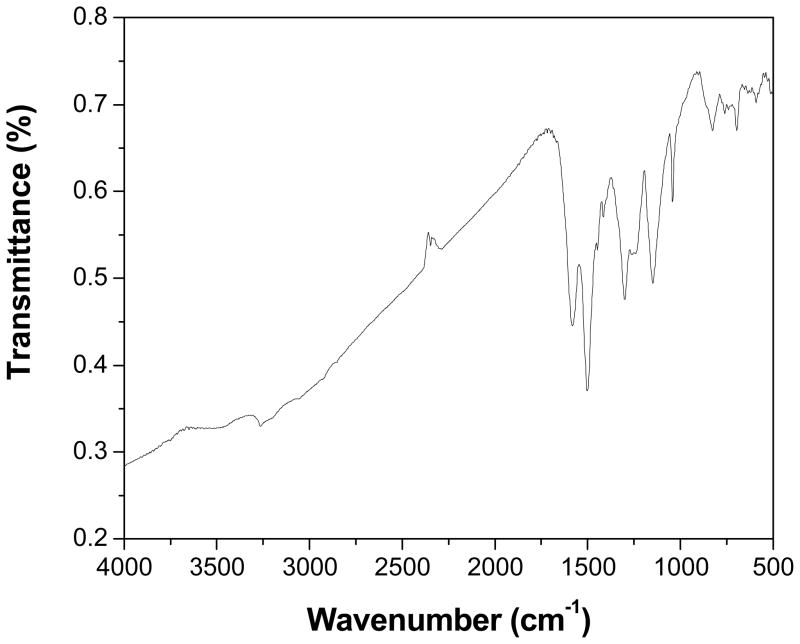
The UV-vis absorption spectrum of PANI nanospheres dispersed in DMSO displayed two distinct absorption bands located at 355 and 615 nm (Fig. 1). The band at 355 nm is ascribed to π-π* transition of the benzenoid ring, it is related to extended conjugation between adjacent rings in the polymeric chains and the other band at 615 nm is associated with the transition of benzenoid rings into quinoid rings.29 These observations are consistent with literature reports of PANI. The FTIR was employed to characterize the chemical structure of PANI nanospheres. Fig. 2 displays the FTIR spectrum of PANI nanospheres in KBr. The appearance of bands at 1498 and 1582 cm-1 correspond to C-C stretching vibrations of benzenoid and quinoid rings, respectively. The bands at 1300 and 696 cm−1 can be assigned to C-N stretching of the secondary aromatic amine and aromatic C-H out-of-plane bending vibrations, respectively. The broad band in the range of 3200-3500 cm−1 corresponds to stretching (N-H) vibrations of secondary amine. The bands at 3450 cm−1 and 3264 cm−1 are originated from the free and hydrogen bonded N-H, respectively.30 The decreased intensity of the band at 3450 cm−1 was ascribed to secondary amine stretching (N-H) vibrations in case of nanosphers may be due to a decrease in the number of hydrogen atoms connected to N2 atoms in the PANI.31 The bands at 1148 and 826 cm−1 are due to aromatic C-H in-plane bending and the out-of-plane deformation of C-H in the 1,4-disubstituted benzene ring, respectively.32 The bands at 1041 and 696 cm−1 are related to the S=O and S-O stretching vibration modes of the sulfonate groups attached to the aromatic rings.33,34 Thus the FTIR spectrum of synthesized nanospheres is in good agreement with the earlier reports on PANI.30–34
Figure 1.
UV-vis spectrum of PANI nanospheres.
Figure 2.
FTIR spectrum of PANI nanospheres in KBr.
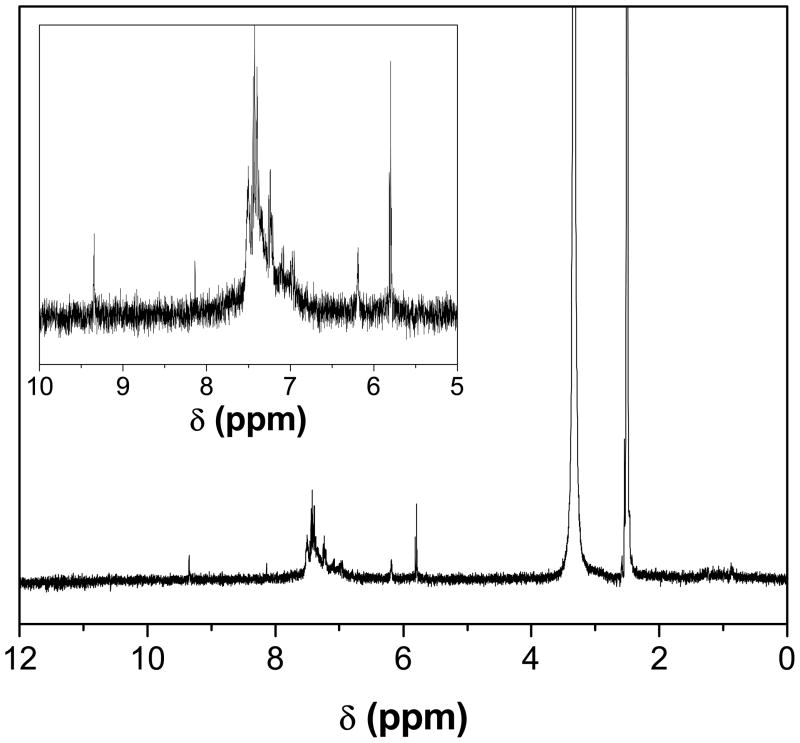
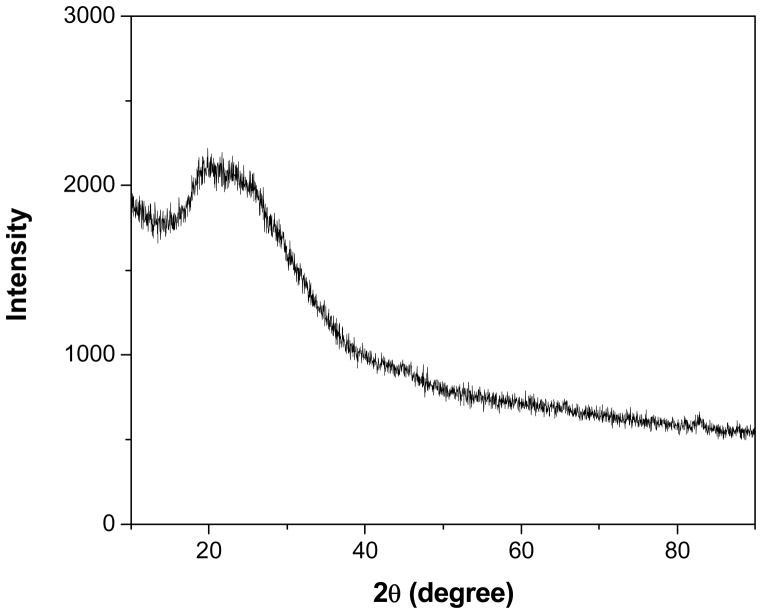
Fig. 3 shows the 1H NMR spectrum of the PANI nanosphere in DMSO-d6. The protons present in -CH3 group of DMSO appeared at 2.5δ and the peak appeared at 3.3δ was due to residual water present in the sample. Two signals present at 5.8 and 9.3δ arise from the >NH proton and hydrogen bonded -OH group, respectively. The peak at 6.2δ and the splitting peaks around 7.2 and 7.4δ are assigned to aromatic protons of PANI, since the chemical shift for the aromatic protons of the aniline monomer is in a range of 6.0δ to 7.4δ.35 The signals from aromatic protons are clearly visible in the inset of Fig. 3. The XRD pattern of PANI nanospheres is shown in Fig. 4. The broad peak centered at 2θ value of 22° is ascribed to the periodicity parallel to the polymer chains of PANI.36 The XRD pattern demonstrates the low crystalline nature of the nanospheres. The low crystallinity of PANI nanospheres is interpreted due to the low acidity of reaction medium.
Figure 3.
1H NMR spectrum of PANI nanospheres in DMSO-d6.
Figure 4.
Powder XRD pattern of PANI nanospheres.
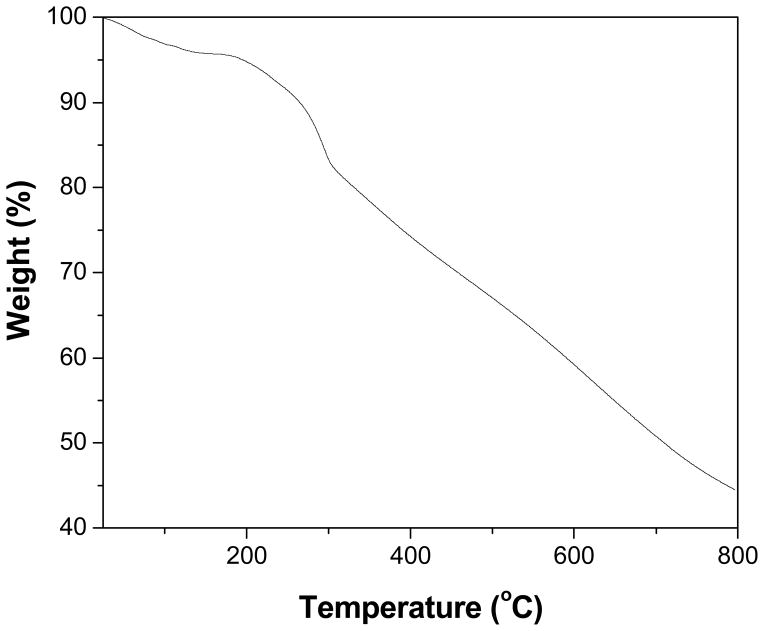
The morphology of the PANI nanospheres was characterized by TEM analysis. The TEM images (Fig. 5) clearly display that the nanospheres are solid and spherical in shape. The nanospheres have a fairly narrow distribution and the diameter of nanospheres varies from 3–12 nm. The average particle size of PANI nanospheres was found to be 8±3 nm. In all the images it was found that each nanosphere is well separated without any aggregation. Interestingly, it can be found from higher magnification (Fig. 5c) that the surface of nanosphers is perfectly smooth. The thermal behavior of PANI nanospheres was studied by TGA analysis. In the TGA profile of PANI nanospheres (Fig. 6) three major weight loss steps were observed. The first weight loss (≈5 %) below 150 °C is attributed to loss of adsorbed water and the second weight loss begin around 160 °C was likely due to loss of unreacted monomer.37 Finally, the third weight loss onset around 310 °C indicates the structural decomposition of PANI. The gradual weight loss over the wide temperature range could be attributed to good thermal stability of the PANI nanospheres.
Figure 5.
TEM images of PANI nanospheres.
Figure 6.
TGA thermogram of PANI nanospheres.
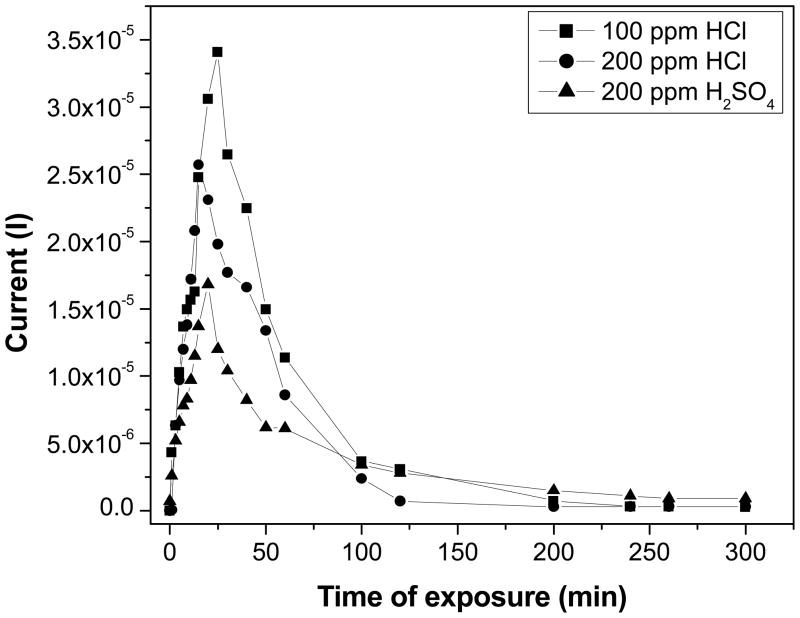
Fig. 7 depicts the measured current-time characteristic of PANI nanospheres films cast on silver electrodes towards HCl and H2SO4 gas sensing. The variation in current (I) by exposing to HCl and H2SO4 vapors was measured as a function of time up to 5 hrs at room temperature. Initially, the current shown by PANI nanospheres film before introducing the acid vapors was measured in air. Then the required quantity of HCl and H2SO4 vapors were injected in the gas chamber, which results to increase in the measured current. By exposing PANI nanospheres film to 100 ppm HCl, the measured current was rapidly increased below 25 min of exposure and it suddenly dropped with further exposure. This experiment was repeated by replacing the silver electrodes with gold electrodes to verify the observed decrease in the current after reaching to its maximum was not due to corrosion of silver electrode by exposure to HCl, similar kind of behavior was observed with gold electrodes also. In the similar manner, an identical tendency of initial increase in current and a drop with further exposure was observed with 200 ppm HCl and 200 ppm H2SO4. Thus, the optimum time of exposure and appropriate concentration of acid provides better electrical conductivity to PANI nanospheres. The optimum time of exposure found for 100 and 200 ppm HCl was 25 and 15 mins, respectively and for 200 ppm H2SO4 it was 20 mins. The initial increase in measured current was attributed to maximum doping of PANI nanospheres by acid. Then the following decrease in current was owing to excess protonation of amine nitrogens by acid, which reduces the conductivity of PANI nanospheres due to retardation of charge transfer along the PANI chains.38,39
Figure 7.
Variation in current as a function of time by exposing PANI nanospheres films to HCl and H2SO4 vapors.
The electrical conductivity of PANI nanospheres while exposed to 100 ppm HCl was calculated from current-voltage characteristics recorded using the two-electrode scheme in the plane of the substrate.40 The initial conductivity of PANI nanospheres before exposing to 100 ppm HCl was 1×10⁻⁶ S cm−1, which enhanced to 6x10⁻² S cm−1 at 25 mins of exposure and it reduced to 6x10⁻⁴ S cm−1 at their 5 hrs of exposure. The observed variation in conductivity with time of exposure supports the fact that the conductivity of PANI and its related systems can be significantly improved by the application of appropriate type and concentration of dopant.41
CONCLUSIONS
In summary, the synthesis of spherical PANI nanospheres in aqueous medium has been successfully achieved through a facile approach. The polymerization was carried out by a onestep process without any additional doping agent or doping process. This approach is an easy, inexpensive, and scalable single-step method to produce uniform PANI nanospheres with controllable size in bulk quantities. The spherical morphology of PANI nanospheres was studied by TEM analysis and the molecular structure was analyzed by XRD, FTIR, NMR and UV-vis spectroscopic techniques. The electrical conductivity of the PANI nanospheres was significantly enhanced by optimum doping of acid. Due to nanosize, high surface area and reasonable conductivity, these PANI nanospheres may have potential application as chemical sensors or actuators, gas-separation membranes and neuron devices. Because of the versatility of the demonstrated method in producing PANI nanospheres, we anticipate that nanospheres of PANI derivatives and other conducting polymers could be synthesized in a similar fashion.
Acknowledgments
The authors acknowledge the support from NIH-NIGMS grant #1SC3GM086245, NIH-NIGMS RISE grant #1R25GM078361 and the Welch foundation.
References
- 1.Jang J. Adv Polym Sci. 2006;199:189–259. [Google Scholar]
- 2.Jang J, Bae J. Adv Funct Mater. 2005;15:1877–1882. [Google Scholar]
- 3.Zujovic ZD, Laslau C, Bowmaker GA, Kilmartin PA, Webber AL, Brown SP, Travas-Sejdic J. Macromolecules. 2010;43:662–670. [Google Scholar]
- 4.Varela-Alvarez A, Sordo JA, Scuseria GE. J Am Chem Soc. 2005;127:11318. doi: 10.1021/ja051012t. [DOI] [PubMed] [Google Scholar]
- 5.Gangopadhyay R, De A. Chem Mater. 2000;12:608–622. [Google Scholar]
- 6.Zhou Y, Freitag M, Hone JC, Johnson AT, Pinto NJ, MacDiarmid AG. Appl Phys Lett. 2003;83:3800–3802. [Google Scholar]
- 7.Kanungo M, Kumar A, Contractor AQ. Anal Chem. 2003;75:5673–56769. doi: 10.1021/ac034537h. [DOI] [PubMed] [Google Scholar]
- 8.Nicolas-Debarnot D, Poncin-Epaillard F. Anal Chim Acta. 2003;475:1–15. [Google Scholar]
- 9.Shoji E, Freund MS. J Am Chem Soc. 2001;123:3383–3384. doi: 10.1021/ja005906j. [DOI] [PubMed] [Google Scholar]
- 10.Virji S, Huang J, Kaner RB, Weiller BH. Nano Lett. 2004;4:491–496. [Google Scholar]
- 11.Zhang X, Goux WJ, Manohar SK. J Am Chem Soc. 2004;126:4502–4503. doi: 10.1021/ja031867a. [DOI] [PubMed] [Google Scholar]
- 12.Li XG, Zhou HJ, Huang MR. Polymer. 2005;46:1523–1533. [Google Scholar]
- 13.Anilkumar P, Jayakannan M. Langmuir. 2006;22:5952–5957. doi: 10.1021/la060173n. [DOI] [PubMed] [Google Scholar]
- 14.Huang K, Meng XH, Wan MX. J Appl Polym Sci. 2006;100:3050–3054. [Google Scholar]
- 15.Li G, Yan S, Zhou E, Chen Y. Colloids Surf A. 2006;276:40–44. [Google Scholar]
- 16.Park SJ, Park SY, Cho AS, Choi HJ, Jhon MS. Synth Met. 2005;152:337–340. [Google Scholar]
- 17.Sarma TK, Chattopadhyay A. J Phys Chem A. 2004;108:7837–7842. [Google Scholar]
- 18.Zhu Y, He H, Wan M, Jiang L. Macromol Rapid Commun. 2008;29:1705–1710. [Google Scholar]
- 19.Ding H, Shen J, Wan M, Chen Z. Macromol Chem Phys. 2008;209:864–871. [Google Scholar]
- 20.Trchova M, Syedenkova I, Konyushenko EN, Stejskal J, Holler P, Ciric-Marjanovic G. J Phys Chem B. 2006;110:9461–9468. doi: 10.1021/jp057528g. [DOI] [PubMed] [Google Scholar]
- 21.Anilkumar P, Jayakannan M. Langmuir. 2008;24:9754–9762. doi: 10.1021/la801128j. [DOI] [PubMed] [Google Scholar]
- 22.Jin E, Wang X, Liu N, Zhang W. Mater Lett. 2007;61:4959–4962. [Google Scholar]
- 23.Barthet C, Armes SP, Lascelles SF, Luk SY, Stanley HME. Langmuir. 1998;14:2032–2041. [Google Scholar]
- 24.Riede A, Helmstedt M, Riede V, Stejskal J. Langmuir. 1998;14:6767–6771. [Google Scholar]
- 25.Zhang L, Wan MX. Adv Funct Mater. 2003;13:815–820. [Google Scholar]
- 26.Bliznyuk VN, Baig A, Singamaneni S, Pud AA, Fatyeyeva KY, Shapoval GS. Polymer. 2005;46:11728–11736. [Google Scholar]
- 27.Neelgund GM, Bliznyuk VN, Pud AA, Fatyeyeva KY, Hrehorova E, Joyce M. Polymer. 2010;51:2000–2006. [Google Scholar]
- 28.Neelgund GM, Hrehorova E, Joyce M, Bliznyuk V. Poly Int. 2008;57:1083–1089. [Google Scholar]
- 29.Amarnath CA, Kim J, Kim K, Choi J, Sohn D. Polymer. 2008;49:432–437. [Google Scholar]
- 30.Rao PS, Sathyanarayana DN, Palaniappan S. Macromolecules. 2002;35:4988–4996. [Google Scholar]
- 31.Sreedhar B, Radhika P, Neelima B, Hebalkar N, Basaveswara Rao MV. Polym Adv Technol. 2009;20:950–958. [Google Scholar]
- 32.Yang M, Yao X, Ding GH. Colloids Surf A. 2008;324:113–116. [Google Scholar]
- 33.Stejskal J, Sapurina I, Trchova M, Konyushenko EN, Holler P. Polymer. 2006;47:8253–8262. [Google Scholar]
- 34.Li G, Zhang C, Peng H. Macromol Rapid Commun. 2008;29:63–67. [Google Scholar]
- 35.Zhang J, Shan D, Mu S. J Polym Sci A. 2007;45:5573–5582. [Google Scholar]
- 36.Wang Z, Yuan J, Han D, Niu L, Ivaska A. Nanotechnology. 2007;18:115610–115615. [Google Scholar]
- 37.Kim B, Oh S, Han M, Im S. Synth Met. 2001;122:297–304. [Google Scholar]
- 38.Mo Z, Shi H, Chen H, Niu G, Zhao Z, Wu Y. J Appl Polym Sci. 2009;112:573–578. [Google Scholar]
- 39.Han Y, Kusunose T, Sekino T. Synth Met. 2009;159:123–131. [Google Scholar]
- 40.Nabok A. Organic and Inorganic Nanostructures. Artech House; Massachusetts: 2005. p. 133. [Google Scholar]
- 41.Pud A, Ogurtsov N, Korzhenko A, Shapoval G. Prog Polym Sci. 2003;28:1701–1753. [Google Scholar]


