

Abstract
We explored the effects of aging on two large scale brain networks, the default mode network (DMN) and the task-positive network (TPN). During fMRI scanning, young and older participants carried out four visual tasks: detection, perceptual matching, attentional cueing, and working memory. Accuracy of performance was roughly matched at 80% across tasks and groups. Modulations of activity across conditions were assessed, as well as functional connectivity of both networks. Younger adults showed a broader engagement of the DMN, and older adults a more extensive engagement of the TPN. Functional connectivity in the DMN was reduced in older adults, whereas the main pattern of TPN connectivity was equivalent in the two groups. Age-specific connectivity also was seen in TPN regions. Increased activity in TPN areas predicted worse accuracy on the tasks, but greater expression of a connectivity pattern associated with a right dorsolateral prefrontal TPN region, seen only in older adults, predicted better performance. These results provide further evidence for age-related differences in the DMN, and new evidence of age differences in the TPN. Increased use of the TPN may reflect greater demand on cognitive control processes in older individuals that may be partially offset by alterations in prefrontal functional connectivity.
Keywords: Aging, attention, frontal lobe, functional MRI, memory
There has been increasing interest in the use of functional neuroimaging to characterize large scale brain networks, particularly one commonly known as the default mode network (DMN). This network of regions increases its activity when people are attending to internally driven cognitive processes, and reduces its activity when an external task-based focus is required (Shulman et al., 1997; Gusnard et al., 2001; Raichle et al., 2001). The DMN is generally thought to consist of seven primary brain regions (Fox et al., 2005; Toro et al., 2008; Spreng et al., 2009): 1) posterior cingulate and medial parietal regions (including retrosplenial cortex and sometimes the precuneus); 2) inferior parietal lobule (IPL), particularly the angular gyrus; 3) medial prefrontal cortex (PFC), both ventral and dorsal portions; 4) superior frontal gyrus; 5) anterior portions of inferior temporal cortex; 6) medial temporal cortex (parahippocampal gyrus); 7) medial cerebellum. Involvement of the lateral cortical and medial temporal areas in the DMN is typically bilateral.
The exact role of the DMN is unknown, but it is thought to mediate the monitoring of internal and external milieus and to involve self referential thought (Gusnard et al., 2001; Harrison et al., 2008) and other types of social cognition (Schilbach et al., 2008). Buckner and Carroll (2007) have recently suggested that the DMN mediates the ability to mentally project oneself forward and backward in time, and is involved in four types of processing: retrieval of past events, planning of future events, spatial navigation and theory of mind. Support for this notion was recently reported in a meta-analysis (Spreng et al., 2009), which found that some DMN regions (posterior cingulate, retrosplenial cortex, parahippocampal gyrus, and angular gyrus) show activity during these four types of processing. In addition, there was reported activity in medial PFC with all processes but navigation. Therefore, the DMN may participate in multiple types of processing. In addition, there is evidence that the DMN exists in non-human primates (Rilling et al., 2007), and maintains its functional connectivity during sleep and anesthesia (Boly et al., 2008; Horovitz et al., 2008). This may indicate that DMN functional connectivity is heavily influenced by structural connections among these regions (Ghosh et al., 2008; Hagmann et al., 2008; Greicius et al., 2009; Honey et al., 2009).
The DMN often is anti-correlated with a set of regions that is engaged across a variety of tasks, which has come to be known as the task-positive network (TPN, Fox et al., 2005), or fronto-parietal network (Toro et al., 2008). That is, as one becomes involved in carrying out an externally-driven task, such as working memory, activity in task-related areas increases and default mode activity decreases. The TPN consists of regions thought to be involved in cognitive control (e.g., D’Esposito et al., 1995; Dove et al., 2006; Alain et al., 2008), such as inferior frontal gyrus, near the operculum, portions of inferior parietal cortex anterior to DMN regions, dorsolateral prefrontal cortex, and sensorimotor areas (Fox et al., 2005; Toro et al., 2008). Recently it was shown that the degree of anti-correlation between the DMN and TPN is related to performance on cognitive tests (Kelly et al., 2008). This finding, together with evidence that DMN activity is reduced to a greater degree as task difficulty increases (McKiernan et al., 2003), suggests that the balance between the these two networks is critical for effective cognitive processing.
Several studies have found that the reduction of DMN activity during cognitive tasks is less pronounced in older adults, relative to younger adults (Lustig et al., 2003; Grady et al., 2006; Persson et al., 2007; Damoiseaux et al., 2008; Miller et al., 2008). Functional connectivity among DMN regions also is reduced with age (Andrews-Hanna et al., 2007; Esposito et al., 2008; Sambataro et al., in press). Although some studies have found age-related differences across the DMN (Persson et al., 2007; Damoiseaux et al., 2008), several have suggested that the effect of age on the regions comprising the default network is variable. For example, Lustig et al (2003) reported a large age difference in the posterior cingulate, a smaller difference in medial frontal cortex, and none at all in inferior parietal regions. Grady et al (2006) reported a similar age-related reduction of DMN modulation in posterior cingulate and medial parietal regions during a variety of memory tasks, but found no age difference in medial prefrontal regions. Evidence that these age differences may have consequences for memory performance was reported by Miller et al (2008), who found that failure to reduce activity in medial parietal cortex during encoding was most prominent in older adults who performed poorly on a subsequent memory test. Similarly, others have found that the strength of the correlations within the DMN are related to performance on tests of memory, executive function and processing speed in older adults (Andrews-Hanna et al., 2007; Persson et al., 2007; Damoiseaux et al., 2008; Sambataro et al., in press). These studies all suggest that activity and functional connectivity of the DMN are disrupted in older adults and that this may have negative consequences for cognitive function.
Although the evidence seems clear that older adults show an altered balance between default and task networks, the focus to date has been on the DMN, with no reports of age differences in the TPN. Some of the regions in the TPN have increased task-related activity in older adults, relative to younger adults, such as dorsolateral prefrontal cortex (for reviews see Cabeza, 2002; Rajah and D’Esposito, 2005; Grady, 2008; Park and Reuter-Lorenz, 2009) and parietal regions (e.g., Nielson et al., 2002; Daselaar et al., 2006; Lee et al., 2006; Townsend et al., 2006; Rajah and McIntosh, 2008), but the network as a whole has not been examined. In addition, common age differences in brain activity across a variety of cognitive domains have been demonstrated, as well as differences specific to domain (Cabeza et al., 2004). It would be important to examine both of these networks, and determine age differences over a wide range of tasks, to demonstrate that these are present regardless of the specific task demands. Therefore, the goal of the current study was to explore age differences in DMN and TPN activity across multiple types of cognitive processing in order to have a more complete picture of how these networks are altered with age. To examine whether age might impact differently on the anterior and posterior nodes of the DMN, we examined functional connectivity of this network using two prominent regions that have been used as seeds in previous work (Greicius et al., 2003; Hampson et al., 2006; Andrews-Hanna et al., 2007), these being the posterior cingulate and ventromedial frontal cortex. We used seeds in the right inferior parietal lobe and dorsolateral prefrontal cortex to assess TPN connectivity. Finally, to explore the impact of an altered balance between the DMN and TPN on behavior, we assessed the ability of brain measures summarizing activity and connectivity in these networks, as well as age, to predict performance on our tasks. We expected to find smaller task-related reductions of DMN activity in older adults, as we and others have reported previously, and that this age difference would be found relative to all tasks, that is, not specific to any cognitive domain. We also expected that functional connectivity of the DMN would be disrupted with aging. On the other hand, as older adults often have more activity in some brain areas during tasks relative to younger adults (noted above), we considered it possible that this “over-recruitment” would extend to the TPN more generally, and that connectivity of the TPN might be maintained or even enhanced in older adults. Determining the relation between age differences in network activity and task performance allowed us to assess these differences in light of current theories of neural aging, such as compensation or inefficient use of neural resources (e.g., Cabeza, 2002; Rypma et al., 2007; Grady, 2008).
Materials and Methods
Participants in the experiment were 19 young adults (mean age 25 ± 3 yrs, range 20–30, 10 women) and 28 older adults (mean age 66 ± 8 yrs, range 56–84, 14 women). Most of the participants were right handed (3 in each group were left handed), and all were screened using a detailed health questionnaire to exclude health problems and/or medications that might affect cognitive function and brain activity, including strokes and cardiovascular disease. The structural MRIs also were inspected to rule out severe white matter changes or other abnormalities. The young adults had significantly more years of education than did the older adults (Young = 18.0 ± 2.1 yrs; Older = 15.7 ± 3.1 yrs, p < 0.01; t(46) = 2.8, p < 0.01). There was no age difference in mean scores (mean scores for both groups = 29) on a test of mental status (MMSE, Folstein et al., 1975). All participants gave informed consent for their participation, following the guidelines of the Research Ethics Board at Baycrest and the University of Toronto.
Stimuli and Tasks
Visual stimuli were band-pass filtered white noise patches with different center frequencies (Figure 1, Protzner and McIntosh, 2007). There were five conditions during scanning: 1) fixation to a dot presented in the middle of the screen (no response required); 2) detection of a single stimulus; 3) perceptual matching; 4) attentional cueing; and 5) a delayed match-to-sample test of working memory. In the detection task, a single stimulus appeared for 1000 ms in one of three locations at the bottom of the display (left, central, or right), and participants pressed one of three buttons to indicate the location where the stimulus appeared. There were 12 trials in each detection block. In matching blocks a sample stimulus appeared centrally in the upper portion of the screen along with three choice stimuli located in the lower part of the screen (for 4000 ms). The task was to indicate which of the three choice stimuli matched the sample. Six such trials occurred in each matching block. Each trial of the attention task began with a stimulus appearing for 1500 ms in the centre of the upper part of the screen. Then an arrow pointing either to the right or to the left appeared (in the lower part of the screen) with the sample stimulus for 1500 ms. Then the arrow was removed and 500 ms later two stimuli appeared in the right and left locations for 3000 ms. The task was to attend only to the location that had been cued by the arrow, and press one of two buttons to indicate whether or not the cued target stimulus matched the sample. There were four trials in each attention block. In addition, the total number of trials was divided equally among “same/different” (the stimulus in the cued location matched the sample, while the stimulus in the uncued location did not), “different/same” (the cued stimulus did not match the sample, while the uncued stimulus did match), “different/different” and “same/same”. Finally, in the working memory task, a sample stimulus was presented for 1500 ms in the center of the upper portion of the screen followed by a delay of 2500 ms (blank screen). Then, three choice stimuli were presented for 3000 ms in the lower portion of the screen and the participants had to press one of three buttons to indicate which of the three stimuli matched the previously seen sample. There were four trials in each working memory block. In all tasks, the inter-trial interval was 2000 ms.
Figure 1.

Examples of the type of stimulus used in all tasks. Specific examples from the perceptual matching task (a) and the delayed match-to-sample task (b) are shown. See Methods for a description of task presentation.
Prior to scanning, participants were tested in a mock scanner to determine accuracy thresholds for each participant per task, in an attempt to match performance across groups and minimize the effect of any age differences in visual function. These thresholds indicated the difference in center frequency between stimuli necessary for accuracy to be roughly 80% in each participant (thresholds for the detection task were not measured, as this task did not require participants to discriminate between stimuli, but simply to detect one). The thresholds necessary to reach 80% correct were influenced by age, F(1,44) = 6.7, p < 0.02, with the older adults requiring larger differences between stimuli to reach the performance criterion (older M = 2.1, younger M = 1.9). During scanning, there were 2 blocks of each task (lasting approximately 40 sec each1) per scanning run, presented in a random order. Each run also contained 8 20-sec blocks of fixation interleaved with the task blocks. There were 4 runs in total for each participant.
fMRI Data Acquisition and Pre-Processing
Images were acquired with a Siemens Trio 3T magnet. We first obtained a T1 weighted anatomical volume using SPGR (TE = 2.6 ms, TR = 2000 ms, FOV = 256 mm, slice thickness = 1 mm) for co-registration with the functional images and to ensure that there were no significant brain abnormalities in any of the participants. T2* functional images to obtain BOLD activity (TE= 30 ms, TR= 2000 ms, flip angle=70°, FOV = 200 mm) were obtained using EPI acquisition. Each functional sequence consisted of 28 5-mm thick axial slices, positioned to image the whole brain.
The initial step in the image analysis was to create a common template to use in the registration of each participant’s scans into a common space. We first divided the sample into three age groups, consisting of the young adults and two subsets of older adults (14 in each subset, 56–64 yrs and 65–84 yrs) to accommodate age differences across subjects. This procedure was based on work showing that age differences in brain structure accelerate after the age of 65 (e.g., Scahill et al., 2003). For each of the three age groups, we created an unbiased non-linear group average anatomical image (Chen et al., 2005; Kovacevic et al., 2005; Levine et al., 2008). From the three group-specific average images we then created a common anatomical image, which we refer to as the Common Template. The transforms obtained from the two stages were concatenated to produce a single non-linear transform from each single subject’s structural MRI into the common template space.
Functional data were slice-time corrected using AFNI (afni.nimh.nih.gov/afni) and motion corrected using AIR (bishopw.loni.ucla.edu/AIR5/). For each run, the mean functional volume for each subject was registered using AIR with that subject’s structural volume via a rigid body transformation model. After appropriate transform concatenations - from the initial volume to the 100th volume within a run, from the mean run volume to the structural volume, and from the subject’s structural volume into the common template space - we obtained a direct non-linear transform for each fMRI volume into the common template space.
Additional pre-processing steps consisted of spatial smoothing with a FWHM=7mm Gaussian kernel, and regressing out white matter time series from each voxel time series. For the white matter regression, we used the white matter map from the ICBM probabilistic tissue atlas (http://www.loni.ucla.edu/ICBM/Downloads/Downloads_ICBMprobabilistic.shtml) as a starting point for indentifying areas most likely to be white matter. This white matter map was transformed into the Common Template space, applied to the Common Template, and a white matter mask was generated by creating a binary mask of the transformed map based on a threshold level of 0.8 (≥ 80% chance of containing white matter). This initial mask then was eroded using a 3×3 square morphological structuring element. We calculated the spatial average of voxels in the resulting conservative white matter mask in each subject and used the resulting averaged white-matter time series as a regressor in a general linear model for each voxel and subject separately. The residual in the model was considered to be a noise reduced time-series for each voxel, and these voxel values were entered into the image analysis described below.
Data Analysis
Behavioral data were analyzed using a mixed ANOVA with group as a between-subjects factor and task as a within-subjects factor. Where appropriate, post hoc t-tests with Bonferroni correction for multiple comparisons were carried out.
For image analysis we used a multivariate approach, Partial Least Squares, or PLS (McIntosh et al., 1996; McIntosh, 1999; McIntosh et al., 2004), in order to identify large-scale functionally connected patterns of activity across the entire brain. PLS operates on the covariance between brain voxels and the experimental design across subjects to identify a new set of variables (so-called latent variables or LVs) that optimally relate the two sets of measurements. PLS is similar to other multivariate techniques, such as principal component analysis, in that contrasts across conditions or groups typically are not specified in advance; rather, the algorithm extracts LVs explaining the covariance between conditions and brain activity in order of the amount of covariance explained (with the LV accounting for the most covariance extracted first). Each LV contains a spatial activity pattern depicting the brain regions that, as a whole, show the strongest relation to (e.g. are covariant with) the task contrast identified by the LV. Each brain voxel has a weight, known as a salience, which is proportional to the covariance of activity with the task contrast on each LV. The significance for each LV as a whole was determined by using a permutation test (McIntosh et al., 1996). As 500 permutations were used, the smallest p value obtainable for each LV was p < 0.002. In addition to the permutation test, a second and independent step was to determine the reliability of the saliences for the brain voxels characterizing each pattern identified by the LVs. To do this, all saliences were submitted to a bootstrap estimation of the standard errors (SE, Efron and Tibshirani, 1986). Reliability for each voxel was determined from the ratio of its salience value to the SE for that voxel, and clusters of at least 10 contiguous voxels with a salience/SE ratio > 3.0 were identified. A ratio of 3.0 approximates p < 0.005 (Sampson et al., 1989). The local maximum for each cluster was defined as the voxel with a bootstrap ratio higher than any other voxel in a 2-cm cube centered on that voxel. Locations of these maxima are reported as coordinates in MNI space. In addition, the results of each analysis were compared qualitatively (i.e., compared in general location) to published coordinates of the DMN and TPN as summarized in recent papers by Toro et al (2008) and Spreng et al (2009). Finally, to obtain summary measures of each participant’s expression of each LV pattern, we calculated ‘brain scores’ by multiplying each voxel’s salience by the BOLD signal in the voxel, and summing over all brain voxels for each participant. These brain scores were calculated for each condition and then mean-centered using the grand mean across all conditions. Confidence intervals (95%) for the mean brain scores in each condition and group were calculated from the bootstrap, and differences in activity between conditions and age groups were determined via a lack of overlap in these confidence intervals.
The fMRI analysis consisted of a number of steps to assess modulations of activity across the conditions and network functional connectivity. The first step consisted of a task PLS analysis that contrasted the mean activity (averaged over all blocks across all runs) in the four task conditions and fixation in both age groups together. The first two LVs from this analysis revealed a difference between fixation and the tasks in both groups, and will be reported here. Four regions from the task analysis were chosen as seeds for a subsequent functional connectivity analysis. Connectivity was assessed for the DMN during the fixation condition (to approximate a resting condition) and for the TPN during the four tasks. Two seeds were chosen for the DMN, one in the posterior cingulate and one in ventromedial prefrontal cortex (see Table 2 for locations of these seeds). These two areas have been consistently identified as nodes of their respective networks (e.g., Fox et al., 2005; Toro et al., 2008), and are the ones most commonly used for connectivity studies of this network (e.g., Andrews-Hanna et al., 2007; Spreng and Grady, in press). For the TPN we chose a region in the inferior parietal lobe and one in dorsolateral prefrontal cortex as seeds (see Table 2). The parietal region was chosen because the inferior parietal lobes were the TPN regions that were expressed most reliably in the task PLS (see Table 2), and the frontal region was used as a seed because of the reports of more prefrontal activity in older adults (e.g., Cabeza, 2002; Rajah and D’Esposito, 2005; Grady, 2008; Park and Reuter-Lorenz, 2009). BOLD signal in these four areas was extracted and entered into a series of ‘seed’ analyses in which correlations of activity in the seeds with all other voxels (i.e., functional connectivity) across subjects was assessed in young and older adults simultaneously (McIntosh et al., 1998). To provide a measure of how strongly seed activity covaried with the pattern of activity seen on each LV, correlations between brain scores and seed activity were computed for each group. Reliability of these correlations (confidence intervals of 95%) was calculated from the bootstrap procedure.
Table 2.
Brain Areas with Modulations of Activity across Conditions in Both Groups
| Region | BA | X | Y | Z | BSR |
|---|---|---|---|---|---|
| More Activity for Fixation (DMN) | |||||
| L middle/superior frontal gyrusb | 8 | −28 | 36 | 44 | −5.1 |
| L ventromedial prefrontalb | 32 | −4 | 36 | −4 | −9.1 |
| L middle/inferior temporal gyrusb | 21 | −58 | −4 | −20 | −10.6 |
| R middle temporal gyrusb | 21 | 50 | −12 | −24 | −11.4 |
| L hippocampusb | −28 | −24 | −16 | −7.3 | |
| R lingual/parahippocampal gyrusb | 18 | 16 | −56 | −8 | −9.2 |
| L posterior cingulateb | 31 | −12 | −48 | 36 | −11.8 |
| R retrosplenialb | 30 | 12 | −64 | 8 | −10.6 |
| L inferior parietal lobe (angular gyrus)b | 39 | −44 | −80 | 32 | −8.8 |
| R inferior parietal lobe (angular gyrus)b | 39 | 44 | −72 | 24 | −4.8 |
| Cerebellumb | 0 | −56 | −48 | −9.6 | |
| Caudate nucleus | 4 | 10 | 4 | −7.9 | |
| More Activity for Tasks (TPN) | |||||
| R middle frontal gyrusa | 9 | 40 | 36 | 20 | 9.2 |
| L insula/frontal operculuma | 45 | −40 | 16 | 0 | 10.3 |
| R insula/frontal operculuma | 45 | 36 | 16 | −8 | 9.9 |
| L precentral gyrus (FEF)a | 6 | −32 | −8 | 56 | 11.2 |
| R middle frontal gyrus (FEF)a | 6 | 28 | −4 | 48 | 11.2 |
| L precentral gyrusa | 6 | −56 | 8 | 28 | 5.9 |
| R precentral/inferior frontal gyrus | 44 | 48 | 4 | 24 | 9.6 |
| R supplementary motor areaa | 6 | 4 | −4 | 56 | 5.5 |
| L inferior parietal lobea | 40 | −48 | −40 | 48 | 18.6 |
| R inferior parietal lobea | 40 | 44 | −44 | 44 | 17.7 |
| L superior parietal lobe (IPS)a | 7 | −28 | −60 | 56 | 9.9 |
| R superior parietal lobe (IPS)a | 7 | 28 | −60 | 48 | 10.9 |
| L inferior occipital gyrusa | 37 | −48 | −72 | −4 | 7.9 |
| R middle occipital gyrusa | 7/19 | 28 | −72 | 28 | 7.1 |
| R fusiform gyrusa | 37 | 44 | −64 | −12 | 10.6 |
Region is located close to a region in the TPN, according to Toro et al (2008).
Region is located close to a region in the DMN, according to Toro et al (2008) or Spreng et al (2009).
The DMN maxima are from the regions shown in blue in Figure 2a, and the TPN maxima are from the regions shown in red in Figure 2a (LV1). Italicized regions are those used as seeds in the functional connectivity analyses. Abbreviations: BA, Brodmann area; BSR, bootstrap ratio from the PLS analysis indicating the reliability of the reported voxel; R, right hemisphere; L, left hemisphere; FEF, frontal eye field; IPS, intraparietal sulcus.
Results
Behavioral Results
Performance measures for the tasks are shown in Table 1. Mean accuracy during the scanning session was roughly equivalent to the 80% target for the matching, attention and working memory tasks. There was a significant effect of task, F(3,138) = 95.2, p<0.001, driven largely by better accuracy on the detection task. Post hoc contrasts showed that accuracy on the detection task exceeded that of all the other tasks (p < 0.001, corrected), as one would expect, and accuracy on working memory was greater than accuracy on either matching or attention tasks (p < 0.01, corrected). In addition, accuracy of performance was similar across groups. Nevertheless, the effect of age was significant, F(1,46) = 7.8, p < 0.01, as was the task × age interaction, F(3,138) = 3.2, p < 0.05. Post hoc t-tests examining the effect of age on accuracy for each task showed a significant group difference only for the working memory task (p<0.05, corrected).
Table 1.
Performance Measures
| Task | Young | Older |
|---|---|---|
| a. Percent Correct | ||
| Reaction time | 97.9 (3.0) | 97.6 (3.2) |
| Perceptual matching | 83.5 (3.7) | 82.2 (4.2) |
| Attentional cueing | 84.5 (5.7) | 78.9 (9.9) |
| Delayed match to sample | 88.6 (6.1) | 83.4 (5.9) |
| b. Response Time (msec) | ||
| Reaction time | 506 (85) | 678 (123) |
| Perceptual matching | 1538 (386) | 2091 (233) |
| Attentional cueing | 1191 (262) | 1548 (175) |
| Delayed match to sample | 1150 (229) | 1517 (229) |
| c. Response Time variability (ISD) | ||
| Reaction time | 0.57 (0.05) | 0.87 (0.06) |
| Perceptual matching | 0.75 (0.04) | 0.92 (0.03) |
| Attentional cueing | 0.71 (0.05) | 0.94 (0.03) |
| Delayed match to sample | 0.73 (0.05) | 0.94 (0.03) |
Standard deviations are in parentheses. ISD = intrasubject standard deviation.
For response times, there were main effects of task F(3,138) = 380.5, p<0.001, and group, F(1,46) = 59.3, p < 0.001, as well as a significant task × group interaction, F(3,138) = 9.4, p < 0.001. All pairwise contrasts among the tasks were significant (p < 0.001, corrected), except for attention and working memory tasks, which did not differ2. Simple main effects of group for each task separately showed a reliable age difference for each task (p < 0.001). Therefore, to examine the task × age interaction we carried out a linear within-subject contrast of this interaction, entering the response times in ascending order of fastest to slowest overall. This contrast was significant, F(1,45) = 19.3, p < 0.001, indicating that the age difference in speed of responding was smallest for the detection task and increased as responses in general became slower. Finally, to determine if there were speed-accuracy tradeoffs in either group we calculated correlations between accuracy and RT. None of these correlations was significant for any task in either group. Thus, these behavioral data show that older adults were slower on the tasks, and somewhat less accurate on working memory.
We also examined response time variability using the intrasubject standard deviation of the response times. This latter measure was included because of the known relation between behavioral variability and cognitive function in older adults (Hultsch et al., 2000; West et al., 2002; MacDonald et al., 2003); as well, several papers have recently shown relations between brain activity and variability of behavioral response during scanning (Kelly et al., 2008; MacDonald et al., 2008). There was a significant effect of group on response variability, F(1,43) = 29.6, p < 0.001, and a marginal effect of task, F(3,129) = 4.1, p = 0.05. Although the older adults had larger variability in response times, this increase was the same across the tasks (condition x age interaction F<1).
Modulations of Brain Activity
The analysis examining activity changes across conditions and groups revealed two significant patterns of activity distinguishing fixation from the four task conditions. The first (accounting for 24% of the covariance, p<0.002) identified regions characteristic of the DMN in both groups (blue regions in Figure 2a), with more activity during fixation in medial regions of frontal and parietal cortex, medial temporal cortex, lateral parietal cortex (angular gyri), and temporal poles. This pattern of activity included all of the areas typically thought to be part of the DMN (Table 2), with the exception of the right superior frontal gyrus. It also included the caudate nucleus, a region not typically thought to be part of the DMN. A different set of regions showed more activity during the tasks (red regions in Figure 2a), including superior and inferior parietal regions (anterior to the angular gyri) bilaterally, bilateral inferior frontal gyri, right dorsolateral prefrontal cortex, premotor regions, and both dorsal and ventral occipital regions (Table 2). These regions all are consistent with the TPN, and include all TPN regions except the left dorsolateral prefrontal cortex and the left ventral portion of the intraparietal sulcus. The brain scores from this LV differed between fixation and all the task conditions in both groups, but were of similar magnitude in the two age groups (Figure 2a).
Figure 2.

Results of the task PLS analysis contrasting modulations of activity across all conditions in younger and older adults, shown on axial images from the average MRI for all participants (Z = −24 to Z=+40; this format also is used for Figures 4 and 5). The pattern identified by LV1 (panel a) shows areas with greater activity during all 4 tasks (shown in red and associated with positive brain scores) contrasting with those showing more activity during fixation (blue areas, associated with negative brain scores) in both age groups. The graph in a shows the mean-centered mean brain scores for both groups on this LV (error bars represent the 95% confidence interval). The pattern identified by LV2 (panel b) shows areas with an age difference in activity. Areas shown in red had task-related increases in older adults (relative to fixation) and/or task-related reductions in younger adults. Areas shown in blue had more activity during fixation in older adults and the opposite pattern in young adults (see Table 3 for increased/decreased activity for all regions). The graph in b shows the mean-centered mean brain scores for both groups on LV2 (error bars represent the 95% confidence intervals). A bootstrap ratio threshold of 4.0 was used to show the pattern of activity on LV1 and a threshold of 3 was used for LV2. Abbreviations: Fix = fixation; DET = detection task; PMT = perceptual matching task; ATT = attentional cueing task; DMS = delayed match-to-sample working memory task.
The second significant pattern of activity (accounting for 12.6% of the covariance, p < 0.002) showed an age difference in brain activity across the conditions (Figure 2b). A set of regions was identified that showed a reliable difference between fixation and all task conditions, but this difference was not the same in the two groups. The brain scores characterizing activity on this LV (Figure 2b) clearly showed that the contrast of fixation to the task conditions was in the opposite direction for young and older adults. In addition, the within-condition scores differed between the two groups during fixation, the attention task and the working memory task. The majority of regions identified by this LV (shown in red in Figure 2b and listed with positive bootstrap ratios in Table 3) showed greater task-related reductions in younger adults and/or greater task-related increases in older adults (see task minus fixation differences in Table 3). These areas included a number of TPN regions in the inferior frontal gyri, inferior parietal lobe and occipital areas where older adults showed larger task-related increases of activity than did the younger adults. There also were a number of areas with larger task-related decreases in young adults, including two DMN regions (parahippocampal gyrus and precuneus) and a number of ventral occipital areas. More activity during fixation, relative to the tasks, was seen in the right amygdala, left temporoparietal cortex, and left motor cortex in the older adults (shown in blue in Figure 2b and listed with negative bootstrap ratios in Table 3). These regions with age differences overlap to some extent with the DMN and TPN regions seen in Figure 2a, and appear to be a subset of those regions identified by the first LV. Regions not overlapping with the areas identified by LV1 are the left dorsolateral prefrontal region, where older adults had a larger task-related increase, the thalamus, where younger adults had decreased activity during the tasks, and the left posterior temporal region where task-related activity was increased in young and decreased in older adults (see Supplementary Figure and Table 3).
Table 3.
Brain Areas with Age Differences
| Region | BA | X | Y | Z | BSR | Δ Yng | Δ Old |
|---|---|---|---|---|---|---|---|
| L insula/frontal operculuma | 47 | −40 | 16 | 0 | 5.5 | 0.11 | 0.28 |
| R insula/frontal operculuma | 47 | 32 | 16 | −4 | 4.1 | 0.14 | 0.28 |
| L middle frontal gyrusa | 46 | −48 | 48 | 20 | 5.2 | −0.20 | 0.26 |
| L precentral gyrusa | 6 | −40 | 4 | 28 | 4.1 | −0.15 | 0.02 |
| L inferior parietal lobea | 40 | −40 | −40 | 40 | 4.3 | 0.20 | 0.46 |
| R superior occipital gyrusa | 39 | 32 | −72 | 36 | 4.4 | 0.02 | 0.19 |
| R middle occipital gyrusa | 19 | 36 | −80 | 16 | 8.9 | −0.07 | 0.19 |
| R parahippocampal gyrusb | 18 | 20 | −48 | −16 | 5.2 | −0.09 | 0.09 |
| Precuneusb | 7 | 0 | −72 | 52 | 4.8 | −0.28 | 0.22 |
| R superior frontal gyrus | 10 | 28 | 52 | 4 | 4.8 | −0.02 | 0.19 |
| R superior frontal gyrus | 6 | 16 | 0 | 64 | 6.0 | −0.03 | 0.23 |
| Middle cingulate gyrus | 24 | 0 | 8 | 32 | 5.7 | −0.14 | 0.09 |
| R lingual gyrus | 18 | 4 | −80 | 0 | 7.2 | −0.58 | −0.14 |
| L lingual gyrus | 18 | −20 | −76 | −8 | 5.6 | −0.35 | −0.10 |
| L fusiform gyrus | 37 | −44 | −56 | −16 | 5.2 | −0.17 | 0.03 |
| R fusiform gyrus | 37 | 36 | −52 | −20 | 4.6 | −0.05 | 0.15 |
| R thalamus | 4 | −4 | 0 | 5.9 | −0.13 | 0.04 | |
| L cerebellum | −8 | −84 | −28 | 7.3 | −0.28 | 0.22 | |
|
| |||||||
| L middle temporal gyrusb | 21 | −56 | 0 | −28 | −4.2 | 0.00 | −0.32 |
| L middle temporal gyrus | 39 | −56 | −64 | 28 | −4.3 | 0.13 | −0.26 |
| L precentral gyrus | 4 | −32 | −28 | 52 | −4.9 | 0.04 | −0.01 |
| R amgydala | 24 | −12 | −24 | −4.9 | −0.04 | −0.36 | |
Region is located close to a region in the TPN, according to Toro et al (2008).
Region is located close to a region in the DMN, according to Toro et al (2008) or Spreng et al (2009).
Regions with positive bootstrap ratios are shown in red in Figure 2b, and regions with negative ratios are shown in blue in Figure 2b (LV2). Δ Yng, task-related activity (averaged over the four tasks) minus activity during fixation in young adults; Δ Old, task-related activity (averaged over the four tasks) minus activity during fixation in older adults. For other abbreviations, see Table 2.
Examples of activity in specific regions from these two patterns are shown in Figure 3 for fixation and activity averaged over the four task conditions. Ventromedial prefrontal cortex (Figure 3a) and posterior cingulate (Figure 3b), identified by LV1, both had more activity for fixation than task, as would be expected of DMN regions. Also, the fixation vs. task difference for these regions was similar in younger and older adults. Signal in the right inferior parietal lobe (Figure 3c) and right dorsolateral prefrontal area (Figure 3d) was increased during tasks, consistent with the TPN, and also was similar across age groups. Thus, none of the regions used as seeds in the functional connectivity analyses showed an age difference in activity. In contrast, left middle frontal cortex (Figure 3e) and right parahippocampal gyrus (Figure 3f) were identified by LV2 and showed different patterns of activity in young and older adults. The left prefrontal area (a TPN region) showed more task-related activity, relative to fixation, in older adults but not in younger adults. The parahippocampal gyrus (a DMN region) had more activity in fixation relative to the tasks only in the young adults. Considering these two patterns of activity together, LV1 can be described as a set of regions showing the typical patterns of the DMN and TPN that are similar in younger and older adults, whereas LV2 identifies a subset of TPN regions with more task-related activity in older adults and a subset of DMN regions with larger task-related decreases in younger adults3.
Figure 3.

BOLD signal changes in six regions, as examples from LV1 and LV2 (values are mean centered, see Table 2 for coordinates). a: ventromedial prefrontal cortex (DMN region, LV1); b: posterior cingulate (DMN region, LV1); c: right inferior parietal lobe (TPN region, LV1). d: right middle frontal gyrus (TPN region, LV1); e: left middle frontal gyrus (TPN region, LV2); f: right parahippocampal gyrus (DMN region, LV2). Error bars represent the standard error of the mean.
To illustrate these age differences in activity of the DMN and TPN, we carried out two additional PLS analyses to contrast fixation to all four task conditions, in each group separately. The results of these two analyses were superimposed onto a structural brain image in order to show the areas of overlap and those areas involved in only one group or the other. In Figure 4, it can be seen that the DMN, i.e., those areas with more activity during fixation (cool colors in Figure 4), was more extensive in younger adults in posterior regions. There also were some areas where the DMN was more extensive in older adults, for example in ventromedial prefrontal cortex. More striking was the greater extent of TPN activity, i.e., those areas with more activity during the tasks (warm colors in Figure 4), in older adults, particularly in lateral and medial frontal cortex.
Figure 4.
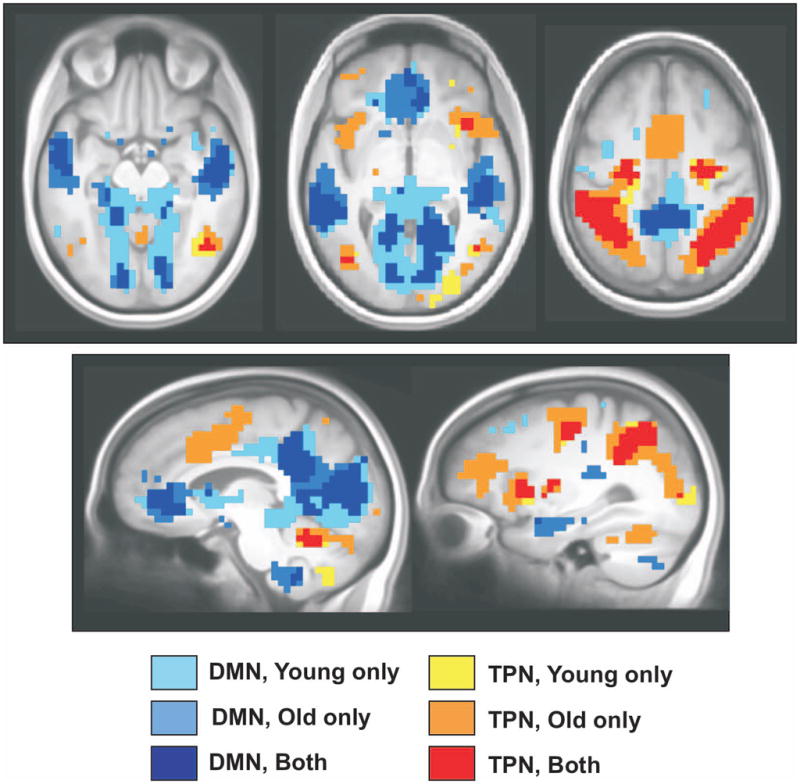
The DMN and TPN for the two groups are shown on axial and sagittal images from the average MRI. For this image, the fixation condition was contrasted to all four tasks in each group separately and a bootstrap ratio threshold of 4.0 was used. The cool colors indicate those areas with more activity for fixation (DMN regions) and the warm colors indicate areas with more activity during the tasks (TPN regions).
Functional Connectivity of the DMN
To assess functional connectivity of the DMN we chose two regions as seeds, both of which have been used in previous studies for this purpose (e.g., Andrews-Hanna et al., 2007; Fox et al., 2005). One seed was located in the posterior cingulate and the other in ventromedial prefrontal cortex (see Table 2 for coordinates of these regions). Each of these analyses assessed connectivity during fixation in both groups so that group differences could be determined directly.
The connectivity analysis using the posterior cingulate seed revealed one LV that was marginally significant (p = 0.06, accounting for 62.5% of the cross-block covariance, see Figure 5a). Activity in the set of regions identified by this LV was reliably correlated with activity in the posterior cingulate in both younger (r = 0.91) and older adults (r = 0.73). Although the correlation appeared to be weaker in the older adults, the confidence intervals overlapped (see Figure 5a), indicating that these correlations did not differ significantly from each other. Regions positively correlated with the posterior cingulate included ventromedial prefrontal cortex, retrosplenial cortex, inferior and middle temporal gyri, and superior frontal sulci, all considered to be nodes of the DMN (red areas in Figure 5a, see Supplementary Table 1). Other areas positively correlated with the posterior cingulate, but not typically considered part of the DMN, included the posterior insula, middle occipital gyrus, left inferior frontal gyrus, and the right superior temporal gyrus. Negative correlations with the posterior cingulate were seen in TPN regions, namely inferior and superior parietal regions bilaterally, and supplementary motor area (blue regions in Figure 5a, see Supplementary Table 1). Thus, this pattern is similar to previously reported anticorrelations between the DMN and the TPN (e.g., Fox et al., 2005; Harrison et al., 2008), although does not include all of the regions thought to comprise these networks.
Figure 5.

Functional connectivity of the DMN in younger and older adults during fixation using a seed in the posterior cingulate (PCC, panel a) and one in ventromedial prefrontal cortex (VMPFC, panel b). In the top part of each panel is shown the regions where activity was either positively (red regions) or negatively (blue regions) correlated with the seeds. In the bottom part of each panel is shown the correlation between seed activity and the brain scores from the seed PLS. For both seeds, there is positive connectivity between the seed and other DMN regions, and negative correlations with the seeds are seen in TPN regions. A bootstrap ratio threshold of 3.0 was used for both brain images. The error bars on the correlations represent the 95% confidence intervals (determined via the bootstrap).
A similar pattern of correlations emerged with the ventromedial frontal seed (Figure 5b). A single significant LV was found (p < 0.002, accounting for 72.4% of the cross-block covariance). This pattern of connectivity was reliable in both younger (r = 0.94) and older adults (r = 0.64), but the correlation was weaker in the older adults (indicated by non-overlapping confidence intervals in Figure 5b). Regions positively correlated with the ventromedial prefrontal cortex included other DMN regions, such as posterior cingulate and retrosplenial cortex, bilateral angular gyri, temporal poles, and right superior frontal gyrus (red regions in Figure 5b, see Supplementary Table 2). Additional positive connectivity with ventromedial prefrontal cortex was seen in the cuneus, middle temporal gyrus, posterior insula and sensorimotor regions. Negative correlations with this region were seen in TPN regions, such as multiple inferior parietal regions bilaterally, inferior frontal gyri, supplementary motor area and the left frontal eye field (blue regions in Figure 5b, see Supplementary Table 2). Right precentral cortex also was negatively correlated with the ventromedial frontal region. As with the posterior cingulate seed, this pattern of connectivity is similar to the anti-correlated pattern reported previously for the DMN and TPN.
Functional Connectivity of the TPN
To assess connectivity of the TPN we used right inferior parietal and dorsolateral prefrontal regions (see Table 2 for coordinates) that have been previously identified as nodes of this network (Toro et al., 2008), and determined functional connectivity during all of the tasks. Using the parietal seed, the first LV (p < 0.002, accounting for 36% of the cross-block covariance) showed positive connectivity between the seed and other TPN regions, including left parietal cortex, right dorsolateral prefrontal cortex, frontal eye fields, and superior parietal cortex (red regions in Figure 6a, see Supplementary Table 3). Other areas with positive connectivity, but not typically considered to be part of the TPN, included the fusiform gyri and portions of anterior frontal cortex. No brain areas with reliable negative correlations were seen. The set of regions identified by this LV was reliably correlated with the parietal seed in both younger and older adults across all tasks, with no difference in these correlation values (see Figure 6a).
Figure 6.

Functional connectivity of the TPN in younger and older adults across all four tasks using a seed in the right inferior parietal lobe (IPL). a: The regions where activity was positively correlated with the seed in both age groups are shown in the top (there were no reliable negative correlations). In the bottom part of panel a is shown the correlation between seed activity and the brain scores from LV1 across the four tasks. b: The top part of the panel shows regions where activity was positively correlated with the seed in young adults (red areas) and a different set of regions that was positively correlated with the seed in older adults (blue regions). In the bottom part of panel b is shown the correlation between seed activity and the brain scores from LV2 across the four tasks. A bootstrap ratio threshold of 3.0 was used for both brain images. The error bars represent the 95% confidence intervals (determined via the bootstrap).
This analysis also revealed a second significant LV (p = 0.014, accounting for 16% of the cross-block covariance). This LV showed a pattern of opposite correlations in young and older adults in all tasks except the detection task (Figure 6b). In younger adults the right parietal region was positively correlated with three regions typically included in the DMN, i.e., the left inferior temporal gyrus, retrosplenial cortex, and right parahippocampal gyrus (red regions in Figure 6b, Supplementary Table 3). In older adults there was positive connectivity between the right parietal seed and bilateral inferior frontal, bilateral superior frontal and right middle frontal regions (blue regions in Figure 6b, Supplementary Table 3).
For the right dorsolateral prefrontal seed, the first LV (p < 0.002, accounting for 32% of the cross-block covariance) showed positive functional connectivity between the seed and other TPN regions, including inferior frontal gyri, frontal eye fields, and superior parietal cortex (red regions in Figure 7a, see Supplementary Table 4). Positive correlations were also found in thalamus, putamen, cerebellum and precentral gyri. Negative correlations were seen in some DMN regions, including the hippocampus, posterior cingulate and medial frontal cortex. The set of regions identified by this LV was reliably correlated with the frontal seed in both younger and older adults across all tasks (with the exception of the matching task in young adults), with no age difference in these correlation values (see Figure 7a).
Figure 7.

Functional connectivity of the TPN in younger and older adults across all four tasks using a seed in the right dorsolateral prefrontal cortex (DLPFC). a: The regions where activity was positively (red) and negatively (blue) correlated with the seed in both age groups are shown in the top. In the bottom part of panel a is shown the correlation between seed activity and the brain scores from LV1 across the four tasks. b: The top part of the panel shows regions where activity was positively correlated with the seed in young adults (blue areas) and a different set of regions that was positively correlated with the seed in older adults (red regions). In the bottom part of panel b is shown the correlation between seed activity and the brain scores from LV2 across the four tasks. A bootstrap ratio threshold of 3.0 was used for both brain images. The error bars represent the 95% confidence intervals (determined via the bootstrap).
A second reliable pattern of connectivity (p < 0.002, accounting for 19% of the covariance) identified areas where the right prefrontal seed was correlated differently in older adults relative to young adults in all four tasks (Figure 7b). Younger adults showed positive correlations between the right dorsolateral prefrontal seed and occipital regions, including two TPN regions (blue regions in Figure 7b, see Supplementary Table 4). In contrast, older adults showed positive correlations between the right dorsolateral prefrontal seed and left middle frontal gyrus, precentral gyrus and supramarginal gyrus, all TPN areas (red regions in Figure 7b, see Supplementary Table 4). Other left hemisphere areas also showed positive connectivity with right prefrontal cortex in older adults, including the medial frontal gyrus and precentral gyrus.
Predicting Behavior from Brain Activity and Connectivity
Previous work has shown that modulations of activity and/or functional connectivity in the DMN are related to behavioral measures in both young and older adults (Andrews-Hanna et al., 2007; Kelly et al., 2008; Miller et al., 2008). To address this issue with our data, we used backward stepwise regression analyses to predict individual behavioral measures using the brain scores from the task and seed PLS analyses. The rationale for this approach was that the brain scores, as summary measures of activity across the entire brain, should reflect the degree to which each subject expressed the relative balance between the DMN and TPN seen in the task analysis, or the degree of connectivity in the DMN and TPN. For example, those older adults with more positive brain scores from LV2 in the task analysis (Figure 2b) would be those who are over-expressing the TPN and under-expressing the DMN. Similarly, those participants with more positive brain scores from the seed analyses would be those individuals who have the strongest connectivity. We further reasoned that these brain indices, especially those that showed age differences, would be related to performance on the tasks. The behavioral measures that were modeled were accuracy, response times, and response variability measures from each of the four tasks. Separate regressions were carried out for each behavioral measure in each task using as predictors: 1) the task-specific brain scores from LV2 in the task analysis; 2), the brain scores from the ventromedial prefrontal seed analysis; 3) the task-specific brain scores from LV2 in the parietal seed analysis; 4) the task-specific brain scores from LV2 in the frontal seed analysis; and 5) age.
The results of these regression analyses are shown in Table 4. Age was not a significant predictor of accuracy after accounting for the other variables, except for working memory, similar to the ANOVA results reported above. Brain scores on LV2 from the task analysis predicted accuracy on the detection and attention tasks. In both cases the beta value was negative, indicating that increases in the brain scores from the task analysis were associated with worse accuracy. That is, with increasing activity in the TPN, or those TPN regions that were more active in older adults, performance was less accurate. In terms of functional connectivity, increased expression of the parietal connectivity pattern seen in younger adults was associated with better accuracy on the attention task. In addition, there was a trend for worse accuracy on the working memory task with increasing expression of the pattern of DMN connectivity found using the ventromedial prefrontal area as the seed region. Although the model for the matching task fell short of significance (p=0.06), better accuracy on this task was associated with greater expression of the parietal connectivity pattern seen in younger adults and the frontal connectivity pattern seen in older adults.
Table 4.
Results of the Regression Analyses Using Brain Activity to Predict Behavior
| Predictors
| ||||||
|---|---|---|---|---|---|---|
| Tasks | Task2 | VMPfc | Par2 | Pfc2 | Age | F |
| Accuracy | ||||||
| Detection | −0.38** | 7.7** | ||||
| Perceptual matching | 0.38* | 0.41* | 2.9† | |||
| Attention | −0.49** | 0.30* | 9.0** | |||
| Working memory | −0.24† | −0.43** | 7.6** | |||
| Response Time | ||||||
| Detection | −0.18† | 0.70** | 23.2** | |||
| Perceptual matching | 0.32* | −0.32** | 0.57** | 20.7** | ||
| Attention | 0.67** | 36.2** | ||||
| Working memory | −0.27* | 0.64** | 18.1** | |||
| Response time Variability | ||||||
| Detection | 0.38* | 0.33* | 13.8** | |||
| Perceptual matching | 0.30† | 0.32* | 8.5** | |||
| Attention | 0.57** | 20.4** | ||||
| Working memory | 0.29* | 0.47** | 12.0** | |||
.05 < p < 0.10;
p < 0.05;
p < 0.01
Values are the betas from the regression analyses and the F value for the final model. Abbreviations: Task2, brain scores from LV2 of the task PLS; VMPfc, brain scores from DMN functional connectivity analysis using the ventromedial PFC seed; Par2, brain scores from LV2 of the TPN functional connectivity analysis using the IPL seed; Pfc2, brain scores from LV2 of the TPN functional connectivity analysis using the DLPFC seed.
Slower response times were strongly predicted by increasing age, as expected. The most interesting set of predictions was seen for the matching task, in which slower responding was associated with increased TPN activity (i.e., increasing activity in those TPN regions that were more active in older adults) and faster responding with increased expression of the frontal connectivity pattern seen only in older adults (Table 4). Increased expression of this age-specific connectivity pattern also was associated with faster responding on the working memory task.
Finally, variability of response times was predicted by age across all tasks such that increasing age was associated with increased variability (Table 4), consistent with the age differences noted above. In addition, variability increased as the brain scores on LV2 from the task analysis increased during the detection task (with a trend for the matching task). That is, with increasing activity in those TPN regions that were more active in older adults, performance was more variable. After accounting for the influence of other variables, increasing variability of response during the working memory task was predicted by increasing DMN connectivity.
Discussion
In this study, we compared the default and task networks over multiple cognitive domains using a multivariate approach that allowed us to assess mean activity changes and functional connectivity. There were three main findings. First, our participants showed the expected modulations of activity in the DMN and TPN, i.e., reduced activity in the DMN and increased activity in the TPN across all cognitive domains, relative to fixation. However, a subset of DMN regions showed greater task-related decreases in young adults and a subset of TPN regions showed greater task-related increases in older adults, the net effect of which was an age-related shrinkage of the extent of the DMN along with an increase in the extent of the TPN. Because these age differences in activity between fixation and task occurred across all of the cognitive domains tested in this study, they are likely to be independent of the task demands. Second, functional connectivity of the DMN was reduced in the older adults when a ventromedial PFC seed was used. Although connectivity using a posterior cingulate seed did not show any reliable age differences, the older adults showed a tendency for weaker connectivity with this seed as well, and connectivity overall with the posterior cingulate was relatively weak. Therefore, our results do not provide strong evidence for a differential impact of age on either the anterior or posterior nodes of the DMN. In contrast to the DMN, the primary pattern of functional connectivity in the TPN, using either the inferior parietal lobe or dorsolateral prefrontal cortex as the seed, was maintained in older adults. In addition, patterns of functional connectivity that distinguished the age groups were found, indicating a degree of age specificity in how these two TPN regions are functionally connected with other parts of the brain. For both TPN seeds the predominant regions showing connectivity only in the older adults were in prefrontal cortex. The third important finding from this study is that indices of the balance between the DMN and TPN predicted behavioral performance. Poorer performance was predicted by increased engagement of TPN regions that were over-recruited by older adults; in contrast, better performance was predicted by increased expression of the dorsolateral prefrontal connectivity pattern seen in the older group. Thus, our data revealed age differences in the DMN that were consistent with previously published reports, as well as some new information about the effects of age on the TPN.
In both age groups we were able to identify common modulations of activity across conditions in the two networks. In many of these regions there were no age differences in the extent to which activity was modulated across the conditions, including the four regions used as seeds for the connectivity analyses. It is notable that we were able to identify most of the major regions thought to comprise the DMN and TPN, despite some differences across studies in the regions that are included in the these networks (e.g., Harrison et al., 2008; Toro et al., 2008) as well as differences in how they are defined (e.g. by contrasting task activity to fixation or during the resting state). This is further evidence of the robustness of these networks in humans regardless of the precise methods used to identify them.
Importantly, however, there were age differences in some of these network regions. For example, younger adults had greater task-related decreases in medial occipital and parietal regions, extending into the medial temporal lobes, whereas older adults had greater task-related increases mainly in frontal and lateral parietal areas. Although we have interpreted the medial posterior regions showing greater task-related reductions of activity in young adults as DMN areas, it is possible that some of these areas, particularly those in visual cortex, are part of a separate network. That is, some have suggested that visual regions of the brain form a ‘resting state’ network that is distinct from the DMN (Mantini et al., 2007). It also is possible that activity in visual areas was reduced for a different reason. Activity in primary visual cortex is reduced when people view coherent shapes relative to noise (Murray et al., 2002), so it may be that our visual tasks were accompanied by such a decrease, relative to fixation, and that older adults show this decrease to a lesser extent. Some of the age differences in visual cortex also could have been influenced by age differences in visual function, such as contrast sensitivity (e.g., Sekuler and Owsley, 1982), although the adjustment of stimuli for each individual participant prior to scanning should have minimized these differences.
So, with these caveats in mind as to the precise composition of the brain networks under consideration, we conclude from the current data that there is an apparent shrinkage of the extent of the DMN, along with an expansion of the TPN. This has not been reported previously, to our knowledge, but is consistent with age-related reductions in DMN modulation during tasks (Grady et al., 2006; Lustig et al., 2003) as well as with increased activity in frontal regions frequently reported in the aging literature (e.g., Cabeza, 2002; Rajah and D’Esposito, 2005; Grady, 2008; Park and Reuter-Lorenz, 2009). Indeed, the areas primarily more active in older adults during the tasks were frontal regions (e.g. the inferior frontal regions and dorsolateral prefrontal cortex) involved in the TPN. In particular, left dorsolateral prefrontal cortex was over-recruited in older adults, which is interesting in light of a recent suggestion that this region may act in a compensatory fashion in aging (Rajah and D’Esposito, 2005). The over-recruitment of dorsal frontal and parietal areas in older adults during our tasks suggests a greater engagement of top-down attentional processes (Corbetta et al., 2008), and additional activity in inferior frontal areas may reflect increased dependence on cognitive control (Seeley et al., 2007), relative to the young adults. Importantly, our results synthesize the previously unconnected findings of reduced DMN activity and task-related over-recruitment in older adults, and further indicate that over-recruitment of brain activity in older adults can extend to a large scale network active across multiple cognitive domains. It also is interesting to note that our finding of increased engagement of the TPN in older adults was found across all of our tasks, relative to fixation, even in the easy detection task that older adults could perform as accurately as younger adults. Our results therefore do not appear to be dependent on the presence or absence of age differences in task performance, although the age differences in task accuracy that did exist were relatively small, due to our determination of thresholds for each participant. It is unknown if such over-engagement of the TPN would be seen during tasks where accuracy in older adults was markedly lower than that of younger adults. There also are no data in the literature, to our knowledge, on how activity in the TPN is modulated with task difficulty, even in young adults.
We also assessed functional connectivity of these networks, and found that both younger and older adults showed connectivity between the DMN seeds and other regions in this network. However, older adults showed reduced connectivity in the DMN as we had expected, although this difference was reliable only for the ventromedial frontal seed. This may have been due to weaker connectivity using the cingulate seed in general, as the correlation between activity in this area and its functionally connected regions was numerically smaller in the older adults. In addition to DMN regions we also found that areas outside the typically defined DMN were correlated with the DMN seeds in both groups. These included the posterior insula, lingual gyrus and lateral temporal cortex. It may be that other regions are recruited into the DMN, depending on how it is defined. That is, the regions that are functionally connected to the ‘core’ regions of the default network may depend to some extent on whether the network is identified during a resting state scan or during a fixation condition that alternates with task conditions, as we did here. In addition, seed PLS assesses correlations in pairs of voxels across subjects (McIntosh, 1999), which differs from other methods of assessing DMN connectivity, such as ICA (e.g., Harrison et al., 2008) or correlations between time courses (e.g., Fox et al., 2005). This methodological difference also could account for some of the variability in regional recruitment into the DMN.
Unlike the DMN, functional connectivity of the TPN was maintained into older age, using both prefrontal and parietal regions as seeds. In addition, both of these regions showed patterns of functional connectivity specific to each age group, with older adults recruiting additional frontal regions into the networks. Thus, the primary pattern of TPN connectivity appears not to change with age, and this network shows some age-related plasticity as well. The continued engagement of TPN connectivity in the face of reduced DMN connectivity in older adults may indicate that the DMN is more vulnerable to the effects of age. It is possible that the expansion of the TPN, or the engagement of the age-specific patterns of TPN connectivity that we observed, are a response to the shrinkage and/or reduced connectivity of the DMN, although our data do not speak directly to this question. We suggest that reduced connectivity within the DMN reduces older adults’ ability to down-regulate this network during externally driven tasks, which may interfere with task performance, requiring greater need for the cognitive control of the TPN. We have previously proposed (Grady et al., 2006) that altered function in the DMN is a potential mechanism for the common finding that older adults are more distracted by irrelevant information during task performance (e.g., Hasher et al., 1999). The results of the current study would suggest that this effect may be a function both of DMN shrinkage as well as reduced connectivity. However, future studies will need to address the interactions among the DMN and TPN directly and how these interactions are modulated by task demands. In addition, it will be necessary to determine how age differences in network activity or connectivity emerge over time. That is, older adults may be influenced more by fatigue than younger adults, resulting in larger age differences in network expression near the end of a task run, and/or during the later task runs compared to earlier runs.
Based on the work of others (Andrews-Hanna et al., 2007; Kelly et al., 2008; Miller et al., 2008) we expected to find that activity in the DMN and TPN would be related to performance, in addition to age, and indeed this was the case. The pattern of results suggests a relation between increasing expression of age differences in TPN activity and poorer or more variable performance. Worse performance, based on all three behavior measures, was predicted by increasing activity in the subset of DMN and TPN regions that were more active in older adults during the tasks. Put another way, those older adults whose brain activity most closely resembled that of younger adults performed better on the tasks. This result is not consistent with the idea of compensatory brain activity, in the sense that age-specific patterns should be associated with better performance (Grady, 2008). However, it is in line with the idea of neural inefficiency in older adults, in which older adults show more brain activity than younger adults for a similar level of behavioral accuracy (Morcom et al., 2007; Rypma et al., 2007; Zarahn et al., 2007). It also is consistent with the idea of compensation that maintains performance (Zarahn et al., 2007); that is, those older adults who showed additional engagement of the TPN might have performed even more poorly without this additional recruitment. For example, the TPN may be recruited more by older adults to counteract the distractibility due to incomplete suppression of the DMN, as suggested above, but this may not necessarily result in a performance level equivalent to that seen in younger adults. Another alternative to consider in regard to this relation between over-recruitment of the TPN and performance in the older adults is that the older adults might have adopted an inappropriate strategy for carrying out the tasks, and this strategy difference may have accounted for age differences in activity and the way activity was related to performance. This is perhaps not very likely, as overt strategies such as verbal mediation would not have been particularly useful with the type of visual stimuli used here (McIntosh et al., 1999), but cannot be ruled out completely.
Functional connectivity in the TPN also predicted performance, but not in the same way as activity per se predicted performance. Increased expression of the pattern of parietal connectivity seen only in the young adults was associated with better accuracy on some of the tasks, whereas increased expression of the pattern of prefrontal connectivity seen only in the older adults was associated with better accuracy and faster responding. This suggests that the age-specific pattern of TPN connectivity identified with the right frontal seed, which involved connectivity with left dorsolateral prefrontal cortex, can support performance in older adults. This bilateral pattern of prefrontal connectivity, and its relation to better performance, is consistent with the idea that prefrontal engagement during cognitive tasks tends to be more bilateral in older adults and that the differential engagement or connectivity of dorsolateral prefrontal regions can be compensatory (e.g., Grady et al., 1994; Cabeza, 2002; Grady et al., 2003; Rajah and D’Esposito, 2005; Reuter-Lorenz and Lustig, 2005; Grady, 2008; Park and Reuter-Lorenz, 2009). This pattern of prefrontal functional connectivity may offset, to some degree and for some tasks, inefficiency in TPN engagement or age differences in the DMN.
The one surprising aspect of the behavioral analyses was the association between increasing connectivity of the DMN and poorer and more variable performance during the working memory task, as a previous study has shown that better connectivity is associated with lower behavioral variability (Kelly et al., 2008). This earlier study only looked at younger adults and used resting state scans to identify the DMN, so methodological differences between that study and ours can likely account for some of the difference in results. However, it is clear that further work will be necessary to determine how activity and functional connectivity in these networks are related to cognition under a variety of task conditions in both younger and older adults.
Some discussion of other factors that can influence BOLD activity in older adults and that might have influenced our result is warranted. Measures of gray matter volume or density are often reduced in older compared to younger adults (e.g., Sullivan et al., 1995; Raz et al., 1997; Tisserand et al., 2000) and there might be concern that a reduced amount of tissue would artificially reduce functional measures in older adults (Meltzer et al., 1990). In addition, there are vascular changes with age that might adversely impact activity measures obtained with fMRI (Mrak et al., 1997). Although we did not assess these factors in our study, it is unlikely that they have played a major role in our results. There are several reasons why we believe this to be the case. First of all, many of the areas with changes in activity across the tasks and fixation, including the regions used as seeds in the connectivity analyses, did not show lower levels of activity in the older adults, removing the concern that potentially lower gray matter volume would lower activity in these regions. Second, the age differences in activity that we observed did not always take the form of less modulation during the experimental conditions, but consisted of modulation in a different direction or actually greater modulation in older adults. It is difficult to see how smaller tissue volumes or vascular differences could lead to such a result. Finally, we found an age reduction in the pattern of functional connectivity using the ventromedial prefrontal region as a seed, but not when TPN seeds were used, although none of the seeds showed an age reduction in overall activity level. Again, it would be difficult to explain such a result on the basis of either volumetric or vascular factors. It also is encouraging to note that a very recent study found no relation between gray matter volume and DMN activity in older adults (Beason-Held et al., 2009). Nonetheless, functional connectivity between brain areas is influenced by structural connections among these regions (e.g., Hagmann et al., 2008), so there likely is a relation between age-related reductions of white matter integrity (Pfefferbaum and Sullivan, 2003; Sullivan and Pfefferbaum, 2006; Madden et al., 2009) and functional connectivity in older adults. This relation is likely to be very complex, but will surely be a fruitful area for future study.
In conclusion, we found that across multiple cognitive domains both younger and older adults modulate activity in the DMN and TPN in expected ways, i.e., reduced activity in the DMN and increased activity in the TPN across all of the tasks. In addition, older adults showed greater task-related increases in a subset of TPN regions, whereas younger adults showed greater task-related decreases in a subset of DMN regions. The effect of these changes is that younger adults have a broader engagement of the default network and older adults a broader engagement of the task network. Over-recruitment of the TPN was associated with poorer performance on the tasks, suggesting that those older individuals who found the tasks more difficult engaged cognitive control processes to a greater degree. On the other hand, plasticity in functional connectivity of the TPN, specifically involving bilateral dorsolateral prefrontal cortex, was associated with better performance on some of the tasks, and may compensate for age reductions in the DMN. It will be important for future work to determine if the expansion of the TPN and alterations of its functional connectivity are a response to the shrinkage and/or reduced connectivity of the DMN.
Supplementary Material
Acknowledgments
Funding
This work was supported by the Canadian Institutes of Health Research (MOP14036 to CLG and MOP13623 to ARM), the Canada Research Chairs program, the Ontario Research Fund, the Canadian Foundation for Innovation, and the Heart and Stroke Foundation Centre for Stroke Recovery.
The authors would like to thank Darryl Bannon and Wayne Lee for technical assistance, Douglas Garrett for the behavioral variability measures, and Annette Weeks-Holder and staff of the Baycrest fMRI centre for help in running the fMRI scans.
Footnotes
Because the stimuli were generated by the computer during the scanning runs, the exact duration of the task blocks varied somewhat across the tasks. However, there were no duration differences across participants or between the age groups.
The longer response time for the matching task is probably due to the fact that 4 stimuli had to be compared and this process took longer than the attention or working memory tasks, which involved evaluating fewer stimuli.
The same task PLS analysis was carried out on a subset of the data, equating young and old groups for education and including only right handed participants. This analysis showed the same pattern of task effects as seen in Figure 2a and 2b.
References
- Alain C, Yu H, Grady C. The inferior parietal lobe contributes to auditory spatial working memory and sensorimotor integration. J Cogn Neurosci. 2008;20:285–295. doi: 10.1162/jocn.2008.20014. [DOI] [PubMed] [Google Scholar]
- Andrews-Hanna JR, Snyder AZ, Vincent JL, Lustig C, Head D, Raichle ME, Buckner RL. Disruption of large-scale brain systems in advanced aging. Neuron. 2007;56:924–935. doi: 10.1016/j.neuron.2007.10.038. [DOI] [PMC free article] [PubMed] [Google Scholar]
- Beason-Held LL, Kraut MA, Resnick SM. Stability Of Default-Mode Network Activity In The Aging Brain. Brain Imaging Behav. 2009;3:123–131. doi: 10.1007/s11682-008-9054-z. [DOI] [PMC free article] [PubMed] [Google Scholar]
- Boly M, Phillips C, Tshibanda L, Vanhaudenhuyse A, Schabus M, Dang-Vu TT, Moonen G, Hustinx R, Maquet P, Laureys S. Intrinsic brain activity in altered states of consciousness: how conscious is the default mode of brain function? Ann N Y Acad Sci. 2008;1129:119–129. doi: 10.1196/annals.1417.015. [DOI] [PMC free article] [PubMed] [Google Scholar]
- Buckner RL, Carroll DC. Self-projection and the brain. Trends Cogn Sci. 2007;11:49–57. doi: 10.1016/j.tics.2006.11.004. [DOI] [PubMed] [Google Scholar]
- Cabeza R. Hemispheric asymmetry reduction in older adults: The HAROLD model. Psychol Aging. 2002;17:85–100. doi: 10.1037//0882-7974.17.1.85. [DOI] [PubMed] [Google Scholar]
- Cabeza R, Daselaar SM, Dolcos F, Prince SE, Budde M, Nyberg L. Task-independent and task-specific age effects on brain activity during working memory, visual attention and episodic retrieval. Cereb Cortex. 2004;14:364–375. doi: 10.1093/cercor/bhg133. [DOI] [PubMed] [Google Scholar]
- Chen XJ, Kovacevic N, Lobaugh NJ, Sled JG, Henkelman RM, Henderson JT. Neuroanatomical Differences between Mouse Strains as Shown by High-Resolution 3D MRI. NeuroImage. 2005;29:99–105. doi: 10.1016/j.neuroimage.2005.07.008. [DOI] [PubMed] [Google Scholar]
- Corbetta M, Patel G, Shulman GL. The reorienting system of the human brain: from environment to theory of mind. Neuron. 2008;58:306–324. doi: 10.1016/j.neuron.2008.04.017. [DOI] [PMC free article] [PubMed] [Google Scholar]
- Damoiseaux JS, Beckmann CF, Sanz Arigita EJ, Barkhof F, Scheltens P, Stam CJ, Smith SM, Rombouts SA. Reduced resting-state brain activity in the “default network” in normal aging. Cereb Cortex. 2008;18:1856–1864. doi: 10.1093/cercor/bhm207. [DOI] [PubMed] [Google Scholar]
- Daselaar SM, Fleck MS, Dobbins IG, Madden DJ, Cabeza R. Effects of Healthy Aging on Hippocampal and Rhinal Memory Functions: An Event-Related fMRI Study. Cereb Cortex. 2006;16:1771–1782. doi: 10.1093/cercor/bhj112. [DOI] [PMC free article] [PubMed] [Google Scholar]
- D’Esposito M, Detre JA, Alsop DC, Shin RK, Atlas S, Grossman M. The neural basis of the central executive system of working memory. Nature. 1995;378:279–281. doi: 10.1038/378279a0. [DOI] [PubMed] [Google Scholar]
- Dove A, Brett M, Cusack R, Owen AM. Dissociable contributions of the mid-ventrolateral frontal cortex and the medial temporal lobe system to human memory. Neuroimage. 2006;31:1790–1801. doi: 10.1016/j.neuroimage.2006.02.035. [DOI] [PubMed] [Google Scholar]
- Efron B, Tibshirani R. Bootstrap methods for standard errors, confidence intervals and other measures of statistical accuracy. Stat Sci. 1986;1:54–77. [Google Scholar]
- Esposito F, Aragri A, Pesaresi I, Cirillo S, Tedeschi G, Marciano E, Goebel R, Di Salle F. Independent component model of the default-mode brain function: combining individual-level and population-level analyses in resting-state fMRI. Magn Reson Imaging. 2008;26:905–913. doi: 10.1016/j.mri.2008.01.045. [DOI] [PubMed] [Google Scholar]
- Folstein MF, Folstein SE, McHugh PR. “Mini Mental State”- a practical method for grading the cognitive state of patients for the clinician. J Psychiatr Res. 1975;12:189–198. doi: 10.1016/0022-3956(75)90026-6. [DOI] [PubMed] [Google Scholar]
- Fox MD, Snyder AZ, Vincent JL, Corbetta M, Van Essen DC, Raichle ME. The human brain is intrinsically organized into dynamic, anticorrelated functional networks. Proc Natl Acad Sci U S A. 2005;102:9673–9678. doi: 10.1073/pnas.0504136102. [DOI] [PMC free article] [PubMed] [Google Scholar]
- Ghosh A, Rho Y, McIntosh AR, Kotter R, Jirsa VK. Noise during rest enables the exploration of the brain’s dynamic repertoire. PLoS Comput Biol. 2008;4:e1000196. doi: 10.1371/journal.pcbi.1000196. [DOI] [PMC free article] [PubMed] [Google Scholar]
- Grady CL. Cognitive neuroscience of aging. Ann N Y Acad Sci. 2008;1124:127–144. doi: 10.1196/annals.1440.009. [DOI] [PubMed] [Google Scholar]
- Grady CL, Maisog JM, Horwitz B, Ungerleider LG, Mentis MJ, Salerno JA, Pietrini P, Wagner E, Haxby JV. Age-related changes in cortical blood flow activation during visual processing of faces and location. J Neurosci. 1994;14:1450–1462. doi: 10.1523/JNEUROSCI.14-03-01450.1994. [DOI] [PMC free article] [PubMed] [Google Scholar]
- Grady CL, McIntosh AR, Craik FI. Age-Related differences in the functional connectivity of the hippocampus during memory encoding. Hippocampus. 2003;13:572–586. doi: 10.1002/hipo.10114. [DOI] [PubMed] [Google Scholar]
- Grady CL, Springer MV, Hongwanishkul D, McIntosh AR, Winocur G. Age-related changes in brain activity across the adult lifespan. J Cogn Neurosci. 2006;18:227–241. doi: 10.1162/089892906775783705. [DOI] [PubMed] [Google Scholar]
- Greicius MD, Krasnow B, Reiss AL, Menon V. Functional connectivity in the resting brain: a network analysis of the default mode hypothesis. Proc Natl Acad Sci U S A. 2003;100:253–258. doi: 10.1073/pnas.0135058100. [DOI] [PMC free article] [PubMed] [Google Scholar]
- Greicius MD, Supekar K, Menon V, Dougherty RF. Resting-state functional connectivity reflects structural connectivity in the default mode network. Cereb Cortex. 2009;19:72–78. doi: 10.1093/cercor/bhn059. [DOI] [PMC free article] [PubMed] [Google Scholar]
- Gusnard DA, Akbudak E, Shulman GL, Raichle ME. Medial prefrontal cortex and self-referential mental activity: Relation to a default mode of brain function. Proc Nat Acad Sci USA. 2001;98:4259–4264. doi: 10.1073/pnas.071043098. [DOI] [PMC free article] [PubMed] [Google Scholar]
- Hagmann P, Cammoun L, Gigandet X, Meuli R, Honey CJ, Wedeen VJ, Sporns O. Mapping the structural core of human cerebral cortex. PLoS Biol. 2008;6:e159. doi: 10.1371/journal.pbio.0060159. [DOI] [PMC free article] [PubMed] [Google Scholar]
- Hampson M, Driesen NR, Skudlarski P, Gore JC, Constable RT. Brain connectivity related to working memory performance. J Neurosci. 2006;26:13338–13343. doi: 10.1523/JNEUROSCI.3408-06.2006. [DOI] [PMC free article] [PubMed] [Google Scholar]
- Harrison BJ, Pujol J, Lopez-Sola M, Hernandez-Ribas R, Deus J, Ortiz H, Soriano-Mas C, Yucel M, Pantelis C, Cardoner N. Consistency and functional specialization in the default mode brain network. Proc Natl Acad Sci U S A. 2008;105:9781–9786. doi: 10.1073/pnas.0711791105. [DOI] [PMC free article] [PubMed] [Google Scholar]
- Hasher L, Zacks RT, May CP. Inhibitory control, circadian arousal, and age. Attention and Performance XVII: Cognitive regulation of performance. In: Gopher D, Koriat A, Gopher D, Koriat A, editors. Interaction of theory and application. Cambridge, MA: MIT Press; 1999. pp. 653–675. [Google Scholar]
- Honey CJ, Sporns O, Cammoun L, Gigandet X, Thiran JP, Meuli R, Hagmann P. Predicting human resting-state functional connectivity from structural connectivity. Proc Natl Acad Sci U S A. 2009;106:2035–2040. doi: 10.1073/pnas.0811168106. [DOI] [PMC free article] [PubMed] [Google Scholar]
- Horovitz SG, Fukunaga M, de Zwart JA, van Gelderen P, Fulton SC, Balkin TJ, Duyn JH. Low frequency BOLD fluctuations during resting wakefulness and light sleep: a simultaneous EEG-fMRI study. Hum Brain Mapp. 2008;29:671–682. doi: 10.1002/hbm.20428. [DOI] [PMC free article] [PubMed] [Google Scholar]
- Hultsch DF, MacDonald SW, Hunter MA, Levy-Bencheton J, Strauss E. Intraindividual variability in cognitive performance in older adults: comparison of adults with mild dementia, adults with arthritis, and healthy adults. Neuropsychology. 2000;14:588–598. doi: 10.1037//0894-4105.14.4.588. [DOI] [PubMed] [Google Scholar]
- Kelly AM, Uddin LQ, Biswal BB, Castellanos FX, Milham MP. Competition between functional brain networks mediates behavioral variability. Neuroimage. 2008;39:527–537. doi: 10.1016/j.neuroimage.2007.08.008. [DOI] [PubMed] [Google Scholar]
- Kovacevic N, Henderson JT, Chan E, Lifshitz N, Bishop J, Evans AC, Henkelman RM, Chen XJ. A 3D Atlas of the Mouse Brain with Estimates of the Average and Variability. Cereb Cortex. 2005;15:639–645. doi: 10.1093/cercor/bhh165. [DOI] [PubMed] [Google Scholar]
- Lee TM, Zhang JX, Chan CC, Yuen KS, Chu LW, Cheung RT, Chan YS, Fox PT, Gao JH. Age-related differences in response regulation as revealed by functional MRI. Brain Res. 2006;1076:171–176. doi: 10.1016/j.brainres.2005.12.124. [DOI] [PubMed] [Google Scholar]
- Levine B, Kovacevic N, Nica EI, Gao F, Schwartz ML, Black SE. The Toronto TBI study: injury severity and quantified MRI. Neurology. 2008;70:771–778. doi: 10.1212/01.wnl.0000304108.32283.aa. [DOI] [PubMed] [Google Scholar]
- Lustig C, Snyder AZ, Bhakta M, O’Brien KC, McAvoy M, Raichle ME, Morris JC, Buckner RL. Functional deactivations: change with age and dementia of the Alzheimer type. Proc Natl Acad Sci U S A. 2003;100:14504–14509. doi: 10.1073/pnas.2235925100. [DOI] [PMC free article] [PubMed] [Google Scholar]
- MacDonald SW, Hultsch DF, Dixon RA. Performance variability is related to change in cognition: evidence from the Victoria Longitudinal Study. Psychol Aging. 2003;18:510–523. doi: 10.1037/0882-7974.18.3.510. [DOI] [PubMed] [Google Scholar]
- MacDonald SW, Nyberg L, Sandblom J, Fischer H, Backman L. Increased response-time variability is associated with reduced inferior parietal activation during episodic recognition in aging. J Cogn Neurosci. 2008;20:779–786. doi: 10.1162/jocn.2008.20502. [DOI] [PubMed] [Google Scholar]
- Madden DJ, Spaniol J, Costello MC, Bucur B, White LE, Cabeza R, Davis SW, Dennis NA, Provenzale JM, Huettel SA. Cerebral white matter integrity mediates adult age differences in cognitive performance. J Cogn Neurosci. 2009;21:289–302. doi: 10.1162/jocn.2009.21047. [DOI] [PMC free article] [PubMed] [Google Scholar]
- Mantini D, Perrucci MG, Del Gratta C, Romani GL, Corbetta M. Electrophysiological signatures of resting state networks in the human brain. Proc Natl Acad Sci USA. 2007;32:13170–13175. doi: 10.1073/pnas.0700668104. [DOI] [PMC free article] [PubMed] [Google Scholar]
- McIntosh AR. Mapping cognition to the brain through neural interactions. Memory. 1999;7:523–548. doi: 10.1080/096582199387733. [DOI] [PubMed] [Google Scholar]
- McIntosh AR, Bookstein FL, Haxby JV, Grady CL. Spatial pattern analysis of functional brain images using Partial Least Squares. NeuroImage. 1996;3:143–157. doi: 10.1006/nimg.1996.0016. [DOI] [PubMed] [Google Scholar]
- McIntosh AR, Chau WK, Protzner AB. Spatiotemporal analysis of event-related fMRI data using partial least squares. Neuroimage. 2004;23:764–775. doi: 10.1016/j.neuroimage.2004.05.018. [DOI] [PubMed] [Google Scholar]
- McIntosh AR, Lobaugh NJ, Cabeza R, Bookstein FL, Houle S. Convergence of neural systems processing stimulus associations and coordinating motor responses. Cereb Cortex. 1998;8:648–659. doi: 10.1093/cercor/8.7.648. [DOI] [PubMed] [Google Scholar]
- McIntosh AR, Sekuler AB, Penpeci C, Rajah MN, Grady CL, Sekuler R, Bennett PJ. Recruitment of unique neural systems to support visual memory in normal aging. Cur Biol. 1999;9:1275–1278. doi: 10.1016/s0960-9822(99)80512-0. [DOI] [PubMed] [Google Scholar]
- McKiernan KA, Kaufman JN, Kucera-Thompson J, Binder JR. A parametric manipulation of factors affecting task-induced deactivation in functional neuroimaging. J Cogn Neurosci. 2003;15:394–408. doi: 10.1162/089892903321593117. [DOI] [PubMed] [Google Scholar]
- Meltzer CC, Leal JP, Mayberg HS, Wagner HN, Jr, Frost JJ. Correction of PET data for partial volume effects in human cerebral cortex by MR imaging. J Comput Assist Tomogr. 1990;14:561–570. doi: 10.1097/00004728-199007000-00011. [DOI] [PubMed] [Google Scholar]
- Miller SL, Celone K, DePeau K, Diamond E, Dickerson BC, Rentz D, Pihlajamaki M, Sperling RA. Age-related memory impairment associated with loss of parietal deactivation but preserved hippocampal activation. Proc Natl Acad Sci U S A. 2008;105:2181–2186. doi: 10.1073/pnas.0706818105. [DOI] [PMC free article] [PubMed] [Google Scholar]
- Morcom AM, Li J, Rugg MD. Age effects on the neural correlates of episodic retrieval: Increased cortical recruitment with matched performance. Cereb Cortex. 2007;17:2491–2506. doi: 10.1093/cercor/bhl155. [DOI] [PubMed] [Google Scholar]
- Mrak RE, Griffin ST, Graham DI. Aging-associated changes in human brain. J Neuropathol Exp Neurol. 1997;56:1269–1275. doi: 10.1097/00005072-199712000-00001. [DOI] [PubMed] [Google Scholar]
- Murray SO, Kersten D, Olshausen BA, Schrater P, Woods DL. Shape perception reduces activity in human primary visual cortex. Proc Natl Acad Sci USA. 2002;99:15164–15169. doi: 10.1073/pnas.192579399. [DOI] [PMC free article] [PubMed] [Google Scholar]
- Nielson KA, Langenecker SA, Garavan H. Differences in the functional neuroanatomy of inhibitory control across the adult life span. Psychol Aging. 2002;17:56–71. doi: 10.1037//0882-7974.17.1.56. [DOI] [PubMed] [Google Scholar]
- Park DC, Reuter-Lorenz P. The adaptive brain: aging and neurocognitive scaffolding. Annu Rev Psychol. 2009;60:173–196. doi: 10.1146/annurev.psych.59.103006.093656. [DOI] [PMC free article] [PubMed] [Google Scholar]
- Persson J, Lustig C, Nelson JK, Reuter-Lorenz PA. Age differences in deactivation: a link to cognitive control? J Cogn Neurosci. 2007;19:1021–1032. doi: 10.1162/jocn.2007.19.6.1021. [DOI] [PubMed] [Google Scholar]
- Pfefferbaum A, Sullivan EV. Increased brain white matter diffusivity in normal adult aging: relationship to anisotropy and partial voluming. Magn Reson Med. 2003;49:953–961. doi: 10.1002/mrm.10452. [DOI] [PubMed] [Google Scholar]
- Protzner AB, McIntosh AR. The interplay of stimulus modality and response latency in neural network organization for simple working memory tasks. J Neurosci. 2007;27:3187–3197. doi: 10.1523/JNEUROSCI.4963-06.2007. [DOI] [PMC free article] [PubMed] [Google Scholar]
- Raichle ME, MacLeod AM, Snyder AZ, Powers WJ, Gusnard DA, Shulman GL. A default mode of brain function. Proc Natl Acad Sci U S A. 2001;98:676–682. doi: 10.1073/pnas.98.2.676. [DOI] [PMC free article] [PubMed] [Google Scholar]
- Rajah MN, D’Esposito M. Region-specific changes in prefrontal function with age: a review of PET and fMRI studies on working and episodic memory. Brain. 2005;128:1964–1983. doi: 10.1093/brain/awh608. [DOI] [PubMed] [Google Scholar]
- Rajah MN, McIntosh AR. Age-related differences in brain activity during verbal recency memory. Brain Res. 2008;1199:111–125. doi: 10.1016/j.brainres.2007.12.051. [DOI] [PubMed] [Google Scholar]
- Raz N, Gunning FM, Head D, Dupuis JH, McQuain JM, Briggs SD, Thornton AE, Loken WJ, Acker JD. Selective aging of human cerebral cortex observed in vivo: Differential vulnerability of the prefrontal gray matter. Cereb Cortex. 1997;7:268–282. doi: 10.1093/cercor/7.3.268. [DOI] [PubMed] [Google Scholar]
- Reuter-Lorenz PA, Lustig C. Brain aging: reorganizing discoveries about the aging mind. Curr Opin Neurobiol. 2005;15:245–251. doi: 10.1016/j.conb.2005.03.016. [DOI] [PubMed] [Google Scholar]
- Rilling JK, Barks SK, Parr LA, Preuss TM, Faber TL, Pagnoni G, Bremner JD, Votaw JR. A comparison of resting-state brain activity in humans and chimpanzees. Proc Natl Acad Sci U S A. 2007;104:17146–17151. doi: 10.1073/pnas.0705132104. [DOI] [PMC free article] [PubMed] [Google Scholar]
- Rypma B, Eldreth DA, Rebbechi D. Age-related differences in activation-performance relations in delayed-response tasks: a multiple component analysis. Cortex. 2007;43:65–76. doi: 10.1016/s0010-9452(08)70446-5. [DOI] [PubMed] [Google Scholar]
- Sambataro F, Murty VP, Callicott JH, Tan HY, Das S, Weinberger DR, Mattay VS. Age-related alterations in default mode network: Impact on working memory performance. Neurobiol Aging. doi: 10.1016/j.neurobiolaging.2008.05.022. in press. [DOI] [PMC free article] [PubMed] [Google Scholar]
- Sampson PD, Streissguth AP, Barr HM, Bookstein FL. Neurobehavioral effects of prenatal alchohol: Part II. Partial least squares analysis. Neurotox Teratol. 1989;11:477–491. doi: 10.1016/0892-0362(89)90025-1. [DOI] [PubMed] [Google Scholar]
- Scahill R, Frost C, Jenkins R, Whitwell J, Rossor M, Fox N. A longitudinal study of brain volume changes in normal aging using serial registered magnetic resonance imaging. Arch Neurol. 2003;60:989–994. doi: 10.1001/archneur.60.7.989. [DOI] [PubMed] [Google Scholar]
- Schilbach L, Eickhoff SB, Rotarska-Jagiela A, Fink GR, Vogeley K. Minds at rest? Social cognition as the default mode of cognizing and its putative relationship to the “default system” of the brain. Conscious Cogn. 2008;17:457–467. doi: 10.1016/j.concog.2008.03.013. [DOI] [PubMed] [Google Scholar]
- Seeley WW, Menon V, Schatzberg AF, Keller J, Glover GH, Kenna H, Reiss AL, Greicius MD. Dissociable intrinsic connectivity networks for salience processing and executive control. J Neurosci. 2007;27:2349–2356. doi: 10.1523/JNEUROSCI.5587-06.2007. [DOI] [PMC free article] [PubMed] [Google Scholar]
- Sekuler R, Owsley C. Aging and human visual function. New York: Alan R. Liss; 1982. The spatial vision of older humans; pp. 185–202. [Google Scholar]
- Shulman GL, Fiez J, Corbetta M, Buckner RL, Miezin F, Raichle ME, Petersen SE. Common Blood Flow Changes Across Visual Tasks: Decreases in cerebral cortex. J Cogn Neurosci. 1997;9:648–663. doi: 10.1162/jocn.1997.9.5.648. [DOI] [PubMed] [Google Scholar]
- Spreng R, Grady C. Thinking about the past, the future, and other people engage the default mode network. J Cogn Neurosci in press. [Google Scholar]
- Spreng RN, Mar RA, Kim ASN. The common neural basis of autobiographical memory, prospection, navigation, theory of mind, and the default mode: A quantitative meta-analysis. J Cogn Neurosci. 2009;21:489–510. doi: 10.1162/jocn.2008.21029. [DOI] [PubMed] [Google Scholar]
- Sullivan EV, Marsh L, Mathalon DH, Lim KO, Pfefferbaum A. Age-related decline in MRI volumes of temporal lobe gray matter but not hippocampus. Neurobiol Aging. 1995;16:591–606. doi: 10.1016/0197-4580(95)00074-o. [DOI] [PubMed] [Google Scholar]
- Sullivan EV, Pfefferbaum A. Diffusion tensor imaging and aging. Neurosci Biobehav Rev. 2006;30:749–761. doi: 10.1016/j.neubiorev.2006.06.002. [DOI] [PubMed] [Google Scholar]
- Tisserand DJ, Visser PJ, van Boxtel MP, Jolles J. The relation between global and limbic brain volumes on MRI and cognitive performance in healthy individuals across the age range. Neurobiol Aging. 2000;21:569–576. doi: 10.1016/s0197-4580(00)00133-0. [DOI] [PubMed] [Google Scholar]
- Toro R, Fox PT, Paus T. Functional Coactivation Map of the Human Brain. Cereb Cortex. 2008;18:2553–2559. doi: 10.1093/cercor/bhn014. [DOI] [PMC free article] [PubMed] [Google Scholar]
- Townsend J, Adamo M, Haist F. Changing channels: an fMRI study of aging and cross-modal attention shifts. Neuroimage. 2006;31:1682–1692. doi: 10.1016/j.neuroimage.2006.01.045. [DOI] [PubMed] [Google Scholar]
- West R, Murphy KJ, Armilio ML, Craik FI, Stuss DT. Lapses of intention and performance variability reveal age-related increases in fluctuations of executive control. Brain Cogn. 2002;49:402–419. doi: 10.1006/brcg.2001.1507. [DOI] [PubMed] [Google Scholar]
- Zarahn E, Rakitin B, Abela D, Flynn J, Stern Y. Age-related changes in brain activation during a delayed item recognition task. Neurobiol Aging. 2007;28:784–798. doi: 10.1016/j.neurobiolaging.2006.03.002. [DOI] [PubMed] [Google Scholar]
Associated Data
This section collects any data citations, data availability statements, or supplementary materials included in this article.