

Abstract
Background
Liver biopsy remains the gold standard to assess hepatic fibrosis. It is desirable to predict hepatic fibrosis without the need for invasive liver biopsy. Proteomic techniques allow unbiased assessment of proteins and might be useful to identify proteins related to hepatic fibrosis.
Aims
We utilized two different proteomic methods to identify serum proteins as candidate biomarkers to predict hepatic fibrosis stage in patients with chronic hepatitis C virus (HCV) infection.
Methods
Serum was obtained from 24 people with chronic HCV at time of liver biopsy and from 6 normals. Liver biopsy fibrosis was staged 1–4 (Batts–Ludwig). Pooled serum samples (six in each of four fibrosis groups and controls) were analyzed with 4- and 8-plex isobaric tags for relative and absolute quantitation (iTRAQ), determining protein identification (ID) and ratios of relative protein abundance. Nonpooled samples were analyzed with two-dimensional (2-D) gels and difference in gel electrophoresis (DIGE) comparing different samples on the same gel and across gels. Spots varying among groups were measured with densitometry, excised, digested, and submitted for tandem mass spectrometry (MS/MS) protein ID.
Results
iTRAQ identified 305 proteins (minimum 99% ID confidence); 66 were increased or decreased compared with controls. Some proteins were increased or decreased for specific fibrosis scores. From 704 DIGE protein spots, 66 were chosen, 41 excised, and 135 proteins identified, since one gel spot often identified more than one protein.
Conclusions
Both proteomic methods identified two proteins as biomarker candidates for predicting hepatic fibrosis: complement C4-A and inter-alpha-trypsin inhibitor heavy chain H4.
Keywords: Hepatic fibrosis, Hepatitis C, iTRAQ, DIGE, Gel electrophoresis, Mass spectroscopy
Introduction
Chronic hepatitis C affects 170 million people around the world including 2.7 million in the USA [1]. Hepatitis C virus (HCV) is the major cause of chronic hepatitis in the Western world, a leading cause of cirrhosis, a common cause of hepatocellular carcinoma, and the most common reason for liver transplantation in the USA [2, 3]. The spectrum of liver disease resulting from HCV is quite wide, ranging from no disease for many years to cirrhosis with liver failure within 20 years of infection.
According to National Institutes of Health (NIH) investigators studying hepatitis C, “Fibrosis is the hall-mark of hepatic cirrhosis, worsening of which is probably the best surrogate marker for progression of chronic liver disease” [4]. Liver fibrosis has been shown, in a prospective study of hepatitis C, to be an independent predictor of liver-related mortality [5]. Hepatic fibrosis occurs in most forms of chronic liver disease, results in the deposition of scar tissue, i.e., excess extracellular matrix, and may progress to cirrhosis, characterized by a distortion of the liver architecture which is the major determinant of morbidity and mortality in patients with liver disease, predisposing to liver failure and primary liver cancer [6]. The extent of fibrosis is determined from histological sections following liver biopsy and scored from stage 0–4. However, the true extent of fibrosis is difficult to assess from these scores; for example, progression of fibrosis may not be linear [7-9] in either time or severity in the same manner as histologic scoring systems, as progression from stage 0 to 1 may take longer than from stage 3 to 4 or vice versa, though higher stages of fibrosis are more clinically problematic. Other problems related to determining hepatic fibrosis are the sampling error in the grading of fibrosis on liver biopsy [10] and the complications of liver biopsy [11]. At present there is no accepted noninvasive method to assess or predict the development of fibrosis in patients with hepatitis C. The 2002 NIH consensus panel regarding management of hepatitis C stated that measurement of one serum protein, alanine aminotransferase (ALT), is an important indicator of disease response in patients with elevated ALT levels [12]. A panel or profile of serum proteins is more likely to be superior for monitoring disease compared with measurement of only one serum protein [13]. Noninvasive tests will also greatly aid validation of antifibrotic agents, several of which are being considered for clinical trials [14].
Recently, proteomic techniques have been used to identify protein markers for specific diseases or disease stages. Early results looking for markers of liver diseases have been reported [15-19]. Serum, consisting of plasma from which the clotting factors have been removed, contains 60–80 mg protein/ml in addition to various small molecules such as salts, lipids, amino acids, and sugars [20]. It has been estimated that serum contains as many as 10,000 proteins from cells and tissues throughout the body [21], since in addition to the classical serum proteins it also contains all tissue proteins as leakage markers [22]. Since the liver makes many serum proteins, it is logical to expect that the serum proteome may reflect liver disease.
Proteomic techniques have been developed to enhance global analysis of proteins. Two-dimensional gel electrophoresis (2-DE), a classical method to separate and compare complex protein mixtures, has been enhanced with fluorescent protein markers in a technique known as difference in gel electrophoresis (DIGE) [23]. Another proteomic technique employs isobaric tags for relative and absolute quantitation (iTRAQ) [24]. This report compares how these two proteomic techniques can be utilized to identify candidate biomarkers to predict hepatic fibrosis in patients with hepatitis C.
Materials and Methods
Samples for Analysis
The procedures followed for sample (serum and liver biopsy) collection were approved by the Oregon Health & Science University Institutional Review Board with ongoing analysis approval by the University of Minnesota Institutional Review Board, in accordance with the Helsinki Declaration, and each subject gave informed consent. Serum specimens, obtained at the same time as liver biopsy, were obtained by standard clinical laboratory processing with serum separated typically less than 1 h after blood collection. Serum samples were then stored, within a second hour, at −80°C until time of analysis. The matching liver biopsies were graded and staged by an experienced gastrointestinal (GI) pathologist (C.L.C.) according to the Batts and Ludwig system [25]. This scoring system includes separate assessments of fibrosis (stage 0–4) and grade of necroinflammatory activity (grade 0–4). In general, liver biopsy cores were approximately 15–20 mm long and contained at least eight portal tracks in order to assess fibrosis stage.
Sample Preparation
Serum samples (six in each of four fibrosis groups and six normal controls) depleted of the 12 major abundant proteins (Beckman Coulter, ProteomeLab IgY-12, Fullerton, CA: albumin, IgG, transferrin, fibrinogen, IgA, α2-macroglobulin, IgM, α1-antitrypsin, haptoglobin, α1-acid glycoprotein, apolipoproteins A-I and A-II) were analyzed with: (1) iTRAQ 4-plex and 8-plex pooled methods which provided protein ID and relative ratios of protein abundance and (2) individual DIGE analyses in which proteins were labeled with cyanine dyes, Cy2, Cy3, and Cy5, in order to compare groups across multiple gels. Gels were visualized using a Typhoon 9410 (GE Healthcare Bio-Sciences Corp., Piscataway, NJ) by independently scanning for the fluorescence of Cy2™, Cy5™, and Cy3™.
2-DE
One hundred micrograms of high-abundance-protein-depleted serum samples were prepared using a PlusOne 2-D clean-up kit (GE Healthcare Bio-Sciences Corp., Piscataway, NJ) as recommended by the manufacturer. Protein was measured with a BCA kit (Pierce Biotechnology, Rockford, IL). Following protein precipitation, the supernatant was discarded, and the pellet was dissolved with sample buffer containing 8 M urea, 4% 3-[(3-cholamido-propyl)dimethylammonio]-1-propanesulfonate (CHAPS), 50 mM dithiothreitol (DTT), 0.2% carrier ampholytes, and 0.0002% Bromophenol Blue. After a 2-min 13,600 × g spin, the samples were loaded onto 18-cm pH 4–7 immobilized pH gradient (IPG) strips (Bio-Rad) by over-night reswelling. The isoelectric focusing (IEF) was run for 42,000 KVh using a Protean IEF cell (Bio-Rad), and the IPG strips were equilibrated sequentially, first in equilibration buffer containing dithiothreitol, then in equilibration buffer containing iodoacetamide as recommended by the manufacturer (Bio-Rad). For the second dimension, the IPG strips were run on 4–20%, 8–16% or 12.5% sodium dodecyl sulfate (SDS) polyacrylamide gel electrophoresis (PAGE) gels (Criterion precast Tris–HCl gels, Bio-Rad). The gel was then imaged with Coomassie brilliant blue (CBB) or DIGE (see below) followed by CBB or silver staining.
DIGE
The serum samples were dialyzed with labeling buffer as recommended by the manufacturer (GE Healthcare Bio-Sciences Corp., Piscataway, NJ). CyDye DIGE fluor in dimethylformamide was mixed with the serum sample at a ratio of 50 μg protein to 400 pmol fluor and incubated at room temperature for 30 min in the dark. Then the same volume of 10 mM lysine was added and incubated on ice for 10 min to stop the labeling reaction. Cy5™ and Cy3™ dye labeled samples, each containing 50 μg protein, were then mixed and the sample used for 2-D electrophoresis as described above. The gels were visualized with the Bio-Rad Molecular Imager FX system. Cy5™ viewing enabled identification of serum protein spots from the liver disease subjects, while Cy3™ viewing identified serum protein spots from the controls in the same gel. The gel images were analyzed with PDQuest (V7.2) 2-D gel analysis software (Bio-Rad). The images were cropped and spots were detected according to the Decyder (GE Healthcare Bio-Sciences Corp., Piscataway, NJ) protocol. Briefly, the spots on the gel were detected with the spot detection wizard that automates the process of selecting the proper spot-detection parameters for each gel. These parameters were adjusted until most of the spots of interest were identified in the gel. The protein spots from different gels of serum samples were matched to each other by both matching spots between gels and matching Cy3™ and Cy5™ spots within the same gel. Alternatively, spots which differed between controls and study groups were identified by visual inspection.
iTRAQ
Protein concentration was determined by Bradford assay (BioRAD, Hercules, CA 94547) using a standard curve with bovine serum albumin. Aliquots of protein (50 μg for 4-plex, 25 μg for 8-plex) from serum were subjected to 4-plex and 8-plex iTRAQ™ labeling reagents (ABI, Foster City, CA). Briefly, proteins were denatured and reduced, and cysteine residues were blocked with the reagents supplied in the iTRAQ™ kit. Proteins were digested with trypsin overnight at 37°C. iTRAQ isobaric labels, consisting of a reporter group (m/z 114, 115, 116, and 117, for 4-plex and additionally 113, 118, 119, and 121 for 8-plex), a balance group (m/z 31–28), and an amino reactive group, were used for peptide labeling. The iTRAQ™-labeled peptides were combined, dried in vacuo, resuspended in ~3 mL 0.2% formic acid, adjusted to pH <3, and applied to preconditioned (50% methanol) 3 cc Oasis® MCX cartridges (Waters Corporation, Milford, MA) to remove trypsin, unreacted hydrolyzed iTRAQ reagents, and buffer components with wash buffer (0.1% formic acid, 5% methanol, 50% acetonitrile) and 100% methanol sequentially. The peptides were eluted with 1 mL 5:95 ammonium hydroxide:methanol and speed vacuumed to dryness.
Protein Identification by MS
Two-dimensional gel electrophoresis protein spots of interest (i.e., those that differed between the liver disease groups and the controls) were prepared for tandem mass spectrometry analysis in the following manner. The CBB-stained gel was washed twice with distilled water (15 min each), and protein spots were precisely cut out of the gel using a gel puncher or scalpel. The gel pieces were placed into a 500-μl tube that was incubated at room temperature twice in 500 μl 50 mM ammonium bicarbonate, 50% acetonitrile solution for 30 min. Then the gel was dehydrated completely. Silver-stained gels used different washing steps. First the gel piece was dried. Then 100 μl 1:1 solution of 30 mM potassium ferricyanide and 100 mM sodium thiosulfate was added and incubated at room temperature for 15 min with shaking. The supernatant was removed, and 500 μl 100 mM ammonium bicarbonate solution was added and incubated for 15 min. This ammonium bicarbonate solution wash was repeated twice, and the gel was then dehydrated completely. Proteins within gel pieces were then digested with trypsin by adding 40 μl trypsin solution (160 μl 100 mM ammonium bicarbonate, 3.2 μl 0.5 M CaCl2, 157 μl water, and 40 μl 0.1 μg/μl trypsin stock solution) and reswelling the gel pieces on ice for 15 min. The excess trypsin supernatant was removed, and 60 μl digestion buffer (trypsin buffer without trypsin) was added and incubated for 16 h at 37°C. Peptide extraction was accomplished in the following manner: The supernatant was removed and saved at 4°C. Ammonium bicarbonate (50 μl, 25 mM) was added and incubated at 37°C in a sonication bath for 15 min. Acetonitrile (50 μl, 50%) was added and sonicated for another 15 min. The supernatant was saved. Formic acid (50 μl, 5%) was added and sonicated for 15 min. Then, 50 μl 50% acetonitrile was added and sonicated for another 15 min. The supernatants were combined, and 6 μl 50 mM dithiothreitol was added. The extracts were lyophilized and dissolved in 10 μl 5% formic acid for mass spectrometry analysis, which was accomplished by liquid chromatography electrospray ionization tandem mass spectrometry (LC-ESIMS) using an LCQ classic ion trap mass spectrometer (Thermo Fisher Scientific Inc., San Jose, CA). Peptide separations were performed using a 10 cm × 75 μm capillary column (15 μm tip PicoFrit; New Objectives, Woburn, MA), packed with 5 μm Zorbax SB-C18 material (Agilent Technologies, Wilmington, DE). Samples were applied to the column via a capillary trapping cartridge (Michrom Bioresources Inc., Auburn, Ca), and peptides separated using a 200 nl/min flow rate, mobile phase containing 0.2% acetic acid and 60 min 0–30% acetonitrile gradient. Data-dependent tandem mass spectra on major peptide ions were automatically collected using a dynamic exclusion feature to extend analysis to less abundant peptides. Proteins present in each digested spot were then identified using SEQUEST software [26] (Thermo Scientific Inc., Waltham, MA) to correlate experimental MS/MS spectra with theoretical MS/MS spectra calculated from peptide sequences in a human subset of the Swiss-Prot database [27]. Sequest results were assembled and filtered using DTAselect software [28]. Criteria for positive peptide identification included minimum Xcorr values of 1.8, 2.5, and 3.5 for +1, +2, and +3 ions, respectively, and a minimum deltaCN value of 0.08. Proteins were only considered identified if two or more peptides were matched to their sequence entry and they met the above criteria. The precursor designation was removed from the protein names identified in the serum samples, since the proteins were likely processed before secretion.
Statistical Analysis
iTRAQ
Results from the iTRAQ software were evaluated in a manner geared towards development of a discriminatory rule intended to predict the fibrosis stage of a future sample with unknown degree of fibrosis. While we are unable to evaluate variability across individuals for a given protein with pooled samples, proteins that have larger differences (relative abundance) between fibrosis stages presumably have greater discriminatory potential compared with proteins with smaller observed differences. For each protein, these differences in abundance between fibrosis stages were evaluated by taking differences of the log-transformed relative quantities. In addition to the relative quantities, iTRAQ provides an estimated “error factor” for the measured relative abundance based on the number of peptide ratios and percentage error in the peaks of those peptides. This error factor was converted to an estimated (weighted) protein abundance standard deviation based on the number of peptide ratios that iTRAQ used to evaluate the protein abundance.
Using estimates for the abundance and corresponding standard deviation of these estimates in the fashion of a t-statistic, the proteins were ranked for group comparisons. Groups were evaluated in the manner of recursive partitioning [29] to evaluate a protein’s potential role in a decision rule for predicting the fibrosis stage of a future patient with HCV (Fig. 1). The initial comparison was between stage 0 and the combined group of stages 1–4 (i.e., normal versus abnormal). Subsequently, potential splits to separate stages 1–4 were evaluated, including the possibility of first dividing into stages 1–2 and stages 3–4, and then dividing between stage 1 and stage 2, and dividing between stage 3 and stage 4. Top-ranked proteins were further examined with visual inspection of relative abundance across fibrosis stages 0–4 and included consideration of complementary protein profiles (one selected with positive slope, and another complementary with negative slope).
Fig. 1.
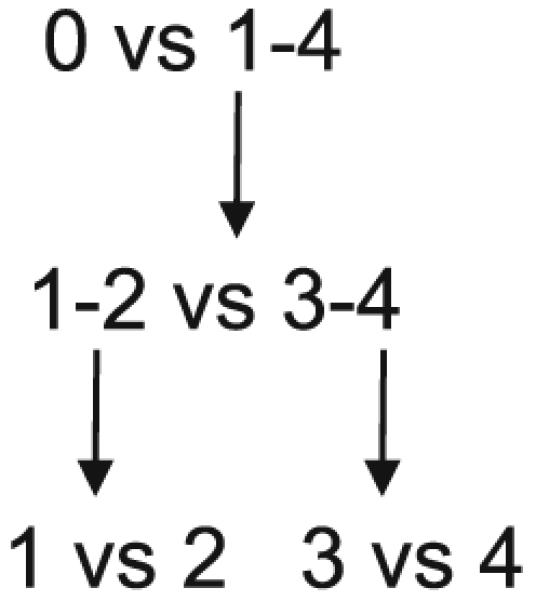
Fibrosis groups (0–4) were compared in recursive partitioning fashion as indicated. In Figs. 2, 3, 4, and 5, unshaded portions of the graphs indicate the two groups being compared, separated by a vertical dashed line
DIGE
Protein volumes from each gel were first normalized to a control sample. The normalized volumes were then compared between groups using a t-test. Visual inspection again complemented numerical analysis to select a set of proteins suggestive of the highest discriminatory potential. Group comparisons of fibrosis stages were done in a similar fashion as the results from iTRAQ using a recursive partitioning framework. The initial comparison was again stage 0 versus stages 1–4, and subsequently potential splits to distinguish between the four groups of stages 1–4 were evaluated (Fig. 1).
Results
DIGE and iTRAQ were used to identify the biomarkers for liver fibrosis. Serum was the primary sample in this project. Since high-abundance proteins disturb identification of low-abundance proteins, all samples were processed using a protein depletion column that removed the top 12 most abundant serum proteins before DIGE and iTRAQ analysis.
Identification of Biomarkers for Liver Fibrosis by DIGE
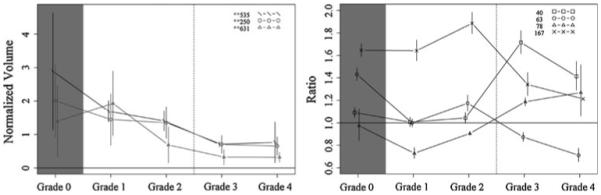
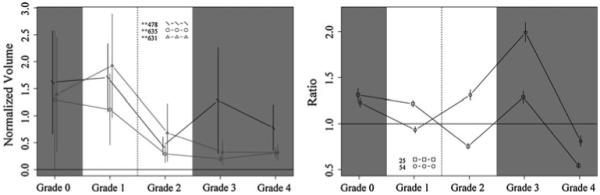
The DIGE was processed as described above, and the images of the gels were acquired using a Bio-Rad Molecular Imager FX system. Then the quantification analysis of protein spots from all 30 samples was processed with Decyder (GE Healthcare Bio-Sciences Corp., Piscataway, NJ). After statistical analysis, spots with P value <0.05 between any one of the five groups were reviewed by visual inspection. Strong spots were then excised and processed with MS identification. There were 135 proteins identified in 41 spots using LC/MS/MS analysis. All proteins were identified with a minimum of two peptides. Based on statistical analysis (Figs. 2, 3, 4, 5), the top protein candidates to predict fibrosis score in hepatitis C identified by DIGE are listed in Table 1. Proteins from spot numbers 399, 468, and 630 could be good candidates to discriminate hepatic fibrosis from controls (Fig. 2, left panel) and include nine proteins (complement factor H, haptoglobin, serum amyloid P-component, apolipoprotein A-I, complement C3, Ig kappa chain C region, tetranectin, kininogen-1, and dermcidin). Proteins from spots 535 (inter-alpha-trypsin inhibitor heavy chain H4, ficolin-3, complement C1r subcomponent, apolipoprotein E), 250 (prothrombin, complement C3, alpha-1-acid glycoprotein 2, complement C4-A), and 631 (desmoplakin, immunoglobulin J chain, actin cytoplasmic 1, junction plakoglobin) could be candidates to distinguish fibrosis that is stage 1–2 from stage 3–4 (Fig. 3, left panel). The proteins from spots 478 (complement factor H, haptoglobin, serum amyloid P-component, dermcidin), 635 (immunoglobulin J chain, desmoplakin, junction plakoglobin, dermcidin), and 631 (desmoplakin, immunoglobulin J chain, actin cytoplasmic 1, junction plakoglobin) could be candidates to discriminate fibrosis stage 1 from stage 2 (Fig. 4, left panel). The proteins from spots 471 (kininogen-1, clusterin, complement C3, haptoglobin) and 468 (complement factor H, haptoglobin, serum amyloid P-component) discriminate fibrosis stage 3 from stage 4 (Fig. 5, left panel). Since more than one protein were identified from each spot, the exact protein candidates remain unclear.
Fig. 2.

Protein profiles across fibrosis grades 0–4, showing the top candidates for discriminating grade 0 from grades 1–4, with DIGE (left) and iTRAQ (right). Proteins shown: DIGE spots 468 (complement factor H, haptoglobin, serum amyloid P-component), 630 (apolipoprotein A-I, complement C3, Ig kappa chain C region, tetranectin), and 399 (haptoglobin, serum amyloid P-component, kininogen-1, dermcidin); iTRAQ proteins 58 (complement component 8), 4 (complement component 4A), and 43 (insulin-like growth factor binding protein). Vertical bars indicate 95% confidence intervals
Fig. 3.
Protein profiles across fibrosis grades showing the top candidates for discriminating grade 1–2 from grades 3–4, with DIGE (left) and iTRAQ (right). Proteins shown: DIGE spots 535 (inter-alpha-trypsin inhibitor heavy chain H4, ficolin-3, complement C1r subcomponent, apolipoprotein E), 250 (prothrombin, complement C3, alpha-1-acid glycoprotein 2, complement C4-A), and 631 (desmoplakin, immunoglobulin J chain, actin cytoplasmic 1, junction plakoglobin); iTRAQ proteins 40 (lumican), 63 (pro-platelet basic protein), 78 (cell adhesion molecule—homology to L1CAM), and 167 (PTK2B protein tyrosine kinase 2 beta). Vertical bars indicate 95% confidence intervals
Fig. 4.
Protein profiles across fibrosis grades showing the top candidates at discriminating grade 1 from grade 2, with DIGE (left) and iTRAQ (right). Proteins shown: DIGE spots 478 (complement factor H, haptoglobin, serum amyloid P-component, dermcidin), 635 (immunoglobulin J chain, desmoplakin, junction plakoglobin, dermcidin), and 631 (desmoplakin, immunoglobulin J chain, actin cytoplasmic 1, junction plakoglobin); iTRAQ proteins 25 [serine (or cysteine) proteinase inhibitor, clade C (antithrombin), member 1] and 54 [serine (or cysteine) proteinase inhibitor, clade A, member 7]. Vertical bars indicate 95% confidence intervals
Fig. 5.
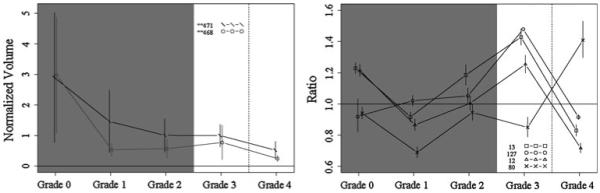
Protein profiles across fibrosis grades showing the top candidates at discriminating grade 3 from grade 4, with DIGE (left) and iTRAQ (right). Proteins shown: DIGE spots 471 (kininogen-1, clusterin, complement C3, haptoglobin) and 468 (complement factor H, haptoglobin, serum amyloid P-component); iTRAQ proteins 13 (vitamin D-binding protein), 127 (coagulation factor IX), 12 (inter-alpha-trypsin inhibitor heavy chain H4), and 80 (complement component 1, q subcomponent, gamma polypeptide). Vertical bars indicate 95% confidence intervals
Table 1.
Top protein candidates identified by DIGE
| Spot no.a | Proteins identified by DIGE |
|---|---|
| 250 | Prothrombin, complement C3, alpha-1-acid glycoprotein 2, antithrombin III, complement C4-A |
| 399 | Haptoglobin, serum amyloid P-component, kininogen-1, dermcidin |
| 468 | Complement factor H, haptoglobin, serum amyloid P-component |
| 471 | Kininogen-1, clusterin, complement C3, haptoglobin, vitamin D-binding protein |
| 478 | Complement factor H, haptoglobin, serum amyloid P-component, dermcidin |
| 535 | Inter-alpha-trypsin inhibitor heavy chain H4, ficolin-3, complement C1r subcomponent, apolipoprotein E |
| 630 | Apolipoprotein A-I, complement C3, Ig kappa chain C region, tetranectin |
| 631 | Desmoplakin, immunoglobulin J chain, actin cytoplasmic 1, junction plakoglobin |
| 635 | Immunoglobulin J chain, desmoplakin, junction plakoglobin, dermcidin |
Spot number refers to the spot on the gel which was excised and used for MS protein identification
Identification of Biomarkers for Liver Fibrosis by iTRAQ
Serum from normal controls and patients with hepatic fibrosis was analyzed with iTRAQ (fibrosis stage 0–4, six in each group). iTRAQ identified 305 proteins (minimum 99% ID confidence); the iTRAQ ratios comparing patients and controls demonstrated that 66 proteins were significantly increased or decreased in concentration compared with controls. The top protein candidates to predict hepatic fibrosis stage in hepatitis C identified by iTRAQ are listed in Table 2. Proteins 58 (complement component 8), 4 (complement component 4A), and 43 (insulin-like growth factor binding protein) are promising candidates to discriminate normal from fibrosis (Fig. 2, right panel). Proteins 40 (lumican), 63 (pro-platelet basic protein), 78 (cell adhesion molecule—homology to L1CAM), and 167 (PTK2B protein tyrosine kinase 2 beta) are promising candidates to discriminate fibrosis that is stage 1–2 from stage 3–4 (Fig. 3, right panel). Proteins 25 [serine (or cysteine) proteinase inhibitor, clade C (antithrombin), member 1] and 54 [serine (or cysteine) proteinase inhibitor, clade A, member 7] are promising candidates to discriminate fibrosis stage 1 from stage 2 (Fig. 4, right panel). Proteins 13 (vitamin D-binding protein), 127 (coagulation factor IX), 12 (inter-alpha-trypsin inhibitor heavy chain H4), and 80 (complement component 1, q subcomponent, gamma polypeptide) are promising candidates to discriminate fibrosis stage 3 from stage 4 (Fig. 5, right panel). With iTRAQ, the “unused score” is related to the total number of peptides used to identify a protein. All top protein candidates for fibrosis biomarkers, except protein 167, had unused scores of 2 or more, indicating high confidence of correct protein identification.
Table 2.
Top protein candidates identified by iTRAQ
| Unused scorea |
Accession number |
Proteins identified by iTRAQ |
|---|---|---|
| 103.88 | gi|67190748 | Complement component 4A preproprotein |
| 51.35 | gi|31542984 | Inter-alpha (globulin) inhibitor H4 |
| 47.74 | gi|32483410 | Vitamin D-binding protein precursor |
| 28.24 | gi|4502261 | Antithrombin III |
| 16.49 | gi|4505047 | Lumican precursor |
| 15.31 | gi|4826772 | Insulin-like growth factor binding protein, acid labile subunit |
| 10.21 | gi|4507377 | Serine (or cysteine) proteinase inhibitor, clade A, member 7 |
| 8.65 | gi|4557389 | Complement component 8, alpha polypeptide precursor |
| 8.19 | gi|4505981 | Pro-platelet basic protein precursor |
| 4.9 | gi|27894376 | Cell adhesion molecule with homology to L1CAM precursor |
| 4.18 | gi|56786155 | Complement component 1, q subcomponent, gamma polypeptide (complement component 1, q subcomponent, C chain) |
| 2 | gi|4503649 | Coagulation factor IX |
| 1.55 | gi|27886590 | PTK2B protein tyrosine kinase 2 beta isoform a |
The unused score is directly related to the total number of peptides used for identification of each protein
Candidate Biomarkers Identified by Both DIGE And iTRAQ
There were 13 proteins identified and chosen as candidates for liver fibrosis with iTRAQ in this project. Twelve of them were high-confidence protein identification (unused score ≥2). Literature review indicates that some of them have been related to fibrosis: some involved in inflammation and some involved with cell process for fibrosis (Table 3). Thus these candidate biomarkers are consistent with liver fibrosis pathological mechanisms and are high-potential fibrosis stage biomarkers. Since more than one protein was identified from one spot in the DIGE method, the fibrosis markers chosen from DIGE are not certain. However, if a protein is identified by DIGE as a potential biomarker to predict fibrosis stage and is also identified as a biomarker candidate based on iTRAQ, this strengthens its potential value as a fibrosis biomarker. Four proteins were found in both the iTRAQ and DIGE top protein candidate lists: complement component 4A, inter-alpha (globulin) inhibitor H4, vitamin D-binding protein precursor, and serine (or cysteine) proteinase inhibitor, clade C, member 1 (also known as antithrombin III). Coagulation factor IX was in the top protein candidate list by iTRAQ and was identified by DIGE but did not make the DIGE top protein candidate list. Complement component 4A is promising to discriminate normal from fibrosis; Antithrombin III and coagulation factor IX are promising to discriminate fibrosis stage 1 from stage 2. Inter-alpha (globulin) inhibitor H4 and vitamin D-binding protein are promising to discriminate fibrosis stage 3 from stage 4.
Table 3.
Functions of top protein candidates identified by iTRAQ
| Protein | Function |
|---|---|
| Complement component 4A | Part of the complement system; plays an important role in the pathogenesis of alcoholic liver fibrosis |
| Inter-alpha-trypsin inhibitor heavy chain H4 | Suggested fibrosis biomarker |
| Vitamin D-binding protein | Actin scavenging, fatty acid transport, macrophage activation, and chemotaxis |
| Serine (or cysteine) proteinase inhibitor, clade C (antithrombin), member 1 |
Neuronal cell death, angiogenesis |
| Lumican | Regulates collagen fibril assembly |
| Insulin-like growth factor binding protein | Binds IGF and modulators of IGF’s availability and activity. Important for cell growth |
| Serine (or cysteine) proteinase inhibitor, clade A, member 7 |
Thyroid binding globulin. Important for growth and metabolism |
| Complement component 8 | Part of the complement system; plays an important role in the pathogenesis of alcoholic liver fibrosis |
| Pro-platelet basic protein | Response to inflammation, may be involved in coagulation |
| Cell adhesion molecule homology to L1CAM | L1 cell adhesion molecules are related to organization of neurons |
| Complement component 1, q subcomponent, gamma polypeptide |
Part of the complement system; plays an important role in the pathogenesis of alcoholic liver fibrosis |
| Coagulation factor IX | Important for hemostasis |
| PTK2B protein tyrosine kinase 2 beta | Regulator of keratinocyte differentiation, cancer cell growth |
Discussion
This study hinges upon accurate fibrosis staging of the liver biopsy. This determination is related to the quality of the liver biopsy and can be affected by sampling variability and the variability of the reading. All our biopsies were read by one experienced pathologist who only graded fibrosis if an acceptable liver sample was obtained.
Proteomic methods to remove or separate high-abundance serum proteins and to increase the dynamic range available for identification and characterization of serum proteins [18, 30] indicate that more than 800 proteins can be identified from a single 5 μl serum sample. In addition, with the recognition that serum may contain as many as 10,000 proteins, it is highly likely that new proteins will be identified in serum and related to various conditions of health and disease. We utilized two different proteomic approaches to search for serum proteins that differ according to the degree of fibrosis present in liver biopsies collected simultaneous with the serum. In the present study we independently identified nine 2-DE spots which included 21 proteins using DIGE (Table 1) and 12 proteins using iTRAQ (Table 2) that are related to the degree of fibrosis in simultaneous liver biopsies.
An NIH conference on hepatitis C asserted that evaluation of progressive fibrosis will best be accomplished with noninvasive tests capable of discriminating intermediate stages of fibrosis and strongly encouraged the development of noninvasive dynamic measures of hepatic fibrosis [12]. To date, noninvasive indices used to identify significant fibrosis include routinely available laboratory tests, such as liver-associated chemistries, platelet count, and prothrombin time, as well as specific serum markers of fibrosis and inflammation not widely available or well validated. The NIH consensus statement observed that no current single test or panel of serologic markers can provide an accurate assessment of intermediate stages of hepatic fibrosis [12]. Similarly, quantitative tests of liver function and radiologic imaging of the liver are sensitive for diagnosing advanced cirrhosis but are not useful in assessing hepatic fibrosis and early cirrhosis. To our knowledge, our study is the first to compare two contemporary proteomic techniques in order to identify new biomarker candidates to predict hepatic fibrosis.
A narrower approach to predict hepatic fibrosis with serum markers was described by Imbert-Bismut et al. [31]. A profile of 17 serum markers (mostly proteins) was measured in a large cohort of HCV-infected patients in whom simultaneous liver biopsy was obtained. The serum markers assessed were: α2 macroglobulin, aspartate aminotransferase, alanine aminotransferase, γ glutamyltrans-peptidase, total bilirubin, albumin, α1 globulin, α2 globulin, β globulin, γ globulin, apolipoprotein A-I, haptoglobin, interleukin 10, tumor growth factor β1, hepatocyte growth factor, apolipoprotein A-II, and apolipoprotein B. It is unclear how these 17 proteins were selected, but many are high-abundance proteins. Our proteomic method represents a more unbiased approach, since all proteins that could be detected and identified with DIGE or iTRAQ were evaluated. Imbert-Bismut et al. scored hepatic fibrosis from 0 to 4 according to the METAVIR group scoring system [32,33]. Statistical analysis utilizing logistic regression, neural connections, and receiver-operating curves identified the six most informative markers as α2 macroglobulin, haptoglobin, γ globulin, apolipoprotein A-I, γ glutamyltrans-peptidase, and total bilirubin. The authors suggested that, by using this combination of basic serum markers, named the FibroTest [34], fibrosis could be predicted and the number of liver biopsies done in patients with chronic HCV infection could be substantially reduced. To date, attempts at independent validation of this fibrosis predicting method have concluded that the FibroTest could not accurately predict the presence or absence of significant hepatic fibrosis [35].
A more recent noninvasive index to predict both significant fibrosis and cirrhosis in patients with chronic hepatitis C has been developed by Wai et al. [36]. The variables included in this index were platelet count, aspartate aminotransferase (AST), alkaline phosphatase, and determination of the AST-to-platelet ratio index (APRI). However, the APRI predicted significant fibrosis accurately in only 51% of treatment-naïve chronic hepatitis C patients and was shown to be less accurate than the FibroTest [37].
Four candidate biomarkers of fibrosis identified with both DIGE and iTRAQ included inter-alpha (globulin) inhibitor H4, vitamin D-binding protein, serine (or cysteine) proteinase inhibitor clade C member 1 (antithrombin III), and complement component 4A. Inter-alpha-trypsin inhibitor heavy chain H4 has been suggested to be associated with hepatic fibrosis based on a 2-D gel electrophoresis study [19]. Vitamin D-binding protein plays a role in vitamin metabolism and has been suggested to be related to liver fibrosis [38, 39]. Patients with progressive liver disease have low plasma levels of antithrombin III [40, 41], which is synthesized by hepatocytes and plays a role in both thrombosis [42, 43] and the inflammatory process [44]. Thrombotic risk factors have been found to be associated with the extent of hepatic fibrosis [45]. The human complement system plays a crucial role in defense against infectious diseases and also in inflammatory processes. The complement system comprises numerous plasma proteins, including the fourth complement component (C4), an essential factor in the activation cascades of the complement system [46]. Several other complement components were also identified by one method only and are described below.
Coagulation factor IX is in the top candidate list from iTRAQ and was also identified by DIGE, though it did not make the DIGE top candidate list. Complement component 4A appears to be a candidate to discriminate normal from fibrosis. Inter-alpha (globulin) inhibitor H4 and vitamin D-binding protein appear to be candidates to discriminate stage 3 from stage 4 fibrosis. Antithrombin III and coagulation factor IX appear to be candidates to discriminate stage 1 from stage 2 fibrosis. In the final DIGE and iTRAQ models related to fibrosis, two proteins were independently selected for greatest discrimination potential by both DIGE and iTRAQ: complement C4-A and inter-alpha-trypsin inhibitor heavy chain H4. Both of these proteins have recently been suggested by Gangadharan et al. as novel serum biomarker candidates for liver fibrosis in hepatitis C patients [19]. The other proteins that Gangadharan et al. suggested as candidate biomarkers for fibrosis in hepatitis C which we identified by DIGE include complement C3 and haptoglobin but none of the other 17 proteins. None of the other 11 proteins we identified as candidate biomarkers for fibrosis in hepatitis C were identified by Gangadharan et al.
Fibrospect II, a panel of three fibrosis markers (hyaluronic acid, tissue inhibitor of metalloproteinases 1, and alpha-2-macroglobulin), was assessed to differentiate mild (F0-F1) from significant (F2-F4) fibrosis and found to detect significant fibrosis, with area under the receiver-operating characteristic (ROC) curve of 0.826, sensitivity of 71.8%, specificity of 73.9%, positive predictive value of 60.9%, negative predictive value of 82.3%, and overall accuracy of 73.1% [47]. Alpha-2-macroglobulin is a high-abundance protein that we removed early in our analysis in order to study lower-abundance proteins. The other two Fibrospect II proteins were not identified as fibrosis markers in this study.
Within these proteins of interest we identified three proteins related to the six markers used in the FibroTest [48]: haptoglobin, γ globulin, and apolipoprotein A-I. Our proteomics approach utilized carefully chosen serum samples from 30 individuals. An additional potential advantage of this proteomics approach is that all detectable serum proteins are included in this analysis. Further, the proteomics approach can identify proteins undergoing modification, which might provide additional important information about the pathophysiologic processes taking place. The next step will be to develop quantitative assays [e.g., enzyme-linked immunosorbent assay (ELISA)] for each individual protein of interest and correlate these data with the fibrosis scores of simultaneous liver biopsies in an independent group of patients.
As proteomics continues to advance, more sensitive methods should allow identification of greater numbers of proteins that are expressed differentially in hepatitis C. In our approach, we studied proteins by two independent methods—one gel-based (DIGE) and one non-gel-based (iTRAQ). Although DIGE makes comparison across gels easy [49], one problem is that the 9 spots of interest contained a total of 21 different proteins and averaged 4 different proteins per spot. The iTRAQ method did not have this problem, and the ratios derived from the MS data allowed direct comparisons between fibrosis groups. Proteomics offers great potential to provide new useful information relating to the fibrosis of hepatitis C.
Conclusions
Protein spots identified by DIGE contained high-abundance proteins which could not be completely removed from serum. The nine protein spots in the final DIGE models related to fibrosis each contained 3–5 different proteins per spot. Determination of specific protein candidates with DIGE is difficult because of the high-abundance proteins present and multiple proteins per spot. In the final DIGE and iTRAQ models related to fibrosis, two proteins were selected for greatest discrimination potential by both DIGE and iTRAQ: complement C4-A and inter-alpha-trypsin inhibitor heavy chain H4. iTRAQ offers advantages over DIGE in that the results are more specific (multiple proteins per spot in DIGE is a problem) and sample processing is more efficient. The proteins identified by iTRAQ appear more promising as potential candidates to discriminate fibrosis stage than the proteins identified by DIGE because of the specific changes seen with iTRAQ.
Acknowledgments
This paper was presented in part at the American Association for the Study of Liver Disease, San Francisco, November 3, 2008, and was supported by NIH grant DK069943.
Abbreviations
- iTRAQ
Isobaric tags for relative and absolute quantitation
- DIGE
Difference in gel electrophoresis
- HCV
Hepatitis C virus
Contributor Information
Libang Yang, Department of Pediatrics, University of Minnesota, 420 Delaware St. SE, MMC 185, Minneapolis, MN 55455, USA; yangx822@umn.edu.
Kyle D. Rudser, Department of Biostatistics, University of Minnesota, Minneapolis, MN, USA, rudser@umn.edu
LeeAnn Higgins, Departments of Biochemistry, Molecular Biology and Biophysics, University of Minnesota, Minneapolis, MN, USA, higgi022@umn.edu.
Hugo R. Rosen, Department of Medicine, University of Colorado, Denver, CO, USA, Hugo.Rosen@ucdenver.edu
Atif Zaman, Department of Medicine, OHSU, Portland, OR, USA, zamana@ohsu.edu.
Christopher L. Corless, Department of Pathology, OHSU, Portland, OR, USA, corlessc@ohsu.edu
Larry David, Department of Biochemistry and Molecular Biology, OHSU, Portland, OR, USA, davidl@ohsu.edu.
Glenn R. Gourley, Department of Pediatrics, University of Minnesota, 420 Delaware St. SE, MMC 185, Minneapolis, MN 55455, USA
References
- 1.Liang TJ, Reherman B, Seeff LB, Hoofnagle JH. Pathogenesis, natural history, treatment and prevention of hepatitis C. Ann Intern Med. 2000;132:296–305. doi: 10.7326/0003-4819-132-4-200002150-00008. [DOI] [PubMed] [Google Scholar]
- 2.Poynard T, Bedossa P, Opolon P. Natural history of liver fibrosis progression in patients with chronic hepatitis C. Lancet. 1997;349:825–832. doi: 10.1016/s0140-6736(96)07642-8. [DOI] [PubMed] [Google Scholar]
- 3.Seaberg EC, Belle SH, Beringer KC, et al. Liver transplantation in the United States from 1987–1998: updated results from the Pitt-UNOS Liver Transplant Registry. In: Cecka M, Terasaki PI, editors. Clinical Transplants. UCLA Tissue Typing Laboratory; Los Angeles: 1998. [PubMed] [Google Scholar]
- 4.Ghany MG, Kleiner DE, Alter H, et al. Progression of fibrosis in chronic hepatitis C. Gastroenterology. 2003;124:97–104. doi: 10.1053/gast.2003.50018. [DOI] [PubMed] [Google Scholar]
- 5.Neal KR, Ramsay S, Thomson BJ, Irving WL. Excess mortality rates in a cohort of patients infected with the hepatitis C virus: a prospective study. Gut. 2007;56:1098–1104. doi: 10.1136/gut.2006.113217. [DOI] [PMC free article] [PubMed] [Google Scholar]
- 6.Schuppan D, Afdhal NH. Liver cirrhosis. Lancet. 2008;371:838–851. doi: 10.1016/S0140-6736(08)60383-9. [DOI] [PMC free article] [PubMed] [Google Scholar]
- 7.Poynard T, McHutchison J, Manns M, Myers RP, Albrecht J. Biochemical surrogate markers of liver fibrosis and activity in a randomized trial of peginterferon alfa-2b and ribavirin. Hepatology. 2003;38:481–492. doi: 10.1053/jhep.2003.50319. [DOI] [PubMed] [Google Scholar]
- 8.Thein HH, Yi Q, Dore GJ, Krahn MD. Estimation of stage-specific fibrosis progression rates in chronic hepatitis C virus infection: a meta-analysis and meta-regression. Hepatology. 2008;48:418–431. doi: 10.1002/hep.22375. [DOI] [PubMed] [Google Scholar]
- 9.Yano M, Kumada H, Kage M, et al. The long-term pathological evolution of chronic hepatitis C. Hepatology. 1996;23:1334–1340. doi: 10.1002/hep.510230607. [DOI] [PubMed] [Google Scholar]
- 10.Janiec DJ, Jacobson ER, Freeth A, Spaulding L, Blaszyk H. Histologic variation of grade and stage of non-alcoholic fatty liver disease in liver biopsies. Obes Surg. 2005;15:497–501. doi: 10.1381/0960892053723268. [DOI] [PubMed] [Google Scholar]
- 11.Piccinino F, Sagnelli E, Pasquale G, Giusti G. Complications following percutaneous liver biopsy. A multicentre retrospective study on 68, 276 biopsies. J Hepatol. 1986;2:165–173. doi: 10.1016/s0168-8278(86)80075-7. [DOI] [PubMed] [Google Scholar]
- 12.Anonymous National institutes of health consensus development conference statement: management of hepatitis C 2002. Gastroenterology. 2002;123:2082–2099. doi: 10.1053/gast.2002.1232082. [DOI] [PubMed] [Google Scholar]
- 13.Guha IN, Parkes J, Roderick P, et al. Noninvasive markers of fibrosis in nonalcoholic fatty liver disease: validating the European liver fibrosis panel and exploring simple markers. Hepatology. 2008;47:455–460. doi: 10.1002/hep.21984. [DOI] [PubMed] [Google Scholar]
- 14.Popov Y, Schuppan D. Targeting liver fibrosis: strategies for development and validation of antifibrotic therapies. Hepatology. 2009;50:1294–1306. doi: 10.1002/hep.23123. [DOI] [PubMed] [Google Scholar]
- 15.Thome-Kromer B, Bonk I, Klatt M, et al. Toward the identification of liver toxicity markers: a proteome study in human cell culture and rats. Proteomics. 2003;3:1835–1862. doi: 10.1002/pmic.200300552. [DOI] [PubMed] [Google Scholar]
- 16.Marko-Varga G, Berglund M, Malmstrom J, Lindberg H, Fehniger TE. Targeting hepatocytes from liver tissue by laser capture microdissection and proteomics expression profiling. Electrophoresis. 2003;24:3800–3805. doi: 10.1002/elps.200305645. [DOI] [PubMed] [Google Scholar]
- 17.Cyranoski D. China takes centre stage for liver proteome. Nature. 2003;425:441. doi: 10.1038/425441a. [DOI] [PubMed] [Google Scholar]
- 18.Adkins JN, Varnum SM, Auberry KJ, et al. Toward a human blood serum proteome: analysis by multidimensional separation coupled with mass spectrometry. Molecular & Cellular Proteomics. 2002;1:947–955. doi: 10.1074/mcp.m200066-mcp200. [DOI] [PubMed] [Google Scholar]
- 19.Gangadharan B, Antrobus R, Dwek RA, Zitzmann N. Novel serum biomarker candidates for liver fibrosis in hepatitis C patients. Clin Chem. 2007;53:1792–1799. doi: 10.1373/clinchem.2007.089144. [DOI] [PubMed] [Google Scholar]
- 20.Burtis CA, Ashwood ER. Tietz Fundamentals of Clinical Chemistry. W.B. Saunders; Philadelphia: 2001. [Google Scholar]
- 21.Wrotnowski C. The future of plasma proteins. Genet Eng News. 1998;18:14. [Google Scholar]
- 22.Anderson NL, Anderson NG. The human plasma proteome: history, character, and diagnostic prospects. Mol Cell Proteomics. 2003;1:845–867. doi: 10.1074/mcp.r200007-mcp200. [DOI] [PubMed] [Google Scholar]
- 23.Marouga R, David S, Hawkins E. The development of the DIGE system: 2D fluorescence difference gel analysis technology. Anal Bioanal Chem. 2005;382:669–678. doi: 10.1007/s00216-005-3126-3. [DOI] [PubMed] [Google Scholar]
- 24.Aggarwal K, Choe LH, Lee KH. Shotgun proteomics using the iTRAQ isobaric tags. Brief Funct Genomic Proteomic. 2006;5:112–120. doi: 10.1093/bfgp/ell018. [DOI] [PubMed] [Google Scholar]
- 25.Batts KP, Ludwig J. Chronic Hepatitis: an update on terminology and reporting. Am J Surg Pathol. 1995;19:1409–1417. doi: 10.1097/00000478-199512000-00007. [DOI] [PubMed] [Google Scholar]
- 26.Yates JR, III, Eng JK, McCormack AL, Schieltz D. Method to correlate tandem mass spectra of modified peptides to amino acid sequences in the protein database. Anal Chem. 1995;67:1426–1436. doi: 10.1021/ac00104a020. [DOI] [PubMed] [Google Scholar]
- 27.Gasteiger E, Gattiker A, Hoogland C, Ivanyi I, Appel RD, Bairoch A. ExPASy: the proteomics server for in-depth protein knowledge and analysis. Nucleic Acids Res. 2003;31:3784–3788. doi: 10.1093/nar/gkg563. [DOI] [PMC free article] [PubMed] [Google Scholar]
- 28.Tabb DL, McDonald WH, Yates JR., III. DTASelect and Contrast: tools for assembling and comparing protein identifications from shotgun proteomics. J Proteome Res. 2002;1:21–26. doi: 10.1021/pr015504q. [DOI] [PMC free article] [PubMed] [Google Scholar]
- 29.Breiman L, Friedman J, Olshen R, et al. Classification and Regression Trees. Wadsworth and Brooks; Belmont, CA: 1984. [Google Scholar]
- 30.Shen Y, Jacobs JM, Camp DG, et al. Ultra-high-efficiency strong cation exchange LC/RPLC/MS/MS for high dynamic range characterization of the human plasma proteome. Anal Chem. 2004;76:1134–1144. doi: 10.1021/ac034869m. [DOI] [PubMed] [Google Scholar]
- 31.Imbert-Bismut F, Ratziu V, Pieroni L, Charlotte F, Benhamou Y, Poynard T. Biochemical markers of liver fibrosis in patients with hepatitis C virus infection: a prospective study. Lancet. 2001;357:1069–1075. doi: 10.1016/S0140-6736(00)04258-6. [DOI] [PubMed] [Google Scholar]
- 32.Bedossa P, Poynard T, The METAVIR Cooperative Study Group. The METAVIR Cooperative Study Group An algorithm for the grading of activity in chronic hepatitis C. Hepatology. 1996;24:289–293. doi: 10.1002/hep.510240201. [DOI] [PubMed] [Google Scholar]
- 33.The French METAVIR Cooperative Study Group Intraobserver and interobserver variations in liver biopsy interpretation in patients with chronic hepatitis C. Hepatology. 1994;20:15–20. [PubMed] [Google Scholar]
- 34.Halfon P, Imbert-Bismut F, Messous D, et al. A prospective assessment of the inter-laboratory variability of biochemical markers of fibrosis (FibroTest) and activity (ActiTest) in patients with chronic liver disease. Compar Hepatol. 2002;1:3. doi: 10.1186/1476-5926-1-3. [DOI] [PMC free article] [PubMed] [Google Scholar]
- 35.Rossi E, Adams L, Prins A, et al. Validation of the FibroTest biochemical markers score in assessing liver fibrosis in hepatitis C patients. Clin Chem. 2003;49:450–454. doi: 10.1373/49.3.450. [DOI] [PubMed] [Google Scholar]
- 36.Wai CT, Greenson JK, Fontana RJ, et al. A simple noninvasive index can predict both significant fibrosis and cirrhosis in patients with chronic hepatitis C. Hepatology. 2003;38:518–526. doi: 10.1053/jhep.2003.50346. [DOI] [PubMed] [Google Scholar]
- 37.Le Calvez S, Thabut D, Messous D, et al. The predictive value of Fibrotest vs. APRI for the diagnosis of fibrosis in chronic hepatitis C. Hepatology. 2004;39:862–863. doi: 10.1002/hep.20099. [DOI] [PubMed] [Google Scholar]
- 38.Gressner OA, Gao C, Siluschek M, Kim P, Gressner AM. Inverse association between serum concentrations of actin-free vitamin D-binding protein and the histopathological extent of fibrogenic liver disease or hepatocellular carcinoma. Eur J Gastroenterol Hepatol. 2009;21:990–995. doi: 10.1097/MEG.0b013e3283293769. [DOI] [PubMed] [Google Scholar]
- 39.Kawai N, Matsumoto H. Vitamin-D binding protein levels in liver cirrhosis, chronic hepatitis, and rheumatoid arthritis. Nihon Hoigaku Zasshi. 1984;38:797–803. [PubMed] [Google Scholar]
- 40.Ben Ari Z, Osman E, Hutton RA, Burroughs AK. Disseminated intravascular coagulation in liver cirrhosis: fact or fiction? Am J Gastroenterol. 1999;94:2977–2982. doi: 10.1111/j.1572-0241.1999.01446.x. [DOI] [PubMed] [Google Scholar]
- 41.Papatheodoridis GV, Papakonstantinou E, Andrioti E, et al. Thrombotic risk factors and extent of liver fibrosis in chronic viral hepatitis. Gut. 2003;52:404–409. doi: 10.1136/gut.52.3.404. [DOI] [PMC free article] [PubMed] [Google Scholar]
- 42.Mouelhi L, Mekki H, Debbeche R, Salem M, Najjar T. Thrombosis in inflammatory bowel disease: mechanisms and risk factors. Tunis Med. 2009;87:307–310. [PubMed] [Google Scholar]
- 43.Chrusciel P, Goch A, Banach M, Mikhailidis DP, Rysz J, Goch JH. Circadian changes in the hemostatic system in healthy men and patients with cardiovascular diseases. Med Sci Monit. 2009;15:RA203–RA208. doi: 10.12659/msm.878203. [DOI] [PubMed] [Google Scholar]
- 44.Maksan SM, Ulger Z, Gebhard MM, Schmidt J. Impact of antithrombin III on hepatic and intestinal microcirculation in experimental liver cirrhosis and bowel inflammation: an in vivo analysis. World J Gastroenterol. 2005;11:4997–5001. doi: 10.3748/wjg.v11.i32.4997. [DOI] [PMC free article] [PubMed] [Google Scholar]
- 45.Calvaruso V, Maimone S, Gatt A, et al. Coagulation and fibrosis in chronic liver disease. Gut. 2008;57:1722–1727. doi: 10.1136/gut.2008.150748. [DOI] [PubMed] [Google Scholar]
- 46.Szilagyi A, Blasko B, Ronai Z, Fust G, Sasvari-Szekely M, Guttman A. Rapid quantification of human complement component C4A and C4B genes by capillary gel electrophoresis. Electrophoresis. 2006;27:1437–1443. doi: 10.1002/elps.200500779. [DOI] [PubMed] [Google Scholar]
- 47.Zaman A, Rosen HR, Ingram K, Corless CL, Oh E, Smith K. Assessment of FIBROSpect II to detect hepatic fibrosis in chronic hepatitis C patients. Am J Med. 2007;120(280):e9–14. doi: 10.1016/j.amjmed.2006.06.044. [DOI] [PubMed] [Google Scholar]
- 48.Gressner OA, Beer N, Jodlowski A, Gressner AM. Impact of quality control accepted inter-laboratory variations on calculated Fibrotest/Actitest scores for the non-invasive biochemical assessment of liver fibrosis. Clin Chim Acta. 2009;409:90–95. doi: 10.1016/j.cca.2009.09.005. [DOI] [PubMed] [Google Scholar]
- 49.Van den Bergh G, Arckens L. Fluorescent two-dimensional difference gel electrophoresis unveils the potential of gel-based proteomics. Curr Opin Biotechnol. 2004;15:38–43. doi: 10.1016/j.copbio.2003.12.001. [DOI] [PubMed] [Google Scholar]