Abstract
A docking-rescoring method, based on per-residue van der Waals (VDW), electrostatic (ES), or hydrogen bond (HB) energies has been developed to aid discovery of ligands that have interaction signatures with a target (footprints) similar to that of a reference. Biologically useful references could include known drugs, inhibitors, substrates, transition states, or side-chains that mediate protein-protein interactions. Termed footprint similarity (FPS) score, the method, as implemented in the program DOCK, was validated and characterized using: (1) pose identification, (2) crossdocking, (3) enrichment, and (4) virtual screening. Improvements in pose identification (6–12%) were obtained using footprint-based (FPSVDW+ES) vs standard DOCK (DCEVDW+ES) scoring as evaluated on three large datasets (680–775 systems) from the SB2010 database. Enhanced pose identification was also observed using FPS (45.4% or 70.9%) compared with DCE (17.8%) methods to rank challenging crossdocking ensembles from carbonic anhydrase. Enrichment tests, for three representative systems, revealed FPSVDW+ES scoring yields significant early fold enrichment in the top 10% of ranked databases. For EGFR, top FPS poses are nicely accommodated in the molecular envelope defined by the reference in comparison with DCE which yields distinct molecular weight bias towards larger molecules. Results from a representative virtual screen of ca. 1 million compounds additionally illustrate how ligands with footprints similar to a known inhibitor can readily be identified from within large commercially available databases. By providing an alternative way to rank ligand poses in a simple yet directed manner we anticipate that FPS scoring will be a useful tool for docking and structure-based design.
Keywords: Molecular Footprints, Molecular Fingerprints, Pose Comparison, Pose Rescoring, Docking, Virtual Screening, Enrichment, ROC Curves, Euclidean Distance, Pearson Correlation
Introduction
A primary role of a docking program is as a virtual screening tool to help identify biologically active compounds.1–3 Binding geometries (termed poses) are predicted for candidate ligands with a target and metrics such as intermolecular interaction energy are used to identify (via rank-ordering) the best scoring molecules. Thus, docking programs can be thought of as filters, through which large databases (on the order of millions) may be passed, to isolate property-enriched subsets for further evaluation.4,5 To evaluate the accuracy of programs and protocols,6 two main experiments termed pose identification7 and database enrichment8 are used. To assess pose identification accuracy, crystallographic ligand-receptor complexes are used as controls to determine if the docking program can reproduce the correct ligand geometry (typically ≤ 2 Å rmsd) and whether that pose is ranked best.7 To assess database enrichment, a group of active ligands (affinity to the target has been confirmed) is seeded into a large group of decoy molecules (no affinity to the target is presumed) to determine if the rank-ordered list of molecules (active and inactives) will contain, with high probability, the known binders among the more favorably scored list elements.8
Programs such as DOCK,9,10 often use a physics-based energy function consisting of electrostatic (Coulombic) and steric (van der Waals) terms with the total sum of pairwise intermolecular interactions being used as the basis for rank-ordering. Alternatively, rank-ordering methods could employ known binding determinates (i.e. pharmacophores) to help identify compounds that interact with a target in a specific way which is not solely based on an energetic sum. This study explores the utility of using residue-based decompositions of electrostatic, steric, and hydrogen bonding interactions to derive 2-D pharmacophores (termed here as molecular footprints) as shown schematically in Figure 1. In general, a footprint may be thought of as a unique interaction signature between any two species. Further, as the sum of the residue-based contributions is equal to the overall total interaction energy, the breakdown enables identification of the amino acids which are likely to be most important for molecular recognition.
Figure 1.
Representative molecular footprints for (a) a single ligand, (b) a single ligand with two conformations, and (c) two different ligands derived from per-residue decomposition of the intermolecular van der Waals interactions as a function of primary sequence. For two footprints, similarity may be quantified using Pearson correlation coefficient (r), Euclidean distance (d), or related measures. For clarity, only a portion of the footprints are shown.
Footprints consist of a string of residue numbers, each with an associated intensity (Figure 1a), thus the correspondence between any two strings can easily be quantified (Figure 1b–c) using familiar metrics such as Pearson correlation or Euclidean distance. Comparisons can be between two conformations of the same molecule (Figure 1b) or between two different ligands (Figure 1c). Termed here footprint similarity (FPS) score, several potentially useful applications for virtual screening are envisioned with the general focus being identification of small organic molecules that score highly in comparison to a known reference compound. The footprint comparison shown in Figure 1c is between the FDA approved drug erlotinib (red pose) and an experimental kinase inhibitor (green pose). Table I lists possible sources of reference footprints including those derived from a known drug or inhibitor, a native substrate or cofactor, a transition state, or key side chains which mediate protein-protein interactions. Footprints can be manually modified, to decrease the importance a given side-chain prone to mutate may have in molecular recognition, which could assist identification of compounds with enhanced resistance profiles. Finally, use of ensemble or average-weighted footprints, derived from multiple crystal structures or molecular dynamics/Monte Carlo simulations, could be used to account for receptor flexibility.
Table I.
Examples of possible reference types to derive molecular footprints.
| Reference Types | Description |
|---|---|
| Known inhibitor | FDA-approved drug or experimental inhibitor validated to bind |
| Natural substrate | Native peptide or cofactor |
| Transition state | Predicted transition state geometry for a chemical reaction |
| Modified structure | Key functionality/substructure (side-chain mediating protein-protein interactions) |
| Text file footprint | Modified entries to increase/decrease importance of select residues (resistance mutations) |
| Ensemble-weighted | Averaged footprints derived from MD/MC simulations |
Our laboratory11–14 and others15–18 have successfully used footprint-like methods in the context of molecular dynamics and Monte Carlo simulations to help identify key residues involved in molecular recognition. Related approaches have also been reported for use in docking with the distinction that these have typically employed binary bit-string representations (termed interaction fingerprints)19–29 instead of energy-based decompositions as used here. Specifically, Deng et al19 introduced the SIFt method which employs a Tanimoto metric to compute the similarity between two bit strings derived from the presence or absence of seven interaction types occurring at a given residue. The SIFt method and various extensions21,22,27 have been shown to be useful for identifying native ligand poses, protein-family clustering, database enrichment, and library design. Other bit-string related procedures have also been reported.20,23–26,28 For example, Pfeffer et al25 has recently reported a method based on a per-atom partitioning of the scoring function DrugScoreCSD, which was shown to yield improved results for pose identification and enrichment compared with several other methods tested.
A long term goal of our laboratory is the development of method and protocols to increase the accuracy of docking methods used in virtual screening. The primary objectives of this work are to: (i) introduce and test methods to compute footprint similarity (FPS) scores as implemented into the program DOCK,10 (ii) evaluate pose identification accuracy using the recently reported SB20107 database developed in our laboratory, (iii) and characterize database enrichment properties using representative systems from the DUD8 database. It should be emphasized that this is a post-processing technique for molecules already docked and is simply an alternative method which facilitates re-ranking by footprint similarity. It is also important to note that FPS scoring makes use of the underlying physics-based energy function in DOCK and involves no additional parameterization beyond that used in any standard molecular mechanics force field.
Theoretical Methods
Footprint Comparisons
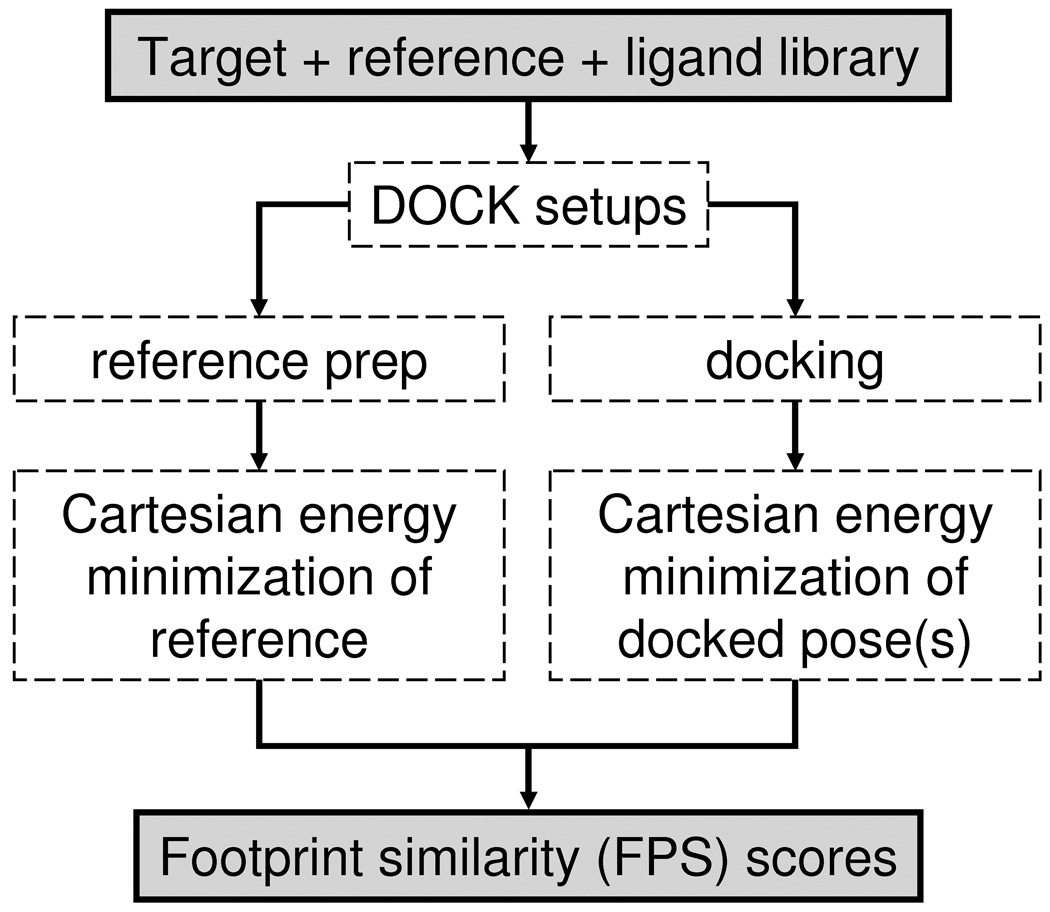
Footprint similarity (FPS) scores in this work are built from three scoring descriptors: van der Waals energies (VDW), Coulombic energies scaled by a distance dependent dielectric constant (ES), and hydrogen bond energies (HB). Consensus scores based on two (FPSVDW+ES = FPSVDW + FPSES) or three (FPSVDW+ES+HB = FPSVDW + FPSES + FPSHB) terms were also evaluated. The general schematic for computing FPS scores is shown in Figure 2. The procedure involves setting up the system for DOCK calculations, preparation of a reference molecule, and generation of candidate poses (see Computational Details section). It is important to note footprints are decompositions in Cartesian space, thus Cartesian energy minimizations are recommended for both the crystallographic reference and candidate poses. A footprint is defined as a vector x⃗ = [x1, …, xN] where N is the number of residues in the receptor and xi is the interaction energy between the ith residue and the ligand. To quantify the likeness between two footprint vectors x⃗ and y⃗, four different methods for computing similarity were evaluated: standard Euclidean Distance, normalized Euclidean Distance, standard Pearson Correlation, and threshold Pearson Correlation. It should be emphasized that the different comparison methods and combinations produce FPS scores with different ranges as summarized in Table II and described further below.
Figure 2.
Flow chart outlining FPS calculation protocol.
Table II.
Comparison methods and corresponding ranges for footprint similarity (FPS) scores.
| Rangesa | |||
|---|---|---|---|
| Comparison Method | FPSVDW, FPSES, FPSHB | FPSVDW+ES | FPSVDW+ES+HB |
| Standard Euclidean (d) | [0, ∞) | [0, ∞) | [0, ∞) |
| Normalized Euclidean (dnorm) | [0, 2] | [0, 4] | [0, 6] |
| Standard Pearson (r) | [−1, 1] | [−2, 2] | [−3, 3] |
| Threshold Pearson (rthresh) | [−1, 1] | [−2, 2] | [−3, 3] |
The most favorable score possible for each method is underlined.
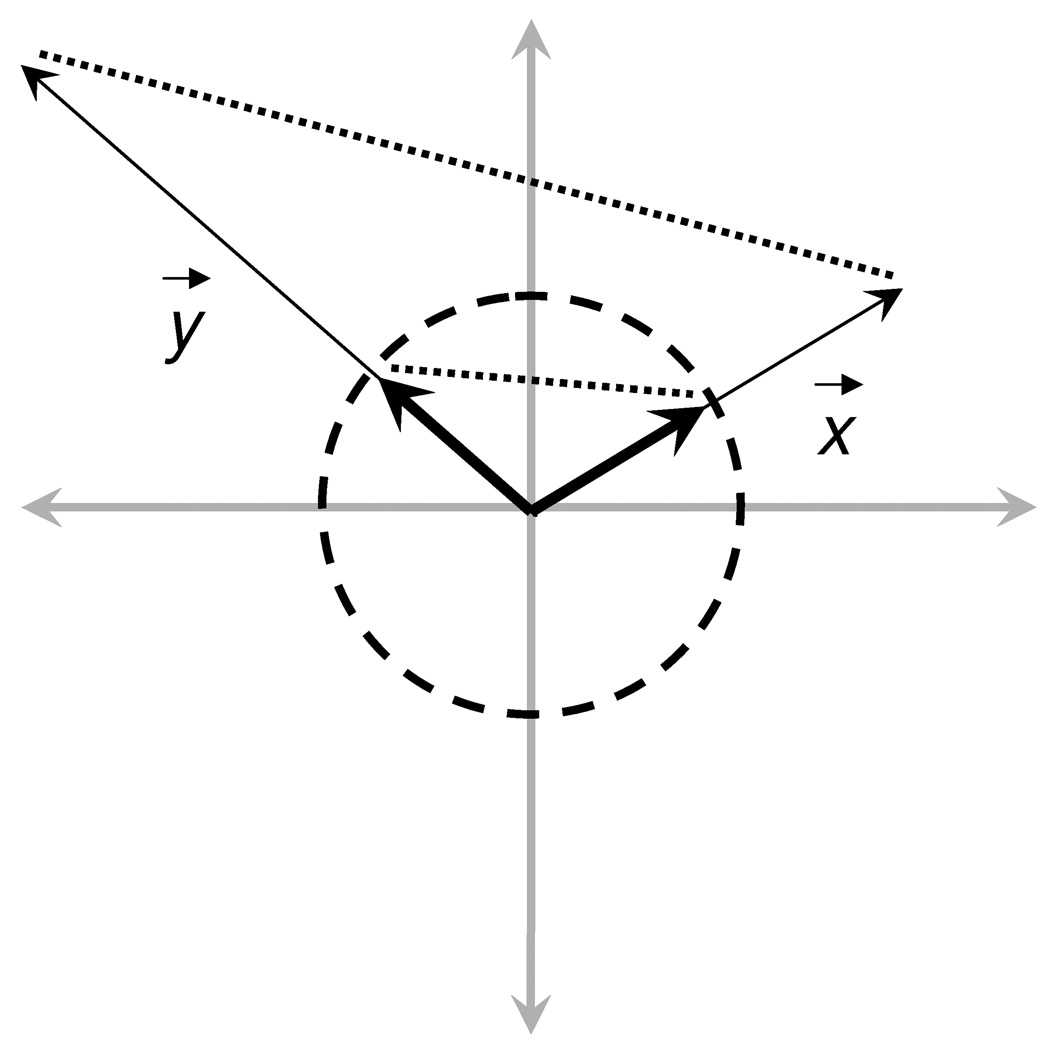
Standard Euclidean distance (d) makes use of the distance formula to quantify differences between two footprint vectors. The metric compares interaction signatures in terms of the absolute magnitudes occurring at each residue position. Alternatively, a normalized Euclidean distance (dnorm) may be computed by using normalized footprint vectors (X⃗ = x⃗/‖x⃗‖, Y⃗ = y⃗/‖y⃗‖). Here, the normalization procedure yields unit footprint vectors resulting in relative, as opposed to absolute, magnitudes being compared. Thus, normalized Euclidean distance may be thought of as a general measure of shape overlap. As illustrated in Figure 3, for a single type of footprint (VDW, ES, or HB), standard Euclidean distance maps from 0 to infinity while normalized Euclidean distance maps from 0 to 2 (Table II).
Figure 3.
Schematic depiction of standard (thin) versus normalized (thick) footprint vectors (x, y). The maximum distance between normalized vectors on the unit circle is 2 while the distance between standard vectors can be infinite
Similarity measures based on the standard Pearson correlation coefficient were also evaluated. Somewhat similar to normalized Euclidean distance, the standard Pearson metric quantifies similarity based on the relative magnitudes of each interaction. As a fourth alternative, threshold-based Pearson correlation coefficients (rthresh) were also computed using a reduced set of residues consisting of only the most significant interactions. In this case, a user-defined threshold is employed and the union of the two footprints (reference and candidate pose) is used to enforce that an identical set of residues is used in the calculation. Interactions here were included when the absolute value ≥ threshold which for VDW, ES, and HB footprints was set to 1.0, 0.1, and 0.5 kcal/mol, respectively. For a single type of footprint, both standard and threshold Pearson coefficients map from −1 to 1 (Table II). It is important to note the distinction in nomenclature between "threshold" which may be used to determine which residues are most important, and therefore to be included in a threshold-based footprint, from a "score cutoff" (as described below) which may be used to identify footprint(s) with strong similarity.
Pose Identification
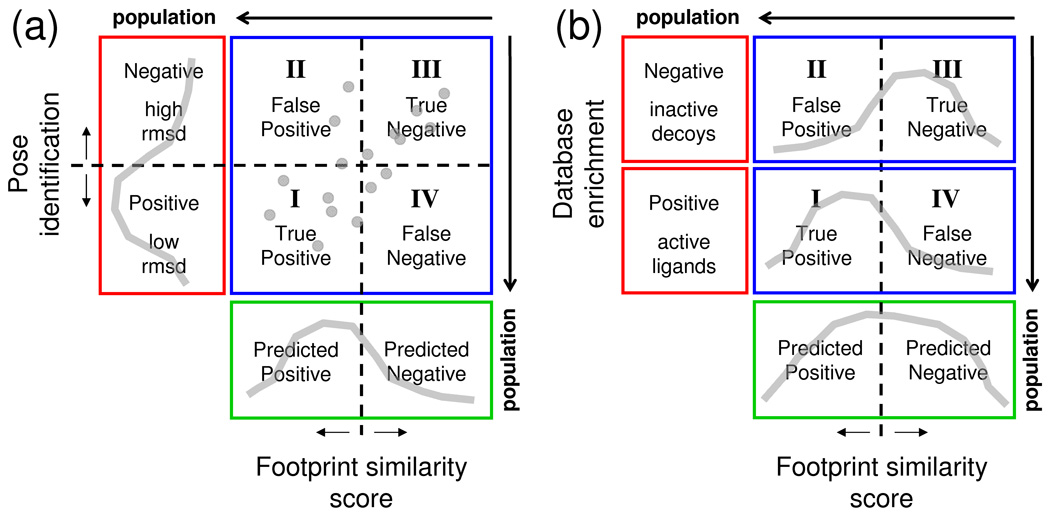
As illustrated in Figure 4, two key tests were employed to characterize the utility of using footprint-based methods for structure-based drug design. The first test (Figure 4a) involves examining the ability of footprint methods to correctly identify crystallographically determined binding geometries out of a set of decoys. Here, a score cutoff (i.e. correlation or distance value) is employed to classify whether a given pose will be predicted positive or predicted negative (Figure 4a, green region). To determine if predictions are actually positive or negative (Figure 4a, red region) the commonly employed ≤ 2.0 Å rmsd criteria is used to assess if the pose is similar to that in the experimental complex. The results can also be classified into four quadrants (Figure 4a, blue region) representing (I) true positives (predicted positive && positive), (II) false positives (predicted positive && negative), (III) true negatives (predicted negative && negative), and (IV) false negatives (predicted negative && positive). The sum of the components in each of the different colored regions will be equal (positive + negative results = predicted positive + predicted negative results = true positive + false positive + true negative + false negative results).
Figure 4.
Partitioning of outcome space (positive or negative results, red region) as a function of prediction (predicted positive or predicted negative, green region) into four quadrants (blue region) representing (I) true positives, (II) false positives, (III) true negatives, and (IV) false negatives for (a) pose identification and (b) database enrichment definitions of success. Gray colored lines represent hypothetical data
As a specific example, if a Euclidean-based footprint score cutoff of ≤ 0.3 was employed to make a classification, a molecule with a similarity score which equals 0.2 would be predicted as positive. Although the choice of score cutoff used to make prediction is somewhat arbitrary it should also be chosen with care. For example, although a more generous cutoff could be used to improve the number of true positives, as described further below, there is the risk that the number of false positives may also increase. As a general rule the goal is to maximize the number of true positives and true negatives while minimizing the false positives and false negatives as is illustrated by the hypothetical data in the graphic (Figure 4a, gray data).
Database Enrichment
The second key test (Figure 4b) involves assessing the ability of footprint-based scoring to predict whether a given compound will have biological activity (yes or no definition). From a virtual screening standpoint, if active ligands can be statistically scored better than inactive ligands (termed database enrichment), then rank-ordering of candidate ligands based on score provides a mechanism for focusing on only the most promising compounds. Using databases such as DUD,5,8 consisting of known active ligands seeded into a large group of decoys, scoring accuracy (Figure 4b, red region) is gauged by comparing the number of active and inactive compounds (Figure 4b green region) predicted to be in a given percentage of the database. As illustrated by the hypothetical data in the graphic, (Figure 4b gray lines) the scoring function should ideally separate active vs inactive molecules when viewed as histograms. As before, if a score cutoff is applied, the results can be classified into four quadrants (Figure 4b, blue region). However, as the actual positive and negative regions (Figure 3b, red region) are binary (yes/no activity) each sub-region contains only a single value representing the number of actual actives or decoys.
The amount of enrichment a given method provides versus random prediction is often gauged through use of receiver operator characteristic (ROC) curves30 which plot the true positive rate (true positives / positives) versus the false positive rate (false positives / negatives). In conjunction with calculation of the area under the curves (AUC), both ROC and AUC metrics can be used to identify which classifiers are significantly better than random. For example, a truly random classifier will have an ROC with slope = 1 and an AUC of 0.5 while a scoring function which is good at separating positives from negatives will yield in a steep early rise in the ROC curve with a corresponding AUC much closer to 1.0. The amount of fold enrichment (FE) in any given region of the database (typically the first 1–10%) may also be of interest and is defined here by taking the AUC for the range of interest normalized by the area expected from a random classifier (FE = AUC / AUCrandom).
Computational Details
Pose identification datasets
Candidate binding geometries to quantify pose identification success rates were derived from the SB2010 database recently reported by Mukherjee et al7 and interested readers should consult the manuscript for specifics regarding receptor and ligand structure preparation steps and docking protocols. Briefly, three distinct sampling methods were used to generate ensembles of poses, for each of the 780 protein-ligand complexes in SB2010, containing potentially correct ligand binding geometries as well as numerous low-energy decoys. The rigid (RGD) protocol attempts to rigidly place and optimize the known experimental pose back into the binding site through sampling the six degrees of rigid body translation and rotation. The fixed anchor (FAD) protocol tests re-growth of a molecule starting from crystallographic ligand scaffold positions. The flexible (FLX) protocol employs the DOCK anchor-and-grow algorithm,31,32 which involves orienting of ligand scaffolds (anchors) into the binding site followed by flexible conformer growth. A top-first clustering procedure31,32 was used to pruning away redundant structures during orientation and growth (FAD, FLX) and at the final stage of ranking (RGD, FAD, FLX). The retained group, termed clusterheads, each represent the lowest energy pose identified among geometrically related structures (< 2 Å) sampled during the docking. Use of clusterheads helps to ensure diversity in the ensemble when retaining a reduced set of top-scoring poses.
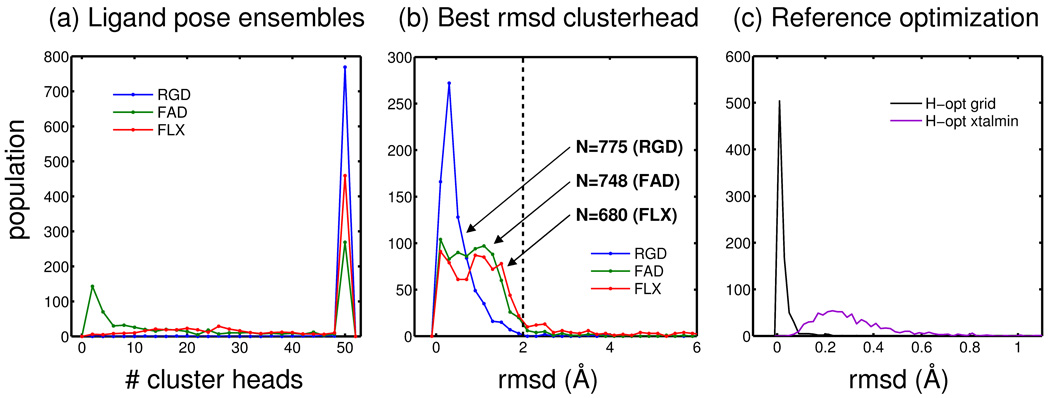
For the three datasets (RGD, FAD, FLX) the 50 top-ranked clusterheads for each system were energy minimized and rank-ordered on the protein Cartesian coordinates using 1000 iterations of simplex optimization with DOCK6.4. To help enforce that the original grid-based and subsequent Cartesian space poses would remain similar after an energy minimization, an rmsd-based harmonic tether was used to restrain each pose to the original input coordinates (force constant k = 10 kcal / mol Å2). As shown in Figure 5a, most, but not all SB2010 systems have at least 50 clusterheads. Figure 5b plots the lowest-rmsd pose identified, relative to the experimental ligand geometry, after energy minimization of the original grid-based ensembles (clusterheads). The number of systems in Figure 5b to the left of the 2 Å rmsd line for each sampling protocol (RGD=775, FAD=748, FLX=680) constitutes perfect sampling subsets, with associated ensembles (RGD = 38,569, FAD = 19,073, and FLX = 26,830), and these subsets were employed in the pose identification experiments described below. Importantly, use of perfect sampling subsets ensures that at least one pose for each system is close to the experimental pose which is an appropriate data group to use for tests designed to evaluate scoring (not sampling) accuracy.
Figure 5.
Database preparation histograms. (a) Population of systems with a given number of clusterheads (max 5 50) derived from Cartesian space minimizations of grid-based results reported by Mukherjee et al.7 (b) Population of systems with a given rmsd using only the single lowest-rmsd pose found among the ensemble of poses retained. The portion to the left of the dashed line at 2 A ° rmsd constitutes perfect sampling subsets for (RGD 5 775), fixed-anchor (FAD 5 748), and flexible (FLX 5 680) ligand sampling. (c) Population of ligand rmsds for reference poses after polar hydrogen optimizations using the energy grids (black line) and subsequent energy minimizations in Cartesian space (purple line) using a harmonic tether
Database enrichment datasets
For the enrichment tests, systems were taken from the directory of useful decoys (DUD) database.5,8 Three systems were evaluated, (i) neuraminidase (pdb code 1A4G)33 consisting of 1,874 decoys and 49 actives, (ii) trypsin (pdb code 1BJU)34 consisting of 1,664 decoys and 49 actives, and (iii) EGFR (pdb code 1M17)35 consisting of 15,996 decoys and 475 actives. Decoy and active ligands were used as originally downloaded from DUD (default protonation states and partial atomic charges). Docking setups (receptor preparation, energy grids, docking spheres, etc) were taken from SB20107 with the native cognate ligands from each pdb entry used as the footprint reference (zanamivir from 1A4G, benzamidine derivative from 1BJU, and erlotinib from 1M17). Docking calculations employed identical grid-based FLX protocols described by Mukherjee et al7 with the exception that the single best scoring pose was retained for subsequent Cartesian-based energy minimization (as described above) followed by footprint rescoring. Enrichment was evaluated by plotting standard ROC curves.
Footprint reference preparation
Initial testing revealed that in some cases footprints, and thus FPS scores, could be sensitive to placement of hydrogen atoms. Perhaps not surprisingly, sensitivity appeared to be most pronounced for electrostatic (ES) and hydrogen-bond (HB) interactions involving charged moieties. To reduce variability as a result of sub-optimal hydrogen rotamers in molecules used as the reference, an optimization procedure was developed in which growth routines in the DOCK6.4 program were co-opted for sampling polar −OH, −SH and −NH groups deemed most susceptible. The procedure uses a modified DOCK flexible definition file (flex.defn) with six angle steps sampled for each torsion at 0°, 60°, 120°, 180°, 240°, and 300° followed by minimization. Sampling is performed using standard DOCK energy grids to achieve quick optimization and a stiff harmonic restraint (k = 1000 kcal / mol Å2) is used on ligand heavy atoms to insure only hydrogen atoms move. Following sampling the most favorable pose is minimized on the Cartesian coordinates (restraint k = 10 kcal / mol Å2) so that footprints may be computed. It should be noted that additional hydrogen optimization is not generally necessary for poses generated using FAD or FLX protocols as the −OH, −SH and −NH polar groups are sampled during ligand growth procedures. Thus, hydrogen optimization was only done for molecules used as a reference. As shown in Figure 5c the hydrogen optimization and subsequent minimization process minimally alters the experimental binding poses (rmsds typically ≤ 0.2 Å) yet these structures result in better behaved reference footprints.
Footprint rescoring protocols
The modular nature of the DOCK program lends itself to be easily extended with new scoring functions.10,32 The ability to compute footprints and footprint similarity scores was implemented into an inhouse version of DOCK6.4 as a new scoring function termed "descriptor score". Code modifications will be made available to registered users of DOCK through the official UCSF distribution site (http://dock.compbio.ucsf.edu) in the near future. FPS scores (FPSVDW, FPSES, FPSHB or any combination thereof) may be calculated with any of the four comparison methods described above (standard Pearson, threshold Pearson, standard Euclidean, normalized Euclidean) using a user supplied reference. If desired, users can also output a comma separated text file consisting of a list of residue numbers with associated energies for the reference and candidate poses which facilitates graphical plotting of the footprints. Importantly, the FPS rescoring procedure is relatively fast. As an example, grid-based docking of 15,996 molecules to EGFR using the DUD subset with FLX protocols takes ca 159 seconds per molecule on single 3.2Mhz Pentium IV cpu. Energy minimization in Cartesian space takes an additional ca 17 seconds per molecule followed by FPS scoring which takes ca 0.13 seconds per molecule. Thus, compared to the time required for flexible docking the additional costs to obtain FPS scores are minimal.
Results and Discussion
Footprint Similarity (FPS) vs DOCK Cartesian Energy (DCE) Scores for Pose Identification
Table III shows pose identification results using FPS or DCE scoring criteria to choose a "top pose" from among the RGD (N =775), FAD (N=748), and FLX (N=680) perfect sampling subsets (Figure 5b) from the SB2010 database7 (see Methods). Ideally this top pose should match the crystal structure with a low heavy atom rmsd. Here, use of perfect sampling subsets ensure that at least one pose for each system is in fact within 2 Å rmsd of the crystal structure. Other poses (> 2 Å rmsd) in each system ensemble (Figure 5b) may be thought of as decoys. For a given protocol, percent success is the ratio between the number of systems with top poses correctly identified and the total number in the perfect sampling subset (e.g. in Table III the top right most entry is 80.9% = 627 identified / 775 possible × 100). For each of the three subsets (RGD, FAD, and FLX) the standard Pearson, standard Euclidean, normalized Euclidean, and threshold Pearson methods were used to compute footprint similarities (FPS) scores using footprints representing VDW, ES, VDW+ES, or VDW+ES+HB terms. It is important to note that no scoring cutoff (i.e. above/below a certain FPS value) was employed in choosing top scoring poses for the results presented in Table III. For each system, the best scoring pose was always retained even if the FPS score relative to the reference was poor.
Table III.
Pose identification success using Footprint similarity (FPS) vs DOCK Cartesian energy (DCE) methods to rescore rigid (RGD), fixed anchor (FAD) and flexible ligand (FLX) pose ensembles.
| Row | Ligand Ensemble |
FPS Standard Pearson A |
FPS Standard Euclidean B |
FPS Threshold Pearson C |
FPS Normalized Euclidean D |
DCE E |
|---|---|---|---|---|---|---|
|
VDW+ES | ||||||
| 1 | RGD | 691 (89.2%)a | 718 (92.6%) | 683 (88.1%) | 707 (91.2%) | 627 (80.9%) |
| 2 | FAD | 642 (85.8%) | 638 (85.3%) | 644 (86.1%) | 652 (87.2%) | 606 (81.0%) |
| 3 | FLX | 563 (82.8%) | 565 (83.1%) | 556 (81.8%) | 574 (84.4%) | 489 (71.9%) |
|
VDW | ||||||
| 4 | RGD | 687 (88.6%) | 684 (88.3%) | 662 (85.4%) | 687 (88.6%) | 445 (57.4%) |
| 5 | FAD | 638 (85.3%) | 630 (84.2%) | 621 (83.0%) | 638 (85.3%) | 464 (62.0%) |
| 6 | FLX | 545 (80.1%) | 539 (79.3%) | 525 (77.2%) | 545 (80.1%) | 309 (45.4%) |
|
ES | ||||||
| 7 | RGD | 579 (74.7%) | 583 (75.2%) | 576 (74.3%) | 579 (74.7%) | 398 (51.4%) |
| 8 | FAD | 601 (80.3%) | 573 (76.6%) | 598 (79.9%) | 603 (80.6%) | 460 (61.5%) |
| 9 | FLX | 521 (76.6%) | 505 (74.3%) | 513 (75.4%) | 522 (76.8%) | 314 (46.2%) |
|
VDW+ES+HB | ||||||
| 10 | RGD | 670 (86.5%) | 726 (93.7%) | 590 (76.1%) | 685 (88.4%) | 633 (81.7%) |
| 11 | FAD | 621 (83.0%) | 643 (86.0%) | 590 (78.9%) | 632 (84.5%) | 606 (81.0%) |
| 12 | FLX | 557 (81.9%) | 564 (82.9%) | 501 (73.7%) | 561 (82.5%) | 492 (72.4%) |
Number of molecules in which the pose identified was ≤ 2 Å from the x-tal structure pose followed by success rates in parenthesis. Pose ensembles (RGD = 775, FAD = 748, FLX= 680) derived from docking runs reported by Mukherjee et al.7
It should be emphasized that the results in Table III only test scoring and not sampling. Thus, the VDW+ES values (rows 1–3 column E) for DCEVDW+ES (RGD=80.9%, FAD=81.0%, FLX=71.9%) are representative of the accuracy of the standard DOCK scoring function. Importantly, these results are similar to those reported by Mukherjee et al.7 (RGD=83.5%, FAD=81.6%, FLX=72.6%) for the analogous perfect-sampling subsets suggesting excellent correspondence between grid-based and Cartesian-based results. With one exception (threshold Pearson with FPSVDW+ES+HB, rows 10–12 column C) all methods and protocols in Table III for computing footprint similarity scores yield higher success rates than the comparable DCE scores. Although the values for many of the tests in Table III yield similar results, overall, use of the FPSVDW+ES footprint classifier with normalized Euclidean distance (rows 1–3 column D) appears best at identifying correct poses from within the various ligand ensembles (RGD=91.2%, FAD=87.2%, and FLX=84.4%). Specifically, FPSVDW+ES increases success over comparable DCEVDW+ES scores by 10.3 %, 6.2 %, and 12.5 % for RGD, FAD, and FLX respectively. Although not directly comparable, due to differences in dataset size and/or analysis, prior studies have also reported improvements in identification of native-like poses, relative to using a standard scoring function, using bit-string representations and related methods. Interested readers should consult studies by Singh and coworkers,19,21,22,27 Kelly et al,20 Marcou et al,23 Mpamhanga et al,24 Pfeffer et al,25 Renner et al,26 and Pérez-Nueno et al.28
Interestingly, use of a single energetic descriptor in DCE scores yields severely degraded results compared to using the corresponding footprint for FPS scores (Table III columns D vs E rows 4–9). For example, normalized Euclidean FPSVDW (80–89%) and FPSES (75–81%) show much higher success rates versus analogous DCEVDW (45–62%) and DCEES (46–62%) methods. Thus, the information encoded by a single VDW or ES footprint vector appears to be sufficient to identify native-like poses. However, tests using a single HB footprint revealed that there is insufficient information encoded due to the discrete nature of hydrogen bonds employed in the present implementation (yes or no geometric definition with one hydrogen bond = −1 kcal/mol). In addition, the fact that numerous poses (real or decoy) make only a few, or even no hydrogen bond interactions with a target, precludes rank-ordering using HB footprints alone. In any event, use of HB in conjunction with VDW and ES footprints is not problematic however the addition generally decreases the success rates (Table III VDW+ES vs VDW+ES+HB). Surprisingly, modifying the standard DCE scoring function to energetically account for intermolecular hydrogen bonds yields no degradation and in fact shows a slight improvement (Table III DCEVDW+ES+HB vs DCEVDW+ES).
Functional Relationships between Methods used to Compute FPS scores
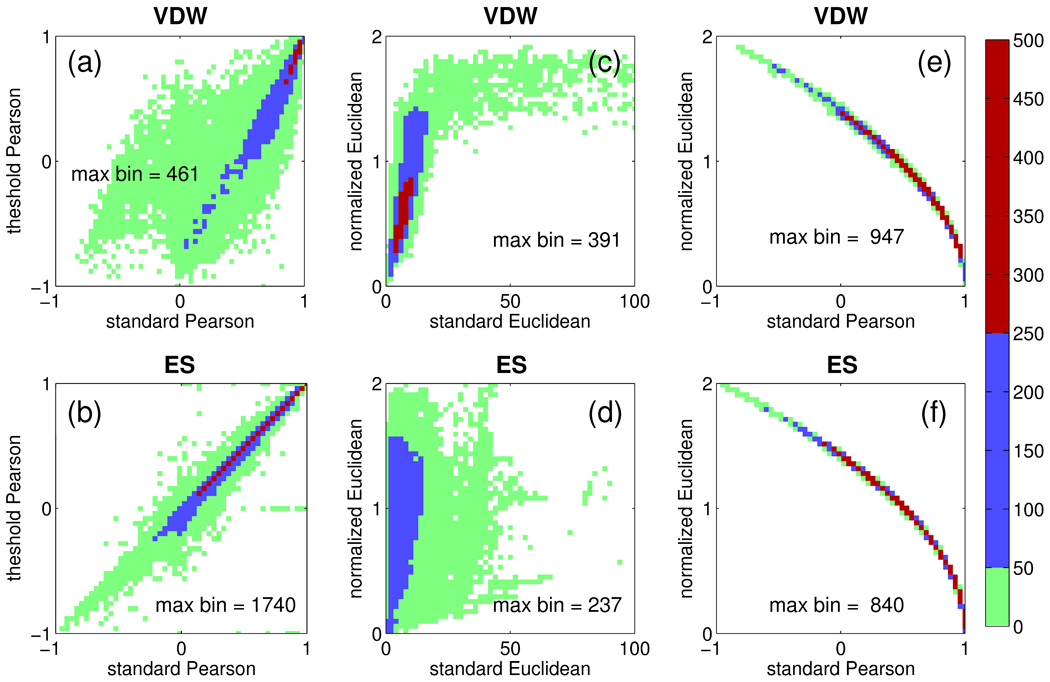
To more closely examine how results using two different comparison methods may be related, Figure 6 shows three functional relationships (standard vs threshold Pearson, standard vs normalized Euclidean, and standard Pearson vs normalized Euclidean) derived from plotting clusterhead ensembles for all FLX systems (N = 680 structures × ca. 39.445 average # of clusterheads each = 26,830 footprints). Data derived from both ES and VDW footprint similarity scores are shown and the results are colored by population. Across all datapoints, both Pearson methods yield results which are quantitatively similar especially when FPS scores are highly correlated (r-values near 1) or fall within the 0 to 1 range (Figure 6a,b blue and red populations). Interestingly, when the FPSVDW scores themselves become anti-correlated (r-values ≤ 0) there is significantly less agreement between the two comparison methods but only for the VDW results. In contrast, results using both Euclidean methods also show a strong linear relationship when FPS scores are nearest 0 and therefore most correlated (Figure 6c,d blue and red populations) but as the scores themselves become less-correlated (values >> 0) the ca linear relationship is lost for both VDW and ES results. Finally, the strong relationship (, see supplemental material for derivation) between standard Pearson and normalized Euclidean methods (Figure 6e, f) suggests both comparison metrics will yield very similar results across the entire range. As noted above, FPSVDW+ES scoring in combination with normalized Euclidean distance appears marginally best at pose identification. Therefore, unless otherwise stated, and to simplify discussion in the remainder of the text, normalized Euclidean methods in combination with FLX results will be emphasized.
Figure 6.
Functional relationships between FPS scores computed for van der Waals (VDW, top) and electrostatic (ES, bottom) interactions using (a, b) standard Pearson vs. threshold Pearson, (c, d) standard Euclidean vs. normalized Euclidean, and (e, f) standard Pearson vs. normalized Euclidean. Population color ranges for green 5 [1, 50], blue 5 [51, 250], and red 5 [251, 5001] are derived from the total FLX ensemble of N 5 26,830 footprints.
Predicted Positive and Predicted Negatives
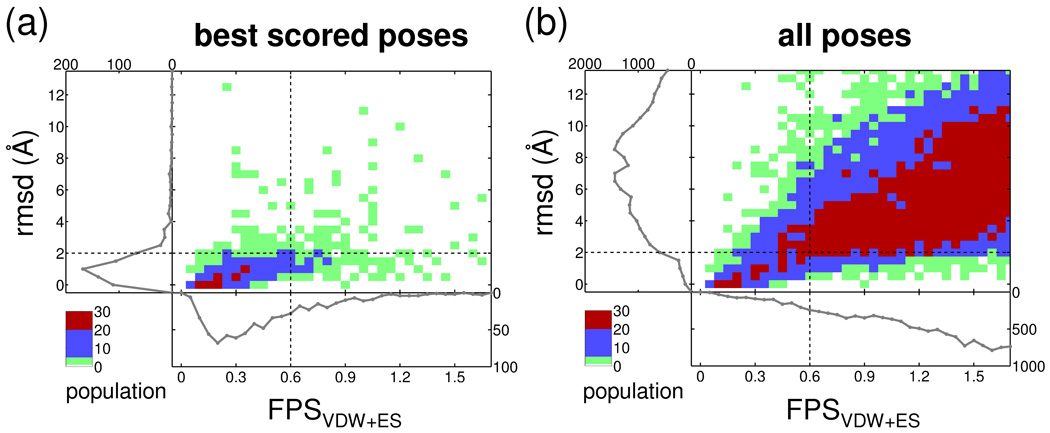
Figure 7 and Table IV show normalized Euclidean results using the FLX-derived dataset in terms of the three areas of partitioning described in Methods (see Figure 4a) comprised of (1) positive and negative regions, (2) predicted positive and predicted negative regions, and (3) true positive, false positive, true negative, and false negative quadrants. Positive and negative regions in Figure 7 are shown below and above, respectively, the horizontal dashed line at 2 Å in the rmsd histograms (left of each panel). From a prediction standpoint, the predicted positives and predicted negatives in Figure 7 are to the left and right, respectively, of the vertical dashed line representing a 0.6 score cutoff in the FPS score histograms (bottom of each panel). It is important to note that the choice of a specific FPS score cutoff choice for prediction is user defined. Table IV lists results using a 0.3, 0.6, or 0.9 score cutoff which under these conditions appear to be reasonable choices. Results in each of the four quadrants in Figure 7a–b indicate populations which follow the color ranges for green = [1, 5], blue = [6, 20], and red = [21, 30+]. For completeness, Figure 7 and Table IV show results both when keeping only the best scored pose identified for each of the 680 FLX systems as well as for all poses in the total ensemble of FLX-derived clusterheads (N=26,830).
Figure 7.
Two dimensional histograms of rmsd versus FPSVDW1ES score for (a) the best scored poses (N 5 680) and (b) the entire ensemble derived from all poses (N 5 26,830). Population color ranges for green 5 [1, 5], blue 5 [6, 20], and red 5 [21, 301].
Table IV.
FLX results scored with FPSVDW+ES for three differing footprint similarity score cutoffs using a 2 Å rmsd to separate positive from negative regions.
| Set | Cutoff | Positive | Negative | Predicted Positive |
Predicted Negative |
True Positive |
False Positive |
True Negative |
False Negative |
|---|---|---|---|---|---|---|---|---|---|
| best scoreda |
0.3 | 251 | 429 | 240 | 11 | 95 | 334 | ||
| 0.6 | 574 | 106 | 507 | 173 | 458 | 49 | 57 | 116 | |
| 0.9 | 618 | 62 | 537 | 81 | 25 | 37 | |||
| all posesb |
0.3 | 295 | 26,535 | 261 | 34 | 25,831 | 704 | ||
| 0.6 | 965 | 25,865 | 1,185 | 25,645 | 577 | 608 | 25,257 | 388 | |
| 0.9 | 3,026 | 23,804 | 759 | 2,267 | 23,598 | 206 | |||
N = 680.
N = 26,830.
Generally good separation is observed in Figure 7 with higher populations appearing in true positive and true negative quadrants relative to false positive and false negative quadrants (population legend follows red > blue > green). Ideally, the number of true positives and true negatives should be near 100% while the number of false positives and false negatives should be near 0%. Quantitatively, the percent values of each quadrant, computed from the raw numbers in Table IV, suggest useful predictive ability. For example, the best scored poses dataset using a FPS cutoff of 0.6 yields a strong true positive rate = 79.8% (458 / 574 × 100) and a relatively strong true negative rate = 53.8%. The corresponding false positive (46.2%) and false negative (20.2%) rates are smaller as desired. At the looser 0.9 cutoff the true positive rate substantially increases to 93.6% however the corresponding false positive rate also increases (76.4%) which is not desirable. As expected, the true negative (23.6%) and false negative (6.4%) rates show a corresponding decrease. Importantly, as discussed further below, a substantial number of poses labeled here as false positive appear to be miscategorized. Roughly similar trends (true positive and true negative quadrants > false positive and false negative quadrants) are seen using the dataset derived from all ligand poses (Figure 7b). At the 0.6 cutoff the true positive rate = 59.8%, the true negative rate = 97.6%, the false positive rate = 2.3%, and the false negative rate = 40.2%. Here, the large numbers of decoys (negatives) present in the all poses dataset (N = 25,865) yields excellent statistics for both true negative and false positive rates. For comparison, similar analysis based on a quadrant partitioning of rmsd vs score was reported by Marco et al23 using binary fingerprinting.
False Positive Examples
Focusing on the best scored dataset, although changing the FPS score cutoff from 0.6 → 0.9 increases the number of true positives (79.8% → 93.6%) the number of false positives also increases (46.2% → 76.4%). In general, as the vertical dashed line representing footprint similarity in Figure 7 is shifted from left to right, greater numbers of false positives will occur. However, while it may be acceptable in a virtual screen to discard molecules that could bind (false negatives) as long as a sufficient number of true positives are retained, it is extremely undesirable to retain non-active molecules (false positives) because molecules without activity may be passed onto more costly testing (i.e. purchase or synthesis).
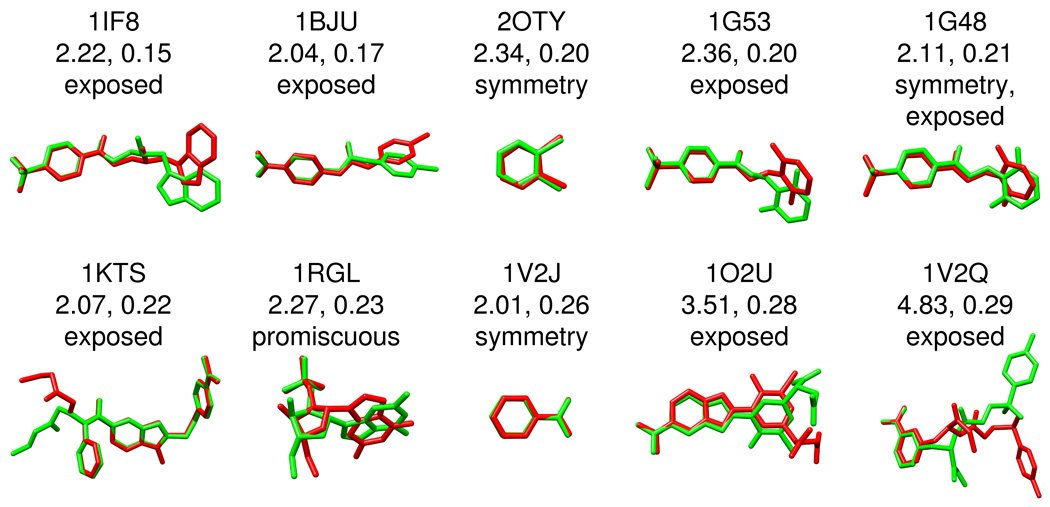
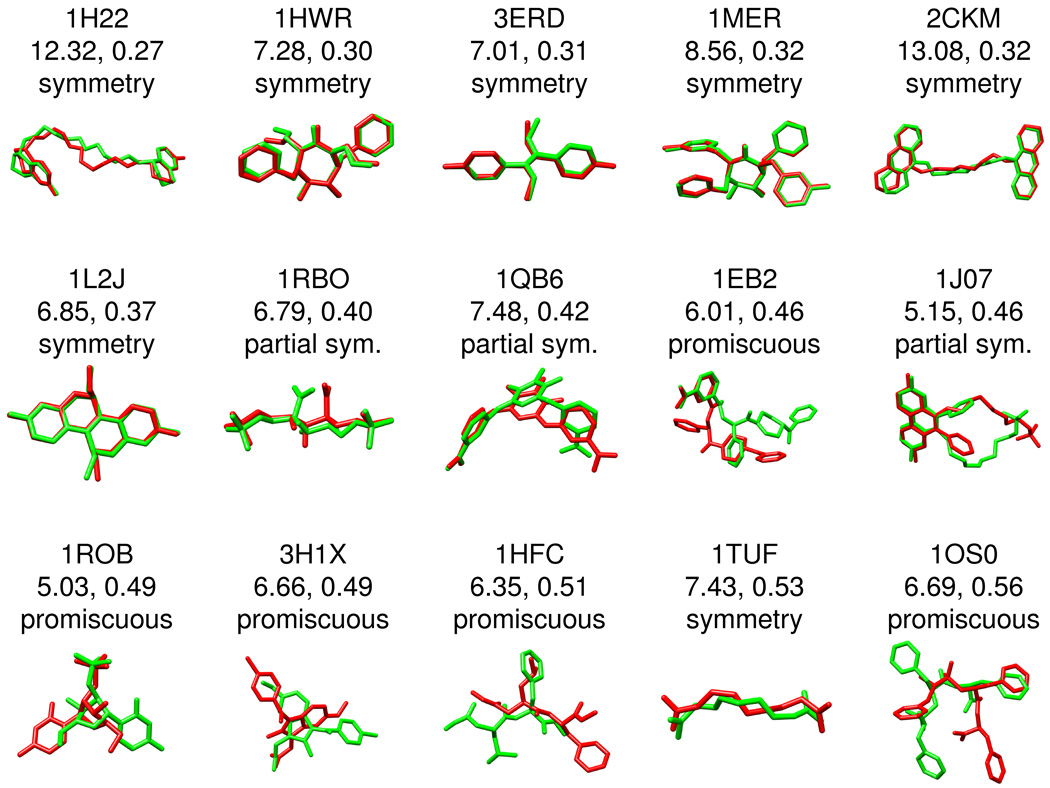
Figures 8–9 graphically illustrates how poses classified as false positive may in fact be geometrically and chemically correct in terms of binding. Overlays of predicted (green) versus crystallographic (red) poses are shown along with corresponding FPS score, rmsd in Å, and potential sources of misclassification which primarily involves: (i) symmetry issues with rmsd calculations, and (ii) solvent-exposed moieties which do not interact with the binding site. False positives not belonging to either of these two categories appear to arise from the potentially useful phenomena (i.e. in virtual screening) that poses can yield similar footprints despite poor geometric overlap and are here labeled promiscuous. The group in Figure 8, termed type I false positives, represents those from the best pose dataset with excellent footprint overlap (FPSVDW+ES < 0.3) but were classified as failures in terms of a close-to-medium geometric match (rmsd > 2 Å and < 5 Å). The group in Figure 9, termed type II false positives, shows more extreme cases in which ligand poses have reasonable footprint overlap (FPSVDW+ES < 0.6) but very poor geometric matches (rmsd > 5 Å). It is important to note the categories used here in Figures 8–9 defining systems as solvent-exposed, promiscuous, and to a lesser extent symmetry-related, are subject to interpretation.
Figure 8.
False positive examples type I. Excellent similarity scores (FPSVDW1ES\0.3) but classified as failures due to a close-to-medium geometric match (rmsd [ 2 A° and \ 5 A°). The associated PDB code, rmsd in A °, FPS score, and overlay of the predicted (green) versus crystallographic (red) pose are shown for each system
Figure 9.
False positive examples type II. Good similarity scores (FPSVDW1ES\0.6) but classified as failures due to a poor geometric match (rmsd [ 5 A°). The associated PDB code, rmsd in A °, FPS score, and overlay of the predicted (green) versus crystallographic (red) pose are shown for each system.
Symmetry
Symmetric molecules or molecules containing moieties with symmetry often produce docked candidates in which poses or functional groups (i.e. aromatic rings) are flipped about an axis of symmetry. At this time, DOCK does not correct for symmetry and several of the best scored poses in Figures 8–9, based on visual examination, have higher than expected rmsd values. Particularly dramatic examples are the two symmetric HIV protease inhibitors 1HWR (7.28 Å) and 1MER (8.56 Å) shown in Figure 9 which have essentially perfect overlap with the reference but high rmsds. More extreme examples include the long symmetric inhibitors 2CKM (13.08 Å) and 1H22 (12.32 Å) for which the lowest energy docked poses are flipped by ca 180 degrees resulting in high rmsd. Marcou et al23 similarly found that many false positives also turned out to be molecules containing symmetry. As a possible alternative to traditional rmsd-based methods, Kroemer et al6 has described the interaction-based accuracy classification (IBAC) method which judges the correctness of a docked pose by manually comparing key receptor-ligand interactions identified in the crystal structure.36 IBAC however, as the authors note, is not easily automated. More recently, Trott and Olson37 have introduced an alternative definition for computing rmsd in the program AutoDock Vina which the authors indicate accounts for symmetry, partial symmetry, and near symmetry. Efforts to incorporate symmetry-corrected rmsd calculations into DOCK are under evaluation. It should be emphasized however that although accounting for symmetry may affect pose identification accuracy it will not directly impact virtual screening.
Solvent-exposed
Solvent exposed moieties of a bound ligand may not interact strongly with the receptor. In such cases, it is not unexpected that exposed groups could adopt multiple conformations while the bulk of the molecule, and therefore the footprint, remains unchanged. As the rmsd metric takes into account all ligand atoms such systems could be unfairly penalized by using rmsd to evaluate potential FPS scoring accuracy. Interestingly, most of the false positive errors in the type I classification (close to medium rmsds) appear to fall into the "exposed" category. 1KTS38 provides a clear example. Here, only the solvent exposed ethyl ester substituent is not well overlaid (Figure 8) although the rest of the molecule shows almost perfect overlap. Perhaps not surprisingly, as discussed by Nar et al39 for the same ligand bound to Factor Xa, the electron density is not as well defined in this region.
Promiscuous
Importantly, the available conformational space for a given ligand, even for ligands with no (or imperfect) symmetry, can yield reasonable FPS scores despite poor geometric and/or chemical overlap as shown in Figures 8–9 for 1RGL, 1ROB, 3H1K, 1HFC, and 1OS0. Labeled here as promiscuous, of the three categories (symmetry, solvent exposed, or promiscuous), these could be considered as bona fide failures of the pose identification tests. On the other hand, the misidentified conformations also suggest, conceptually, that compounds with high footprint overlap can be structurally diverse. Additional crossdocking and database enrichment studies presented below strongly suggests this hypothesis to be true. From a virtual screening standpoint, promiscuity may in fact be desirable by allowing for identification of new molecules with chemotypes, scaffolds, and/or functionality different from known inhibitors.
False Negative Examples
Although false negatives are generally considered less problematic than false positives an examination of systems which fall into this category was undertaken to more fully characterize the method. Table V shows representative examples in which good geometric overlap (low rmsds) is observed for correspondingly poor footprint scores (high FPS) defined by the ranges rmsd < 1.0 Å and FPSVDW+ES > 1.0. Interestingly, the poor FPSVDW+ES scores in these false negative examples arise because only one of the two terms, FPDVDW or FPSES is sub-optimal (Table V underline entries).
Table V.
False negative examples for the range defined by the range rmsd < 1.0 Å and FPSVDW+ES > 1.0.
| Code | rmsd (Å) | FPSVDW+ES | FPSVDWa | FPSESa |
|---|---|---|---|---|
| 2QE4 | 0.35 | 1.34 | 0.14 | 1.20 |
| 1HSH | 0.77 | 1.31 | 0.16 | 1.15 |
| 2F80 | 0.70 | 1.47 | 0.47 | 0.99 |
| 1CPI | 0.56 | 1.05 | 0.13 | 0.92 |
| 1TNL | 0.69 | 1.11 | 0.92 | 0.19 |
| 2JJ3 | 0.44 | 1.18 | 0.81 | 0.37 |
| 9AAT | 1.00 | 1.01 | 0.79 | 0.22 |
Poor scores for individual terms are underlined.
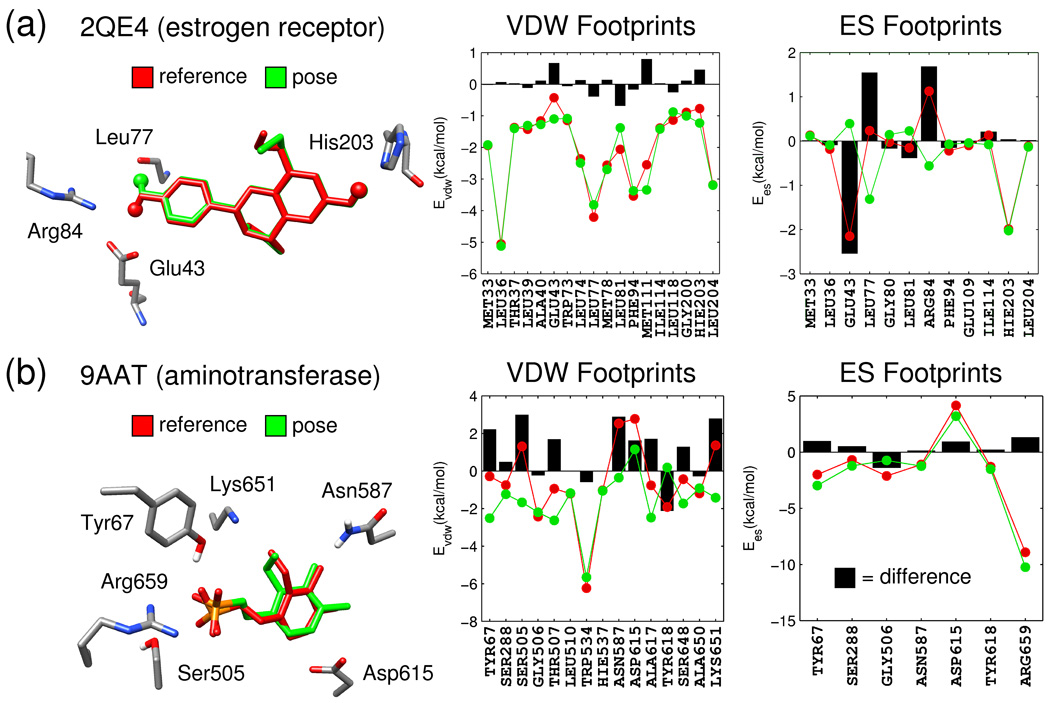
In many instances, close inspection reveals the source of the poor footprint term as illustrated in Figure 10 for two representative systems, 2QE4 (estrogen receptor) and 9AAT (aspartate aminotransferase). As before, results for the reference and candidate poses are shown in red and green respectively. Only the most significant footprint interactions are shown with energetic differences indicated in black. Figure 10a dramatically highlights how a poor electrostatic footprint overlap may be a result of variation in intermolecular hydrogen bonding. Specifically, the positioning of a key ligand hydrogen atom (indicated as spheres), on the left side of the reference molecule (red) in Figure 10a, results in favorable ES interactions with Glu43 but unfavorable ES interactions with Arg84. However, for the candidate pose (green) with an alternate polar hydrogen rotamer, both interactions are reduced significantly in magnitude and a new favorable ES interaction is observed with the backbone carbonyl at position Leu77. In contrast, both poses show the same rotameric state for hydrogen bonding with His203 (overlapping spheres on the right side of molecules) and the accompanying energetic difference at this position is zero. Overall, the observed correspondence between changes in geometry with energy is physically reasonable.
Figure 10.
Pose and footprint comparisons for (a) 2QE4 and (b) 9AAT showing results for the reference pose in red, the docked pose in green, and per-residue differences as black bars.
The second example (Figure 10b) is representative of cases in Table V in which VDW footprints are dissimilar despite well-overlapped FPSES profiles. Here, the significant ES attraction between the ligand sulfonate and Arg659 (~ 10 kcal/mol), in concert with interactions at Tyr67 (favorable) and Asp615 (unfavorable) which are in general greater in magnitude than any individual VDW energy, likely impacts the fact steric packing differences show greater variation. Interestingly, the candidate pose in Figure 10b (green line), in comparison to the reference (red line), yields a somewhat more satisfying VDW footprint in that most active site per-residue terms become favorable while at the same time the ES footprint remains unchanged. In contrast, the reference pose (red line), shows unfavorable energies (e.g. at Ser205, Asn587, Asp615, and Lys651) which could indicate sub-optimal x-ray refinement of the ligand. In any event, the strong interaction with Trp534 is well preserved by both poses. Importantly, both examples in Figure 10 provide evidence that molecular footprints capture interactions which make physical sense but additionally highlight the need for care when preparing reference poses, especially for ligands containing polar hydrogens. In a more general sense, the results also indicate the importance of using intermolecular energy minimization, prior to computing FPS scores, for all binding geometries being considered, including references. Although for 9AAT, energy minimization alone was not sufficient to alleviate all unfavorable steric packing in the original crystallographic pose (Figure 10b red VDW footprints).
Crossdocking Rescoring
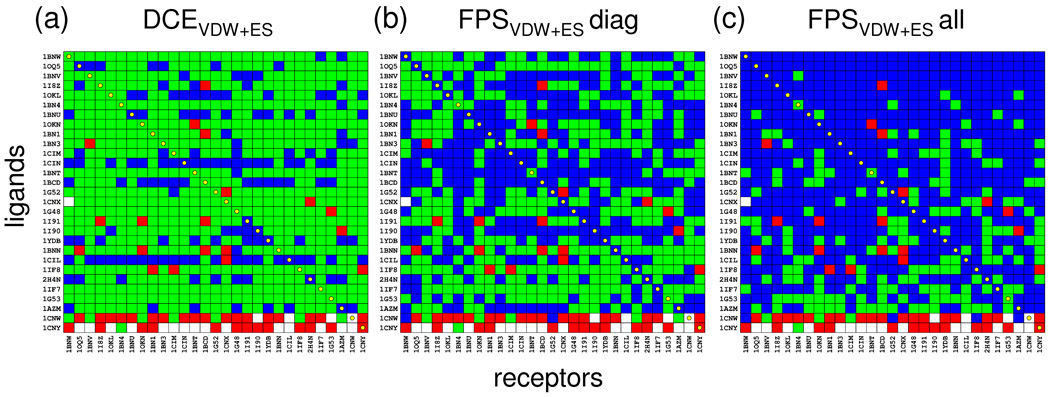
As recently reported by Mukherjee et al7 carbonic anhydrase provides a good system on which to test new scoring functions given that crossdocking experiments, despite high scoring failures, yield few sampling failures. Crossdocking employs a related family of proteins, aligned into a common "master" coordinate frame, thus enabling docking of all ligands into all receptors. Importantly, the alignments provide, in addition to cognate protein-ligand pairs that lie on the diagonal matrix entries, off-diagonal elements for which a hypothetical reference pose can be established for all possible combinations. Figure 11 shows results using the aligned carbonic anhydrase family from the SB2010 testset.7 Here, pose identification accuracy was determined across the 29 × 29 matrix using two FPSVDW+ES scoring schemes (Figure 11b,c), to rerank ensembles of poses generated by docking each ligand into each receptor, for comparison with the standard DCEVDW+ES method (Figure 11a). It is important to note that in these experiments only the number of scoring failures (green), and thus actual success rates (blue), will be affected. Sampling failures and/or incomplete growth (red and white elements) do not change depending on which function is used as these experiments only involve rescoring. Similar to the pose identification experiments (Table III) the crossdocking studies employed no FPS score cutoff.
Figure 11.
Pose identification results for the carbonic anhydrase family using crossdocking ensembles from Mukherjee et al.7 Blue, green, red, and white elements indicate successes, scoring failures, sampling failures, and incomplete growth, respectively. Three scoring methods were evaluated: (a) standard DCEVDW1ES, (b) FPSVDW1ES in which cognate ligands (diagonals) were used as the footprint-reference corresponding to each receptor, (c) FPSVDW1ES in which footprintreferences were derived by minimizing each ligand in each receptor and every matrix element used a unique reference. Note that in all cases the rmsd references employed the set of ligands minimized in each receptor.
Marked improvement in pose identification success (increased number of blue matrix entries), in comparison with the DCEVDW+ES standard method (Figure 11a vs 11b), is observed using FPS scoring which employs reference footprints derived from diagonal entries in the matrix. Notably, the results in Figure 11b show nearly perfect diagonal success rates (24/29), for the experimentally verifiable cognate protein-ligand systems, compared with Figure 11a for which only a few successes (9/29) are obtained. Importantly, the Figure 11b protocol mimics that which might be applied to a typical virtual screening scenario, in which one reference per-receptor (i.e. the native ligand and or substrate) would be used to help identify related ligands. Figure 11c provides an additional experiment, in which references were derived by minimizing each ligand in each receptor and using the resultant structures from each corresponding element for footprint-based scoring to the receptor contained within that element. Not surprisingly, this protocol yields the highest overall success rates (Figure 11c, blue entries), which serves to confirm the overall robustness of the footprint procedure, although in practice using a unique reference for each ligand is somewhat artificial. Nevertheless, the progressive increase in total matrix success (% coverage of blue squares) in going from DCEVDW+ES, (17.8%), to FPSVDW+ES using diagonal references (45.4%), to FPSVDW+ES using unique references (70.9%), demonstrates utility of the method for identification of specific binding patterns. Additional virtual screening tests as described below provide further support.
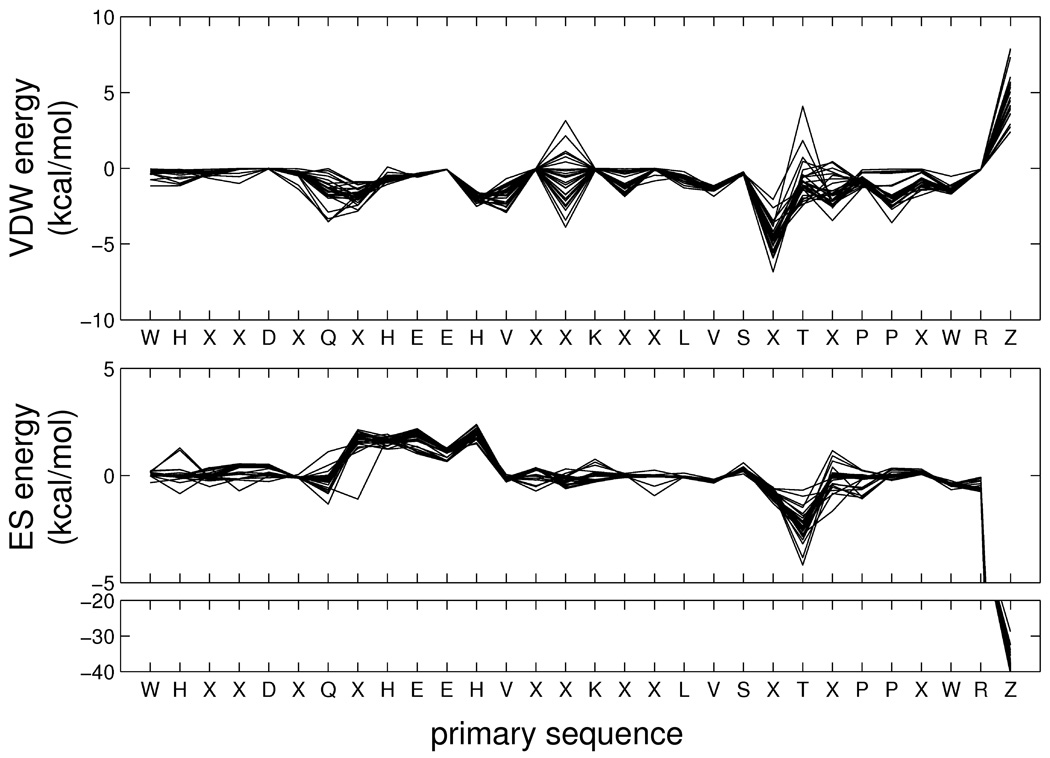
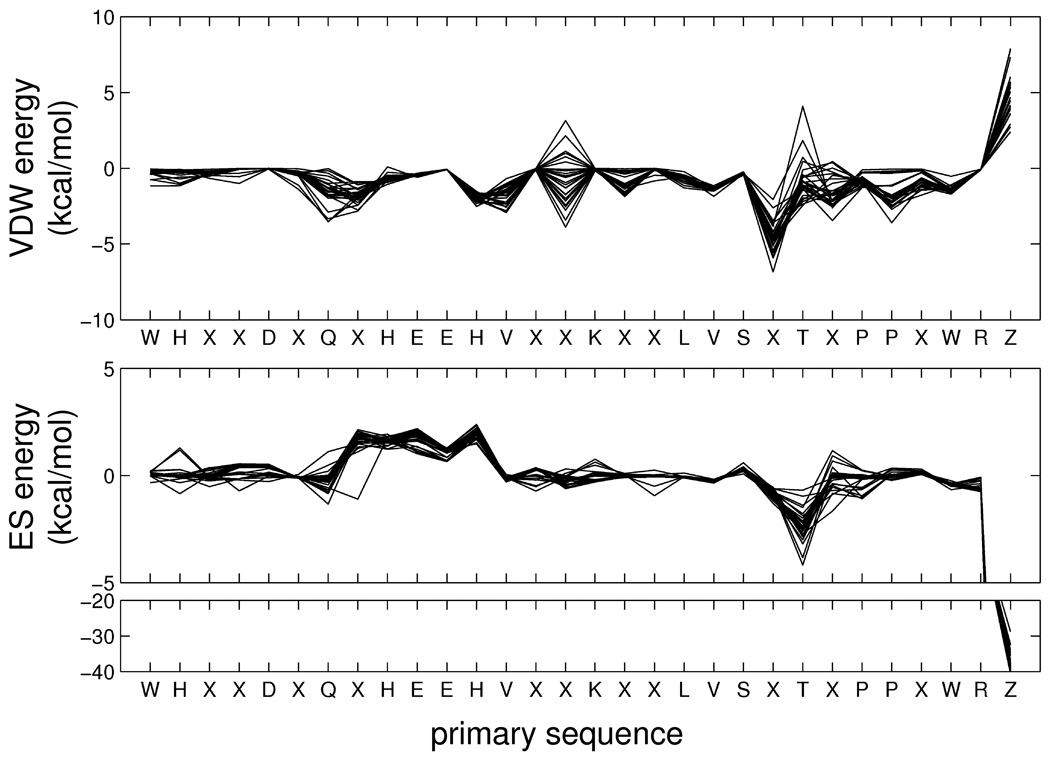
As an additional visual point of reference, Figure 12 shows the molecular footprints for the cognate diagonal entries of the carbonic anhydrase family which for clarity consist of only the most significant (favorable or unfavorable) interactions. Notably, the significant commonalities in the overlaid cognate footprints emphasize the similar types of interactions made by this group of inhibitors (sulfonamides and related compounds) in the carbonic anhydrase binding site. In particular, the strong interactions between zinc (residue Z), both positive (VDW) or negative (ES), are well-conserved across all inhibitors. Importantly, the plot derived from these crystallographic references provides strong evidence that FPS pharmacophoric patterns are a reproducible property and are thus encoding potentially useful information. Deng et al19 came to a similar conclusion that bit-strings generated with the SIFt method encode useful patterns based on an analysis of 89 kinase-inhibitor complexes. In Figure 12, it should also be emphasized that each diagonal matrix entry represents a separate structure deposited with the PDB thus the receptor length and/or sequences may not be identical (insertions, deletions, missing residues, etc) despite the fact they are all the same protein. To facilitate visualization of multiple receptors together, a protocol incorporating ClustalW40 multi-sequence alignments was developed and the positions labeled X in Figure 12 represent amino acids not conserved across the 29 PDB entries. Besides visualization, the alignment protocol also provides a convenient way to generate multi-receptor (i.e. average) footprints which could also be used for FPS scoring.
Figure 12.
Cognate protein-ligand footprints for the aligned carbonic anhydrase family. Residue X indicates a given residue is not conserved across all crystal structures from the PDB entries in terms of amino acid sequence or signifies a substitution or deletion
Database Enrichment
The last group of experiments to characterize FPS scoring involves database enrichment. Figure 13a–c and Table VI shows enrichment results for three representative systems, neuraminidase, trypsin, and EGFR, taken from the DUD database.5,8 Here, docking was first performed using the grid-based DOCK protocol described in Methods prior to rank-ordering using DCEVDW+ES, FPSVDW+ES, FPSVDW, and FPSES functions. In the present studies, 100% of actives and >96% of decoys produced a viable docked pose. Figure 13 shows standard receiver operator characteristic (ROC) enrichment curves while Table VI lists corresponding area under the curve (AUC) results along with fold enrichment (FE) values computed from the total (FEtot), top 10% (FEtop), and bottom 10% (FEbot) of the ROC curves. It is important to note that unlike other analysis, ROC curves inherently include use of the entire range of FPS score cutoffs. A rank-ordered list (FPS scores with associated molecules) is analyzed by continuously varying the score cutoff from best (zero or few molecules retained) to worst (all molecules retained) score.
Figure 13.
ROC enrichment curves for (a) neuraminidase, (b) trypsin, and (c) EGFR using different ranking methods
Table VI.
Area under the curve (AUC) and accompanying fold enrichment (FE) statistics from receiver operator characteristic (ROC) plots for three protein-ligand systems.
| AUCtota | FEtot = AUCtot / AUCtot, rand |
FEtop = AUCtop / AUCtop, rand |
FEbot = AUCbot / AUCbot, rand |
||
|---|---|---|---|---|---|
| Random | 0.50 | 1.00 | 1.00 | 1.00 | |
|
Neuraminidase 1A4G |
DCEVDW+ES | 0.84 | 1.68 | 11.88 | 1.05 |
| FPSVDW+ES | 0.85 | 1.69 | 6.32 | 1.06 | |
| FPSVDW | 0.56 | 1.12 | 0.64 | 1.04 | |
| FPSES | 0.86 | 1.71 | 9.04 | 1.06 | |
|
Trypsin 1BJU |
DCEVDW+ES | 0.55 | 1.09 | 3.18 | 1.01 |
| FPSVDW+ES | 0.86 | 1.71 | 9.65 | 1.04 | |
| FPSVDW | 0.61 | 1.22 | 3.50 | 0.96 | |
| FPSES | 0.87 | 1.73 | 8.23 | 1.03 | |
|
EGFR 1M17 |
DCEVDW+ES | 0.59 | 1.18 | 6.29 | 0.97 |
| FPSVDW+ES | 0.79 | 1.59 | 9.21 | 1.03 | |
| FPSVDW | 0.67 | 1.35 | 4.89 | 1.03 | |
| FPSES | 0.78 | 1.57 | 8.20 | 1.03 | |
AUCtot is 100% of the database, AUCtop is the top 10%, and AUCbot is the bottom 10%
Visually, the standard DCEVDW+ES (Figure 13 red lines) and FPSVDW+ES (Figure 13 black lines) rankings yield initial steep upwardly sloping ROC curves for all systems which is an indication of "early enrichment" compared to random (Figure 13a, dashed line). The original DUD paper employing DOCK3.58 similarly obtained early strong enrichments for neuraminidase and trypsin although differences in sampling and scoring protocols between the two studies make a direct comparison here difficult. Interestingly, the FPSVDW+ES ROC curves show enrichment is maintained throughout the entire database ranking (Figure 13 black lines) in contrast to DCEVDW+ES which show degradation, in the case of trypsin and EGFR, as increasingly larger percentages of each database are examined (Figure 13 red lines). ROC curves derived using FPSVDW or FPSES methods suggest in some systems better enrichment may be obtained using only a single descriptor. For example, ES-based rankings alone show strong enrichment for neuraminidase in comparison to VDW which is essentially random (Figure 13a blue vs green lines). This finding is physically reasonable considering the highly-charged neuraminidase binding site and consistent with an earlier study from our laboratory in which the best correlation with experimental binding free energies was obtained using the electrostatic component from MM-GBSA calculations.12
From a more quantitative standpoint, fold enrichment statistics using FPSVDW+ES rankings reveal > 9-fold enrichment over random for trypsin (FEtop = 9.65) and EGFR (FEtop = 9.21) in the critically important top 10% region of the ROC curve space (Table VI underlined entries). For neuraminidase in this region, DCEVDW+ES performs best (FEtop = 11.88) followed by the previously mentioned electrostatic term FPSES (FEtop = 9.04) and finally FPSVDW+ES (FEtop = 6.32). With one exception, FPSvdw for neuraminidase (FEtop = 0.64), footprint similarity rankings always lead to significant early fold enrichment versus random (1.00). Good enrichment has also been reported by the groups using related computational methods which encode binding interaction patterns.19,21,23,24,28 For example, Deng et al.19 (see Table 1 in the reference) reported use of the SIFt method led to better enrichment, than two other scoring methods considered, for the identification of 16 known p38 inhibitors out of a database of 1000 decoys. Likewise, ROC curves reported by Marcou et al23 (see Figure 8 in the reference) revealed that use of interaction fingerprints led to stronger enrichment, than other tested scoring functions, using a database of 19 actives and 22,230 decoys.
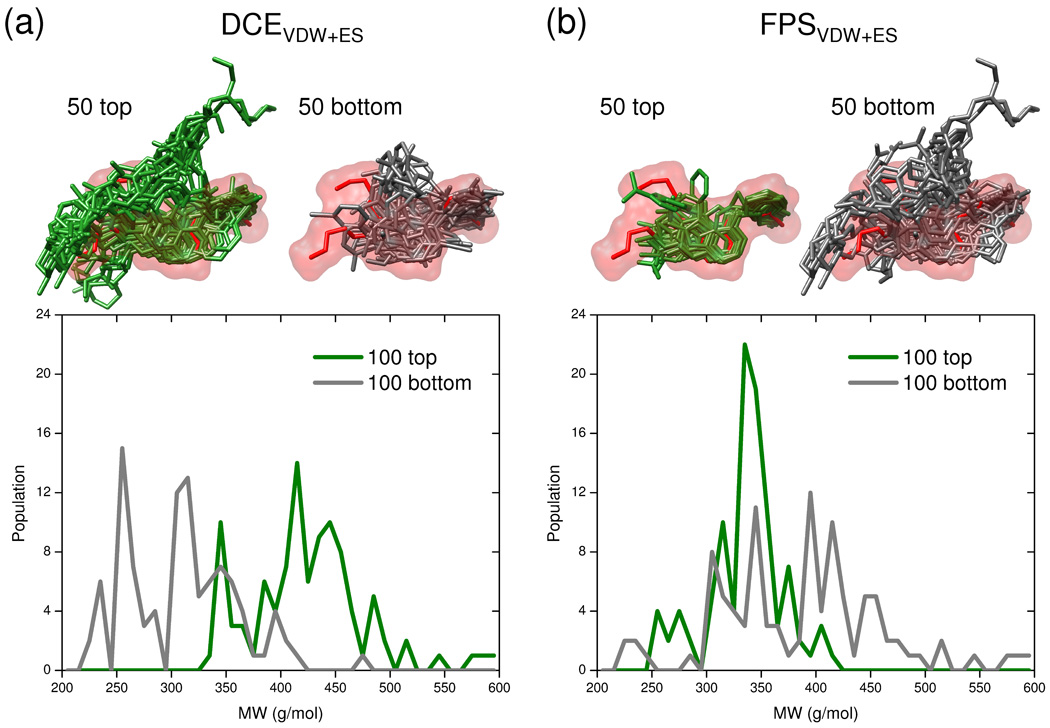
Focusing on the EGFR system, Figure 14 shows differences in the ensemble of docked compounds chosen using either DCEVDW+ES (14a) or FPSVDW+ES (14b) scoring. The top panel in Figure 14 shows overlaid poses representing the top 50 (green = best) or bottom 50 (gray = worst) ranked compounds in relationship to the molecular surface envelope derived from the crystallographic pose of the known drug erlotinib (red surface). The bottom panel in Figure 14 shows corresponding molecular weight (MW) histograms for top (green) and bottom (red) ranked ensembles with the number of compounds increased to 100. It is immediately apparent that DCEVDW+ES scoring leads to MW bias due to the fact that the molecular mechanics-based additive function increases proportionally with ligand size.41 The ensemble of top-ranked compounds in Figure 14a yield significantly larger ligands (green molecules and MW curve) which, in this example, do not appear to fit as well in the molecular surface envelope of erlotinib as bottom ranked compounds which are smaller (gray molecules and MW curve). In sharp contrast, when FPS score rankings are employed using erlotinib as a reference, the 50 top ligands fit the molecular surface envelope almost perfectly (Figure 14b top panel). Further, MW bias of top-ranked ligands here does not favor size but instead favors MW similar to that of the reference (erlotinib = 393.44 g/mol) as shown by the large green MW peak in Figure 14b (bottom panel). Interestingly, the top-ranked molecules using FPS are somewhat smaller on average than erlotinib (ca 340 vs 393 g/mol) which, for this example, is likely a function of the composition of the DUD database. Bottom ranked ligands show no particular bias and are spread throughout the entire MW range (Figure 14b gray line). Overall, the current FPS implementation appears to yield targeted, understandable, and robust enrichments.
Figure 14.
Graphical representation of the 50 top and 50 bottom ranked poses obtained from docking the 475 active ligands from the DUD EGFR database and using (a) DCEVDW1ES and (b) FPSVDW1ES scoring functions. The reference (erlotinib) is shown in red surface with top ligands in green and bottom ligands in gray. On the bottom are corresponding histograms of molecular weight (MW) for the 100 top (best) and 100 bottom (worst) ranked molecules. Note that the large MW peak at ca. 340 for the 100 best scoring molecules using FPSVDW1ES corresponds ca. to the MW of the erlotinib reference (393.44 g/mol).
As a final example of the potential utility of FPS scoring, Figure 15 shows representative virtual screening results for EGFR, derived from docking and rescoring of 906,914 commercially available compounds from the ZINC database42 (Chemdiv vendor), to ascertain how many compounds would be identified which make interactions similar to that of erlotinib at a given FPS score cutoff. Although the number of compounds identified at any score cutoff is likely to be system dependent, and a function of which database is screened and which reference molecule is employed, the results in Figure 15 suggest a reasonable number of molecules (i.e. 25 to 201 molecules) can readily be identified out of ca. 1 million compounds using a score cutoff range of 0.8–0.9. Similar to the results obtained in the DUD example above (Figure 14b), the graphic in Figure 15 highlights significant pose overlap in docked geometries for the 25 compounds obtained using a 0.8 cutoff from the virtual screen, which fit well into the molecular surface envelope defined by the reference erlotinib (red).
Figure 15.
Number of molecules retained from a virtual screen of 906,914 molecules to EGFR using various FPSVDW1ES score cutoff values. The graphic shows the 25 molecules identified (green) using a cutoff of 0.8 in comparison with the known drug erlotinib (red) which was used as the footprint reference
Conclusion
The primary goal of this study was to introduce and evaluate a new DOCK scoring function, termed footprint similarity (FPS) score which employs per-residue interaction maps (footprints) to derive a binding site comparison metric between any two molecules. From a practical standpoint, FPS scoring facilitates rapid identification of ligands whose binding interaction patterns resemble that of a reference molecule used as an input query. Thus, the method may find utility in a variety of structure-based drug design scenarios. Potentially useful outcomes include identification of ligands which make footprints similar to known drugs or inhibitors, native substrates or cofactors, transition states, or side-chains which mediate protein-protein interactions (Table I). Identification of ligands with footprints similar to a known reference but based on novel chemotypes could facilitate scaffold hopping. And, identification of ligands having footprints which do not rely on residues that are prone to mutation could enable development of inhibitors with enhanced resistance profiles.
Several FPS score types were evaluated in this study (Table II) which employed footprints based on intermolecular van der Waals energies (FPSVDW), Coulombic energies scaled by a distance dependent dielectric constant (FPSES), and hydrogen bond energies (FPSHB). Combination scores constructed from two (FPSVDW+ES) or three (FPSVDW+ES+HB) footprint types were also evaluated. Footprint similarities were quantified using standard Euclidean Distance, normalized Euclidean Distance, standard Pearson Correlation, and threshold Pearson Correlation metrics (Tables II–III) and functional relationships between these methods were examined (Figure 6). Results using the different FPS protocols were compared with those obtained using the standard DOCK Cartesian energy scoring function (DCEVDW+ES) on tests designed to primarily assess accuracy of (1) pose identification and (2) database enrichment using cognate ligands from crystallographic complexes deposited in the PDB as references. To facilitate comparison with the work presented here, should other groups wish to evaluate their interaction-based functions and/or docking codes, the datasets for pose identification and crossdocking are available from the SB20107 website (http://rizzolab.org) and for enrichment from the DUD8 website (http://dud.docking.org).
With one exception, all FPS protocols yielded improved pose identification success, using three large datasets (680–775 systems) to assess accuracy, relative to using comparable DCE methods (Table III). Overall, the FPSVDW+ES function in combination with normalized Euclidian distance yielded the best results (Table III). Success using FPSVDW+ES, defined as the pose being ≤ 2.0 Å from experiment, showed increases over analogous DCEVDW+ES scores by ca 10%, 6%, and 12% using rigid (RGD = 775), fixed anchor (FAD = 748), and flexible (FLX=680) perfect sampling subsets derived from the SB20107 database. Additional tests, using ensembles derived from crossdocking (29 ligands to 29 receptors) showed significantly greater success (matrix coverage) using two different FPS protocols (45.4% and 70.9%) compared with DCE (17.8%) for a challenging carbonic anhydrase family (Figure 11).
A close examination of results (Table IV, Figure 7) classified as false positive (good FPS score and bad rmsd) revealed in many cases, poses that were both geometrically and chemically correct (Figures 8–9) and that misclassifications can result due to deficiencies with how current DOCK pair-wise rmsd routines handle symmetry. The results indicate the reported success rates for pose identification are in fact a lower bound on the potential accuracy of the calculations. A related issue, in which otherwise well-overlaid ligands showed rmsds > 2.0 Å rmsd was traced to differences only in solvent exposed moieties (Figure 8) which for many cases would not reasonably be considered a failure. Examination of false negatives (bad FPS score and good rmsd, Table V) revealed in some cases that small variations in pose geometry can yield larger than expected differences in energy (Figure 10), especially for interactions involving charged groups and/or polar hydrogens, which highlights the need for care when preparing a reference.
Area under the curve (AUC) and fold enrichment (FE) statistics (Table VI) derived from receiver operator characteristic (ROC) curves (Figure 13), for three representative systems from the DUD database,8 reveal significant fold enrichment using FPSVDW+ES (neuraminidase = 6.32, trypsin = 9.65, and EGFR = 9.21) compared to random (1.00) in the most critical early regime (top 10%) of the ranked databases. In two out of three cases, the FPSVDW+ES enrichment exceed those obtained using the standard DOCK DCEVDW+ES scores (Table VI). Close inspection of EGFR results reveals DCEVDW+ES scoring leads to top-ranked molecules not well-accommodated in the molecular surface envelope defined by the cognate ligand erlotinib and have a distinct MW bias towards larger molecules (Figure 14a). In sharp contrast, top-ranked molecules using FPSVDW+ES using erlotinib as the footprint reference lead to poses which nicely fit within the binding envelope and have a MW biased towards the reference (Figure 14b). Finally, the potential utility of the method for identification of novel compounds was demonstrated by a representative virtual screen to EGFR. On-the-fly flexible ligand docking of ca 1 million compounds obtained from ZINC,8 followed by FPSVDW+ES re-ranking using erlotinib as a reference (Figure 15), yielded a reasonable number of compounds (25–201) with good FPS scores (0.8–0.9) available for purchase. Taken together, the results of this comprehensive study strongly suggest the implementation of footprint-based comparison methods into DOCK will have utility for structure-based design. A future goal, based on studies in progress, is to incorporate molecular footprints with de novo design methods to bias construction of new ligands from scratch towards that of a reference.
Supplementary Material
Acknowledgments
Gratitude is expressed to Jie Wu for help in code development during the beginning stages of this work, to Kenneth Ascher, William Berger, Rashi Goyal, Patrick Holden, and Yulin Huang for computational assistance, and Kenneth Foreman for helpful discussions. This research utilized resources at the New York Center for Computational Sciences at Stony Brook University/Brookhaven National Laboratory which is supported by the U.S. Department of Energy under Contract No. DE-AC02-98CH10886 and by the State of New York. This work was funded in part by the Stony Brook University Office of the Vice President for Research, the New York State Office of Science Technology and Academic Research (NYSTAR), and NIH grants R01GM083669 (to R.C.R) and F31CA134201 (to T.E.B).
References
- 1.Kuntz ID. Science. 1992;257:1078–1082. doi: 10.1126/science.257.5073.1078. [DOI] [PubMed] [Google Scholar]
- 2.Jorgensen WL. Science. 2004;303:1813–1818. doi: 10.1126/science.1096361. [DOI] [PubMed] [Google Scholar]
- 3.Shoichet BK. Nature. 2004;432:862–865. doi: 10.1038/nature03197. [DOI] [PMC free article] [PubMed] [Google Scholar]
- 4.McGaughey GB, Sheridan RP, Bayly CI, Culberson JC, Kreatsoulas C, Lindsley S, Maiorov V, Truchon JF, Cornell WD. J Chem Inf Model. 2007;47:1504–1519. doi: 10.1021/ci700052x. [DOI] [PubMed] [Google Scholar]
- 5.Irwin JJ. J Comput Aided Mol Des. 2008;22:193–199. doi: 10.1007/s10822-008-9189-4. [DOI] [PubMed] [Google Scholar]
- 6.Jain AN, Nicholls A. J Comput Aided Mol Des. 2008;22:133–139. doi: 10.1007/s10822-008-9196-5. [DOI] [PMC free article] [PubMed] [Google Scholar]
- 7.Mukherjee S, Balius TE, Rizzo RC. J Chem Inf Model. 2010;50:1986–2000. doi: 10.1021/ci1001982. [DOI] [PMC free article] [PubMed] [Google Scholar]
- 8.Huang N, Shoichet BK, Irwin JJ. J Med Chem. 2006;49:6789–6801. doi: 10.1021/jm0608356. [DOI] [PMC free article] [PubMed] [Google Scholar]
- 9.Kuntz ID, Blaney JM, Oatley SJ, Langridge R, Ferrin TE. J Mol Biol. 1982;161:269–288. doi: 10.1016/0022-2836(82)90153-x. [DOI] [PubMed] [Google Scholar]
- 10.Lang PT, Brozell SR, Mukherjee S, Pettersen EF, Meng EC, Thomas V, Rizzo RC, Case DA, James TL, Kuntz ID. RNA. 2009;15:1219–1230. doi: 10.1261/rna.1563609. [DOI] [PMC free article] [PubMed] [Google Scholar]
- 11.Strockbine B, Rizzo RC. Proteins: Struct Func Bioinformatics. 2007;67:630–642. doi: 10.1002/prot.21301. [DOI] [PubMed] [Google Scholar]
- 12.Chachra R, Rizzo RC. J Chem Theory Comput. 2008;4:1526–1540. doi: 10.1021/ct800068v. [DOI] [PubMed] [Google Scholar]
- 13.Balius TE, Rizzo RC. Biochemistry. 2009;48:8435–8448. doi: 10.1021/bi900729a. [DOI] [PMC free article] [PubMed] [Google Scholar]
- 14.McGillick BE, Balius TE, Mukherjee S, Rizzo RC. Biochemistry. 2010;49:3575–3592. doi: 10.1021/bi901915g. [DOI] [PMC free article] [PubMed] [Google Scholar]
- 15.Tominaga Y, Jorgensen WL. J Med Chem. 2004;47:2534–2549. doi: 10.1021/jm0304358. [DOI] [PubMed] [Google Scholar]
- 16.Gohlke H, Kiel C, Case DA. J Mol Biol. 2003;330:891–913. doi: 10.1016/s0022-2836(03)00610-7. [DOI] [PubMed] [Google Scholar]
- 17.Zou H, Luo C, Zheng S, Luo X, Zhu W, Chen K, Shen J, Jiang H. J Phys Chem B. 2007;111:9104–9113. doi: 10.1021/jp0713763. [DOI] [PubMed] [Google Scholar]
- 18.Carrascal N, Green DF. J Phys Chem B. 2010;114:5096–5116. doi: 10.1021/jp910540z. [DOI] [PubMed] [Google Scholar]
- 19.Deng Z, Chuaqui C, Singh J. J Med Chem. 2004;47:337–344. doi: 10.1021/jm030331x. [DOI] [PubMed] [Google Scholar]
- 20.Kelly MD, Mancera RL. J Chem Inf Comput Sci. 2004;44:1942–1951. doi: 10.1021/ci049870g. [DOI] [PubMed] [Google Scholar]
- 21.Chuaqui C, Deng Z, Singh J. J Med Chem. 2005;48:121–133. doi: 10.1021/jm049312t. [DOI] [PubMed] [Google Scholar]
- 22.Deng Z, Chuaqui C, Singh J. J Med Chem. 2006;49:490–500. doi: 10.1021/jm050381x. [DOI] [PubMed] [Google Scholar]
- 23.Marcou G, Rognan D. J Chem Inf Model. 2007;47:195–207. doi: 10.1021/ci600342e. [DOI] [PubMed] [Google Scholar]
- 24.Mpamhanga CP, Chen B, McLay IM, Willett P. J Chem Inf Model. 2006;46:686–698. doi: 10.1021/ci050420d. [DOI] [PubMed] [Google Scholar]
- 25.Pfeffer P, Neudert G, Klebe G. Chemistry Central Journal. 2008;2:S16. [Google Scholar]
- 26.Renner S, Derksen S, Radestock S, Morchen F. J Chem Inf Model. 2008;48:319–332. doi: 10.1021/ci7003626. [DOI] [PubMed] [Google Scholar]
- 27.Nandigam RK, Kim S, Singh J, Chuaqui C. J Chem Inf Model. 2009;49:1185–1192. doi: 10.1021/ci800466n. [DOI] [PubMed] [Google Scholar]
- 28.Pérez-Nueno VI, Rabal O, Borrell JI, Teixidó J. J Chem Inf Model. 2009;49:1245–1260. doi: 10.1021/ci900043r. [DOI] [PubMed] [Google Scholar]
- 29.Brewerton SC. Curr Opin Drug Discovery Dev. 2008;11:356–364. [PubMed] [Google Scholar]
- 30.Triballeau N, Acher F, Brabet I, Pin J-P, Bertrand H-O. J Med Chem. 2005;48:2534–2547. doi: 10.1021/jm049092j. [DOI] [PubMed] [Google Scholar]
- 31.Ewing TJA, Makino S, Skillman AG, Kuntz ID. J Comput Aided Mol Des. 2001;15:411–428. doi: 10.1023/a:1011115820450. [DOI] [PubMed] [Google Scholar]
- 32.Moustakas DT, Lang PT, Pegg S, Pettersen E, Kuntz ID, Brooijmans N, Rizzo RC. J Comput Aided Mol Des. 2006;20:601–619. doi: 10.1007/s10822-006-9060-4. [DOI] [PubMed] [Google Scholar]
- 33.Taylor NR, Cleasby A, Singh O, Skarzynski T, Wonacott AJ, Smith PW, Sollis SL, Howes PD, Cherry PC, Bethell R, Colman P, Varghese J. J Med Chem. 1998;41:798–807. doi: 10.1021/jm9703754. [DOI] [PubMed] [Google Scholar]
- 34.Presnell SR, Patil GS, Mura C, Jude KM, Conley JM, Bertrand JA, Kam CM, Powers JC, Williams LD. Biochemistry. 1998;37:17068–17081. doi: 10.1021/bi981636u. [DOI] [PubMed] [Google Scholar]
- 35.Stamos J, Sliwkowski MX, Eigenbrot C. J Biol Chem. 2002;277:46265–46272. doi: 10.1074/jbc.M207135200. [DOI] [PubMed] [Google Scholar]
- 36.Kroemer RT, Vulpetti A, McDonald JJ, Rohrer DC, Trosset J-Y, Giordanetto F, Cotesta S, McMartin C, Kihlen M, Stouten PFW. J Chem Inf Comput Sci. 2004;44:871–881. doi: 10.1021/ci049970m. [DOI] [PubMed] [Google Scholar]
- 37.Trott O, Olson AJ. J Comput Chem. 2010;31:455–461. doi: 10.1002/jcc.21334. [DOI] [PMC free article] [PubMed] [Google Scholar]
- 38.Hauel NH, Nar H, Priepke H, Ries U, Stassen J-M, Wienen W. J Med Chem. 2002;45:1757–1766. doi: 10.1021/jm0109513. [DOI] [PubMed] [Google Scholar]
- 39.Nar H, Bauer M, Schmid A, Stassen JM, Wienen W, Priepke HW, Kauffmann IK, Ries UJ, Hauel NH. Structure. 2001;9:29–37. doi: 10.1016/s0969-2126(00)00551-7. [DOI] [PubMed] [Google Scholar]
- 40.Larkin MA, Blackshields G, Brown NP, Chenna R, McGettigan PA, McWilliam H, Valentin F, Wallace IM, Wilm A, Lopez R, Thompson JD, Gibson TJ, Higgins DG. Bioinformatics. 2007;23:2947–2948. doi: 10.1093/bioinformatics/btm404. [DOI] [PubMed] [Google Scholar]
- 41.Kuntz ID, Chen K, Sharp KA, Kollman PA. Proc Natl Acad Sci U S A. 1999;96:9997–10002. doi: 10.1073/pnas.96.18.9997. [DOI] [PMC free article] [PubMed] [Google Scholar]
- 42.Irwin JJ, Shoichet BK. J Chem Inf Model. 2005;45:177–182. doi: 10.1021/ci049714. [DOI] [PMC free article] [PubMed] [Google Scholar]
Associated Data
This section collects any data citations, data availability statements, or supplementary materials included in this article.


