

Abstract
Primary effusion lymphoma (PEL) is a non-Hodgkin's B-cell lymphoma driven by Kaposi's sarcoma-associated herpesvirus. It is uniquely sensitive to mTOR, PI3K, and Akt inhibitors; however, the basis of this requirement for the mTOR pathway remains to be elucidated. The phosphatase and tensin homolog gene (PTEN) on chromosome 10 controls the first step in the phosphatidylinositol 3 kinase (PI3K)-Akt-mammalian target of rapamycin (mTOR) pathway and is genetically inactivated in many solid tumors. We find an absence of PTEN deletions, mutations, or protein mislocalization in PEL. However, we find consistent hyperphosphorylation at serine 380 of PTEN, which is an inactivating modification, in PEL cell lines and in tumor xenografts. We also evaluated a large tissue microarray of Kaposi's sarcoma biopsies and observed concordant high levels of phospho-PTEN, phospho-Akt, and phospho-S6 ribosomal protein. Reintroduction of PTEN into PEL inhibited colony formation in soft agar, verifying the functional dependence of PEL on PI3K signaling. This was also true for PEL cell lines that carried mutant p53 and for KS-like cell lines. Activating PTEN in these cancers may yield a new treatment strategy for PEL, KS, and similar PTEN wild-type lymphomas.
Primary effusion lymphoma (PEL) was initially identified as an AIDS-associated non-Hodgkin's lymphoma with a poor prognosis.1 PEL also occurs in the absence of HIV infection (eg, in transplant recipients taking immune-suppressive drugs).2,3 PEL is strongly associated with Kaposi's sarcoma-associated herpesvirus (KSHV) infection.2–4 KSHV, known formally as human herpesvirus 8 (HHV-8), shows primary tropism for B cells and endothelial cells. In addition to KSHV infection, PEL cells can be coinfected with Epstein-Barr virus [EBV; formally known as human herpesvirus 4 (HHV-4)].5
KSHV is also the causative agent of Kaposi's sarcoma (KS), a tumor of endothelial cell lineage. KS is characteristically seen in HIV-infected patients, but also occurs with reduced frequency in other settings of immune suppression (eg, in solid organ transplant recipients).6 In addition, KS is found in elderly patients in the absence of overt immune deficiency (classic KS) and in children in KSHV-endemic regions, such as Sub-Saharan Africa. Stallone et al7 reported on a series of transplant patients who developed KS. On switching from cyclosporine to another immunosuppressant, rapamycin, the KS lesions regressed; however, the same patients maintained normal graft function, because rapamycin maintained T cell-targeted immunosuppression7. Multiple studies have confirmed this finding,8–11 although others have described cases of KS and PEL that responded only partially or did not respond to rapamycin.12–16 There has also been speculation on whether rapamycin acts in a direct or indirect manner via immune modulation only.17 Thus, there is a need to understand the molecular mechanism of both rapamycin and its analogs in PEL and KS, and to evaluate potential biomarkers that could help in predicting response.
Rapamycin binds to and inhibits the activity of mammalian target of rapamycin complex-1 (mTORC1),18 a downstream effector of the phosphatidylinositol-3-kinase (PI3K) signaling cascade. Phosphorylation of receptor tyrosine kinases results in activation of the p110 catalytic subunit of phosphatidylinositol 3 kinase (PI3K), which then phosphorylates membrane-associated phospholipid phosphatidylinositol-4,5-biphosphate (PIP2) to become phosphatidylinositol-3,4,5-triphosphate (PIP3). PIP3 recruits the protein serine-threonine kinase Akt to the plasma membrane. Akt is phosphorylated on serine 473 by mTORC2 and by PI3K-dependent kinase 1 (PDK1) on threonine 308. Activated Akt then phosphorylates downstream targets, mTORC1 being one of its effectors.19–23
The protein encoded by the phosphatase and tensin homolog gene (PTEN), located on band q23 of chromosome 10, constitutes a key negative regulator of the PI3K-mTOR signaling pathway. It can revert phospholipid PIP3 to PIP2, thereby counteracting the activation of Akt by PDK1.19,22,24–30 PTEN is frequently mutated in human cancers.22,24–28,30 Ectopic expression of PTEN in tumor cells results in cell cycle arrest or apoptosis.31,32 PTEN exists either in a hypo- or hyperphosphorylated state, corresponding to active (open) and inactive (closed) enzymatic states, respectively.33 PTEN expression and phosphorylation status thus serve as markers for PTEN activity. Various solid tumors that require PI3K-mTOR signaling have either a deletion or mutation in PTEN34; however, the status of PTEN in PEL and KS remains a subject of investigation. Our research group has previously reported that rapamycin inhibits PEL in culture, in a mouse model, and in a patient.35 These findings suggest that PEL belongs to a class of cancers, such as Mantle Cell Lymphoma, that depend on PI3K-Akt-mTOR signaling. KSHV proteins may activate mTORC1 through cellular receptor engagement (by vIL6) or through PI3K activation (by viral proteins such as vGPCR and K1),36–38 further corroborating the dependence of KSHV-infected cells on PI3K-mTOR signaling. In the present study, we examined whether, in addition to viral factors, host genetic aberrations in PTEN contribute to the required activity of the PI3K-Akt-mTOR pathway in PEL and KS.
Materials and Methods
Cell Culture
B-cell lines were cultured in RPMI Medium 1640 supplemented with 100 μg/mL streptomycin sulfate, 100 U/mL penicillin G (Invitrogen Life Technologies, Carlsbad, CA), 2 mmol/L l-glutamine, 0.05 mmol/L 2-mercaptoethanol, 0.075% sodium bicarbonate, 1 U/mL IL-6 (PeproTech, Rocky Hill, NJ), and 10% fetal bovine serum (Mediatech, Manassas, VA) at 37°C in 5% CO2. The cell lines are characterized in Table 1.
Table 1.
Summary of PEL Cell Lines, with Literature Citations
| Cell line | Lymphoma type | KSHV | EBV | p53 | PTEN | Rapamycin sensitivity |
|---|---|---|---|---|---|---|
| BCP139 | PEL | + | − | S262; homozygous insertion | Wild type | <50 nmol/L |
| BC140 | PEL | + | + | Wild type | Wild type | <10 nmol/L |
| BC240 | PEL | + | + | Wild type⁎ | Wild type | <50 nmol/L |
| BC341 | PEL | + | − | Wild type | Wild type | <50 nmol/L |
| BC542 | PEL | + | + | Wild type⁎ | Wild type | <50 nmol/L |
| BCBL143 | PEL | + | − | M246I; heterozygous mutation | Wild type | 5.5 mmol/L |
| BCLM44 | PEL | + | − | Wild type | Wild type | <50 nmol/L |
| BJAB45 | Burkitt's | − | − | Deletion; nonfunctional | Wild type | <1 nmol/L |
| DG7546 | Burkitt-like | − | − | R283H; heterozygous47 | Wild type | Not tested |
| JSC148 | PEL | + | + | Wild type | Wild type | <50 nmol/L |
| TY149 | PEL | + | − | S262; insertion; M246I | Wild type | <50 nmol/L |
| VG150 | PEL | + | − | Wild type | Wild type | <50 nmol/L |
Present study.
Comparative Genomic Hybridization Analysis
Genomic DNA was isolated from the PEL cell lines using a Wizard genomic DNA purification kit (Promega, Madison, WI) according to the manufacturer's protocol. Genomic profiles were obtained by hybridizing the DNA to GeneChip 250K Nsp and 250K Sty human mapping arrays (Affymetrix, Santa Clara, CA), which contain markers for copy number determination, in addition to single nucleotide polymorphisms. All data were analyzed using the Partek Genomics Suite version 6.0 (Partek, St. Louis, MO). Raw data were imported and adjusted for background using a robust multiarray algorithm. Copy numbers were assessed using the software suite's unpaired analysis and were compared with baseline created using normal tonsil control DNA. Copy number variation was represented in both the heat map and the dot-plot profile along the length of the individual chromosomes using a visualization scheme from the Partek software suite.
PCR and Sequencing
Genomic DNA was isolated using a Wizard genomic DNA purification kit (Promega). PCR amplification was performed using GoTaq PCR master mix (Promega). Specific primers, flanking individual exons, were as given in Table 2. The amplified fragments were subjected to Sanger sequencing. mRNA expression was determined using cDNA subject to RT-PCR, using primers as given in Table 2. cDNA was synthesized from total RNA isolated from PEL cells using TRIzol extraction and an ABI high capacity cDNA reverse transcription kit (Invitrogen Life Technologies) according to the manufacturer's protocol.
Table 2.
Primer Sequence and Annealing Temperature for PCR Analysis, with Literature Citations
| Exon | Forward primer | Reverse primer | Annealing temperature, °C |
|---|---|---|---|
| Exon 124 | 5′-ATTTCCATCCTGCAGAAGAAGC-3′ | 5′-CATCCGTCTACTCCCACGTTCT-3′ | 55 |
| Exon 224 | 5′-AGTTTGATTGCTGCATATTTCAGA-3′ | 5′-TCTTTTTCTGTGGCTTAGAAATCTTTT-3′ | 55 |
| Exon 324 | 5′-ATGGTATTTGAGATTAGGAA-3′ | 5′-TGGACTTCTTGACTTAATCGGTTT-3′ | 55 |
| Nested exon 4, Outer24 | 5′-GTTAAACACAGCATAATATGTGTCACATT-3′ | 5′-TTAAAGATAATTCTTAAAT-3′ | 51 |
| Nested exon 4, Inner24 | 5′-AAAGATTCAGGCAATGTTTGTTAGT-3′ | 5′-TGTATCTCACTCGATAATCTGGATG-3′ | 51 |
| Alternate exon 451 | 5′-CATTATAAAGATTCAGGCAATG-3′ | 5′-GACAGTAAGATACAGTCTATC-3′ | 58 |
| Exon 524 | 5′-ATCCAGTGTTTCTTTTAAATA-3′ | 5′-ATCTGTTTTCCAATAAATTCT-3′ | 55 |
| Exon 624 | 5′-CTAATGTATATATGTTCTTAA-3′ | 5′-CTTCTAGATATGGTTAAGAAA-3′ | 50 |
| Exon 724 | 5′-GTATATTGCTGATATTAATCATT-3′ | 5′-ATTATAGTTCCTTACATGTCA-3′ | 55 |
| Exon 824 | 5′-TTTTGGGTAAATACATTCTT-3′ | 5′-CGCACCTTTGCCCCAGAT-3′ | 55 |
| Alternate exon 851 | 5′-TGTCATTTCATTTCTTTTTCTTTTC-3′ | 5′-AAGTCAACAACCCCCACAAA-3′ | 56 |
| Exon 924 | 5′-TGTTGAACATCTTAAGAAGA-3′ | 5′-ATGACACAGCTACACAACCTT-3′ | 55 |
| RT-PCR52 | 5′-CGAACTGGTGTAATGATATGT-3′ | 5′-CATGAACTTGTCTTCCCGT-3′ | 60 |
Immunoblot Analysis
Western blot analysis of cells (1 × 10⁶ to 5 × 10⁶) was performed as described previously.35 The primary antibodies used were rabbit PTEN-specific and phospho-PTEN-specific (S380) (Cell Signaling Technology, Danvers, MA) diluted 1:1000 in blocking solution. Horseradish peroxidase-conjugated secondary antibody (Vector Laboratories, Burlingame, CA) was diluted 1:5000 and blots were visualized using Pierce ECL Western blotting substrate (Thermo Scientific, Rockford, IL). We used horseradish peroxidase-conjugated actin-specific monoclonal antibody (Abcam, Cambridge, MA) at 1:10,000 dilution as control.
Immunofluorescence Analysis
Cells were cultured overnight on glass coverslips in six-well plates (Falcon; BD Biosciences, San Jose, CA). They were washed in PBS and stained for immune fluorescence as described.53 Primary antibodies used were rabbit PTEN-specific, rabbit phospho-PTEN-specific (S380) (Cell Signaling Technology) diluted 1:100 and mouse LANA-specific (Leica Microsystems-Novocastra Laboratories, Newcastle, UK), diluted 1:600. Images were captured with a Leica DM4000B fluorescence microscope (Leica Microsystems, Wetzlar, Germany) equipped with a 63/1.4 to 0.6 numerical aperture objective and a Q-Imaging Retiga 2000RV camera. Raw single microscopy images were deconvoluted using SimplePCI (Hamamatsu, Sewickley, PA) two-dimensional blind deconvolution, which iteratively applies an AutoQuant Imaging (Media Cybernetics, Bethesda, MD) proprietary algorithm to remove blur and generate high-clarity images. Images were stored as TIFF files.
Tissue Microarray
Unstained and LANA-stained tissue microarrays were obtained from the AIDS and Cancer Specimen Resource.54
Immunohistochemistry
Solid tumors were removed from SCID mice injected subcutaneously with BC-1 cells in growth factor-reduced Matrigel and fixed in 5 mL 10% neutral buffered formalin (Fisher Diagnostics, Pittsburgh, PA) for 2 days, embedded in paraffin, and cut into sections (7 μm thick). Sections were deparaffinized and rehydrated using HistoChoice clearing agent (Sigma-Aldrich, St Louis, MO) and then incubated in 3% hydrogen peroxide diluted in 10% methanol to block the endogenous peroxidase activity. For antigen retrieval, samples were heated in a microwave oven for 20 minutes in Retrivagen A (pH 6.0) solution (BD Biosciences) and blocked with 10% horse serum (Vector Laboratories) diluted in PBS supplemented with 5% bovine serum albumin and 0.3% Triton X-100. Samples were then incubated with primary antibody diluted 1:100 (except 1:500 for Ki67) in blocking buffer at room temperature for 1 hour and then, after a series of PBS washes, were developed with VectaStain ABC kit (Vector Labs). Sections were developed with Vector NovaRed substrate (Vector Labs) for 5 to 10 minutes and counterstained with hematoxylin. Sections were dehydrated using an alcohol series and HistoChoice clearing agent washes and then mounted using CytoSeal mounting medium (Richard-Allan Scientific, Kalamazoo, MI). Primary antibodies were Ki67 (Novocastra Laboratories) phospho-PTEN serine 380 (S380) residue (Millipore, Billerica, MA), phospho-Akt threonine 308 (T308) residue, and phospho-S6-ribosomal protein serine 235/236 (S235/236) residues (Cell Signaling Technology). Sections were imaged using a Leica DM LA histology microscope equipped with a 10/0.25 numerical aperture or a 40/0.75 numerical aperture N Plan objective and a Leica DPC 480 camera. Images were stored as TIFF files under Macintosh OS X10.5. Image intensity was quantified using FRIDA software (Framework for Image Dataset Analysis; available at http://bui2.win.ad.jhu.edu/frida). Data were normalized to intensity per core, and the square root of the intensity count was used for linear regression analysis. Linear regression was conducted using GNU open-source R statistical software (version 2.12.1; available at http://www.r-project.org).
Growth Suppression Assay
The human PTEN cDNA pORF-hPTEN was obtained from InvivoGen (San Diego, CA) and cloned into pMONO-blasti-mcs, pDD1538 (InvivoGen), under the control of the constitutive ferritin promoter to yield pMONO-blasti-hPTEN. The construct was verified by restriction analysis and two independent clones, pDD1540 (clone 1) and pDD1541 (clone 7), were used for further analysis. pMONO-blasti-mcs carries the blasticidin selection marker. DNA was introduced into PEL cells (5 × 10⁶ to 7 × 10⁶) by nucleofection, according to the manufacturer's protocol (Lonza, Basel, Switzerland; Walkersville, MD). Nucleofected cells were recovered in complete medium overnight and suspended in 0.3% agar before plating on 0.5% soft agar in complete RPMI Medium 1640 supplemented with 6 μg/mL of blasticidin (selection marker) and growth was assessed 2 weeks later. In the case of KS-like endothelial cells, cells were transfected using SuperFect transfection reagent (Qiagen, Valencia, CA) according to the manufacturer's protocol and plated on 10-cm dishes. Colonies were allowed to form over a period of 2 weeks. Colonies were then stained with 200× Magic Stain (3 g Crystal Violet and 0.8 g ammonium oxalate in 20% ethanol) diluted to approximately 10× in water and counted. Data were plotted using the R statistics environment (v2.12.1) and significance was determined using the nonparametric Wilcoxon signed rank test.
Results
The PTEN Gene Is Wild Type in PEL
To determine whether PEL carries gross genomic abnormalities at the PTEN locus, we performed copy number analysis using the Affymetrix 500K array for a large set of PEL cell lines (GEO accession ID GSE28684). We did not detect any loss of heterozygosity or amplifications or deletions associated with the PTEN locus on chromosome 10, with the exception of the BC2 cell line (Figure 1A). On chromosome 3, which served as control; all PEL cell lines showed a loss specifically at a common fragile site locus encoding the fragile histidine triad gene (FHIT), in an otherwise normal region (Figure 1B). Amplification of the short p-arm of chromosome 3 was observed in 4/10 PELs. The normal distribution of markers along chromosome 10 indicates the absence of any gross genomic aberrations of the 10-kb PTEN locus in PEL.
Figure 1.
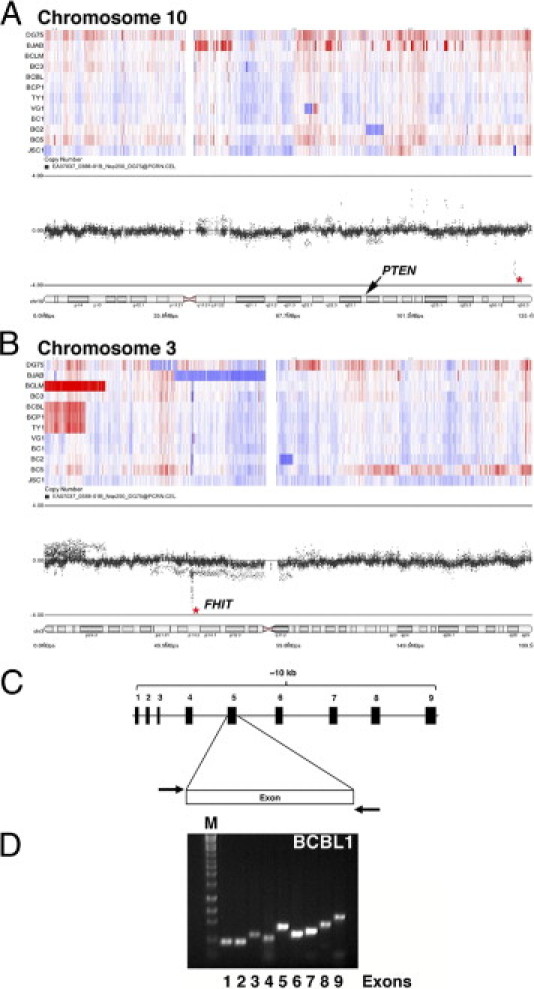
PTEN is wild type in PEL. A and B: Using an Affymetrix 500K single nucleotide polymorphism array, we observed that the majority of PELs do not show genomic gain or loss at the PTEN locus on chromosome 10 (A). Chromosome 3 served as control; distinct loss was noted at the FHIT locus, a known common fragile site gene (B). Heat maps indicate loss (blue) and gain (red). The dot profiles show the distribution of markers along the chromosome; an asterisk marks a small region that is specifically lost in an otherwise normal chromosomal region. On chromosome 10 (A), this does not correspond to any known transcripts; on chromosome 3 (B), it corresponds to FHIT. The labeled cytobands indicate location of PTEN (A) and FHIT (B). C and D: Genomic DNA was isolated from individual PEL cell lines and each of the exons was amplified using specific primers (listed in Table 2). C: Schematic of the organization of the primers used. D: A representative PCR gel showing detection of all nine exons in BCBL-1 cells.
To further investigate the status of the PTEN locus, we amplified each of the nine exons of the PTEN gene (Figure 1C) individually from 10 PEL and 2 non-PEL lymphoma cell lines. This represents a majority of all PEL cells lines that can successfully be grown in culture and form tumors in immunodeficient mice (Refs. 35,55 and D.R., unpublished data). All nine exons were present in the BCBL-1 cell line (Figure 1, C and D). We found no gross deletions in any of the PTEN exons in any of the 10 independent PEL cell lines. We sequenced each of the PTEN exons for the individual PEL cell lines and were unable to detect any aberrations in the genomic sequence. These data have been submitted to GenBank (submission ID 1367943).
The PTEN Protein Is Expressed and Hyperphosphorylated in PEL
Because PTEN can be epigenetically silenced in some cancers,24,56 we wanted to determine whether PTEN mRNA and PTEN protein are expressed in PEL. Using RT-PCR, we detected PTEN mRNA in all of our PEL cell lines (Figure 2). These data led us to exclude the possibility of promoter silencing of the PTEN locus in PEL.
Figure 2.
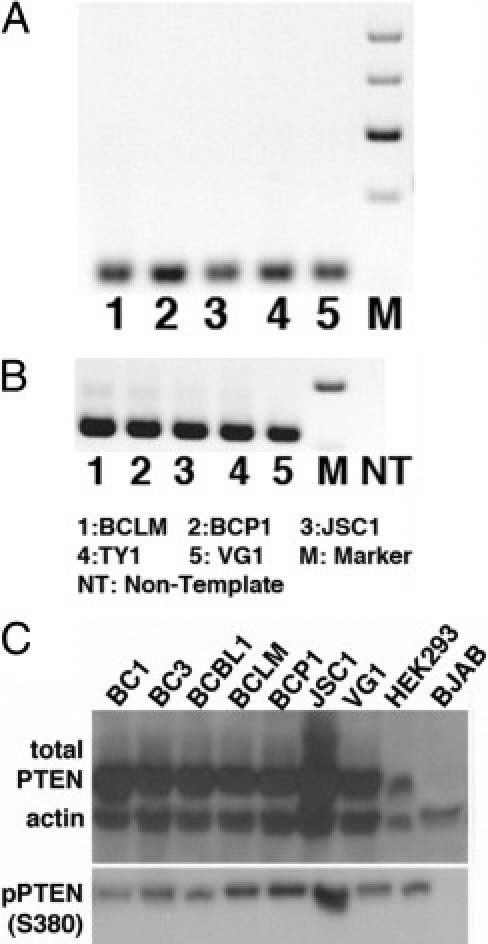
PTEN is phosphorylated at the serine 380 site in PEL. RT-PCR was performed to determine PTEN mRNA expression in PEL; representative gels are shown for PTEN (A) and GAPDH (B). NT, nontemplate control. C: Immunoblots were performed on protein isolated from whole-cell lysate; representative immunoblots are shown for total PTEN and phospho-PTEN (S380). β-actin was used as loading control. Equivalent amounts of protein were loaded in each case, except for HEK293, which served to indicate the molecular weight of PTEN.
Next, we used Western blot analysis to detect total PTEN and PTEN phosphorylated at serine 380. This modification renders the protein inactive and unable to dephosphorylate PIP3 to PIP2.23,57,58 PTEN protein was detectable at the appropriate molecular weight (∼54kDa) in every PEL cell line tested at similar levels to those observed in HEK293-positive control cells. PTEN was present in a majority of the cell lines (Figure 2C). In addition to total PTEN, phospho-PTEN (S380) was also detected in all PEL cell lines (Figure 2C). As negative control, we used PTEN-null BJAB cells,29 which have previously been shown to be sensitive to rapamycin.59 As expected, protein extracts from these cells did not show a band for either PTEN or phospho-PTEN (S380). We were able to verify actin expression in BJAB and all PEL cell lines.
Additionally, phosphorylation of PTEN at serine 380 results in nuclear localization of PTEN, where it is involved in mediating cell cycle arrest.58,60–62 Using immunofluorescence analysis, we determined that, independent of its phosphorylation status, PTEN was found in both the nucleus and the cytoplasm (see Supplemental Figure S1 at http://ajp.amjpathol.org). We used KSHV-LANA staining as a positive nuclear control.63 LANA was distributed in the characteristic nuclear speckles. There was no colocalization between PTEN and LANA, irrespective of PTEN phosphorylation status. After examining the gene locus, gene sequence, mRNA levels, and protein levels, we concluded that PTEN protein expression is intact in PEL; however, PTEN was heavily phosphorylated at serine 380, which represents an inactivating modification.
Phospho-PTEN Is Readily Detectable in PEL Xenograft Tumors
To test the hypothesis that the phosphorylation status of PTEN is maintained in a more demanding tumor microenvironment, compared with the nutrient-rich culture conditions, we analyzed expression of phospho-PTEN in previously established PEL tumor grafts.39,55,64 We stained sections of PEL xenograft tumors for total PTEN (Figure 3, A and E) and phospho-PTEN (S380) (Figure 3, C and G). Both total PTEN and phospho-PTEN (S380) were expressed in a majority of tumor cells. The staining pattern of total PTEN matched that of phospho-PTEN (S380): both were present in the nucleus and cytoplasm. We found no evidence of heterogeneity. The sections were also stained for LANA, to determine presence of KSHV (Figure 3, D and H). Because LANA was exclusively localized to the nucleus, it served as an additional control, showing that the cytoplasmic signal we observed with total PTEN and phospho-PTEN (S380) using two independent PTEN antibodies was specific. Analogous to our observation in culture, and irrespective of phosphorylation status, there was no colocalization between PTEN and LANA and the staining patterns were distinct. The no-primary-antibody controls confirmed the absence of staining in the absence of primary antibody (Figure 3, B and F). These findings demonstrate that the high phosphorylation status of PTEN is not a result of optimal (10% serum) growth conditions in culture, but is maintained even in a more stringent tumor xenograft microenvironment.
Figure 3.
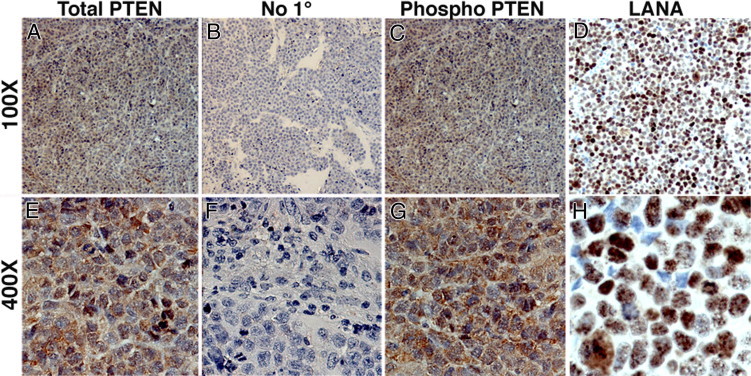
Immunohistochemical analysis of PEL xenograft tumors shows similar localization of total PTEN and phospho-PTEN. BC-1 xenograft tumor sections were stained for total PTEN (A and E), phospho-PTEN (S380) (C and G), and LANA (D and H) (red; NovaRed substrate). Sections were counterstained using hematoxylin (blue), which identifies the nucleus. Sections shown were incubated with dilution buffer either with primary antibody at 1:100 dilution (A, C, D, E and H) or without primary antibody (B and F). No red staining was observed in the no-primary-antibody control (B and D). Original magnification: ×100 (A–D); ×400 (E–H).
Expression of PTEN Reduces Colony Formation in PEL
Our research group and others have previously shown that Akt is hyperphosphorylated in PEL cells in culture and in xenografts.35,65 To test the hypothesis that inactive PTEN contributes to hyperactivation of Akt and PEL growth, we ectopically expressed human PTEN in PEL and evaluated its effect on cell growth using the classic soft agar assay.66,67 If PEL evolved downstream mutations (eg, activating mutations in Akt) to be resistant to the activity of PTEN, we would expect continued growth. Instead, PTEN reduced colony formation, as determined independently in three distinct PEL cell lines (BC1, BCBL1, BCP1) that differ in p53 status.68 Fewer to no colonies were formed by PTEN-overexpressing BCP1 cells (Figure 4B), compared with vector-only control (Figure 4A). Given that a 1/10th amount of EGFP-Max plasmid (Lonza) was nucleofected in tandem with vector and hPTEN plasmids, we used GFP expression to demonstrate equivalent efficiency of nucleofection (Figure 4, C and D). PTEN protein expression from our PTEN-expressing plasmid on nucleofection, was verified by Western blot using BJAB cells that lack endogenous PTEN (Figure 4E). PTEN protein was expressed at the appropriate molecular weight after nucleofection of PTEN, but not vector control. HEK293 cells served as positive control, showing a band of the expected molecular weight. Inhibition of colony formation in three PEL cell lines was significant, with P ≤ 0.005 for BC1 and BCP1 and P ≤ 0.05 for BCBL1 (Figure 4F). This functional assay suggests that signaling components downstream of PTEN still respond to PTEN.
Figure 4.
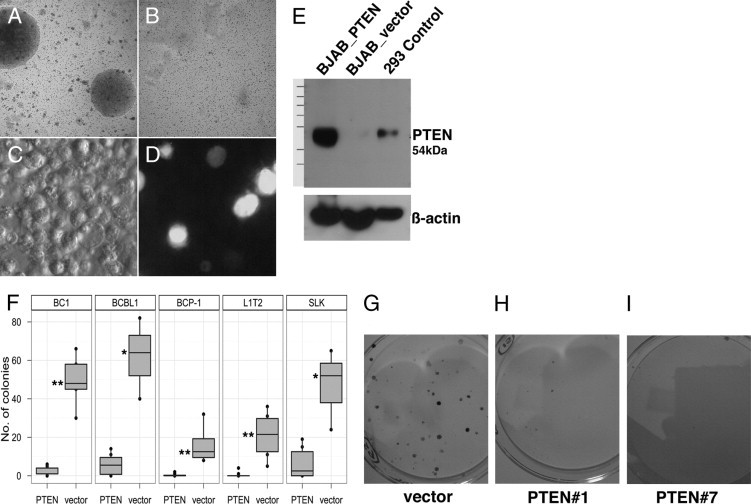
Growth suppression of BCP-1 and SLK cells upon overexpression of PTEN. BCP1 cells colonies formed in soft agar after vector-only nucleofection (A), but no colonies formed on nucleofection of human PTEN clone 1 (pDD1540) (B). GFP positive control for nucleofection is shown in bright light (C) and fluorescence (D) fields. E: Expression of protein in PTEN-null BJAB cells on expression of the hPTEN only and not the vector control. F: Quantification of colonies observed in the PEL cell lines BC1, BCBL1, and BCP1 (P = 0.003, 0.02, and 0.005, respectively) and in the KS-like cell lines L1T2 and SLK (P = 0.003 and 0.03, respectively). *P ≤ 0.05; **P ≤ 0.005. G–I: Representative images of colonies upon overexpression of hPTEN, clones 1 (H) and 7 (I) compared with vector only (G) in SLK cells.
PTEN Is Expressed in Primary KS Tumor Biopsies and Reduces Colony Formation in KS Tumor Models
In addition to PEL, KSHV is also the causative agent of KS, a tumor of endothelial cell lineage. We hypothesized that this cancer too, would inactivate PTEN by phosphorylation. Unlike PEL, for which multiple cell lines are available, only a few KS-derived tumor cell lines are available: SLK,69 KS-IMM,70 and KS Y-1,71 as well as fully tumorigenic human endothelial cell lines that carry KSHV episome.72 We used the SLK cell line and the newly established L1T2 cell line, explanted from L1-TIVE xenograft tumor (unpublished data), to test the effect of introducing PTEN on tumor cell growth. We tested colony formation of SLK cells on transfection with vector alone expressing the blasticidin selection marker or two independent clones expressing either human PTEN or the blasticidin selection marker. After 2 weeks in selective medium, the number of colonies was reduced in cells transfected with PTEN, but not with vector alone (Figure 4, G–I). We observed a statistically significant reduction in the number of colonies formed (Figure 4F), with P ≤ 0.05 for SLK and P ≤ 0.005 for L1T2.
To verify these experimental results in biopsies from patients with KS and to investigate PTEN phosphorylation, we used KS-TMAs. The main advantages of a tissue microarray are that all cores are exposed to the same exact conditions of antibody staining and that the cores represent adjacent sections. This facilitates a direct comparison of protein expression. In our first array, we detected total PTEN in 141/176 (80%) cases and intense phospho-PTEN (S380) in 75/130 (58%) cases (Figure 5, A and B). Often the same core also stained positive for phospho-Akt (T308) (Figure 4C); that is, many KS tumors exhibited activated Akt despite robust PTEN expression. Phospho-Akt (T308) requires PI3K activation and PTEN inactivation. No staining was observed in the no-primary-antibody control of the same core or control tissue (Figure 5D). The control tissue was from an unaffected area of the lung of an HIV+ KS patient. It appears nontypical, in that the tissue may have partially collapsed and shows alterations in response to episodes of non-neoplastic disease in AIDS patients, such as past or ongoing pneumocystis pneumonia. The correspondence between phospho-PTEN (S380) and phospho-Akt (T308) was not observed in normal tissue. We detected total PTEN in a normal control lung sample (Figure 5A). Nonetheless, the same core did not stain for phospho-PTEN (S380) (Figure 5B) or for phospho-Akt (T308) (Figure 5C). This could be expected for normal cells, in which high levels of hypophosphorylated PTEN counteract the phosphorylation of Akt. In a representative skin KS lesion, total PTEN, phospho-PTEN (S380), and phospho-Akt (T308) were detected in the same biopsy (Figure 5, A–C). These data support our hypothesis that, in the majority of KS tumors, the tumor suppressor PTEN is not deleted but instead is post-translationally inactivated to allow phosphorylation of Akt.
Figure 5.
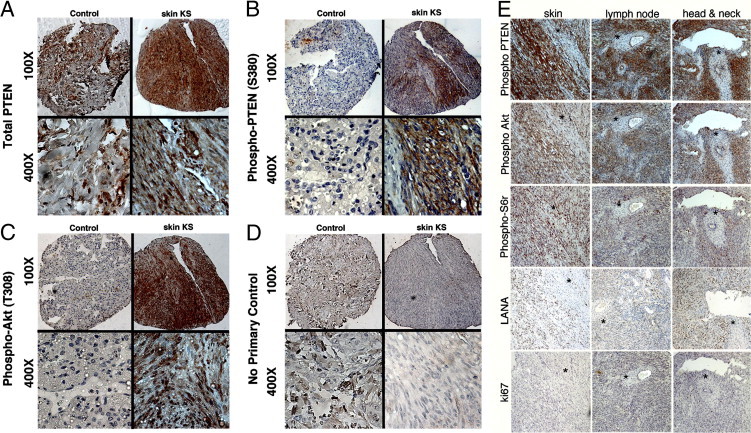
Expression of PI3K activation markers and phospho-PTEN (S380) in KS primary biopsies. Immunohistochemistry showed the presence of total PTEN (A), phospho-PTEN (S380) (B), phospho-Akt (T308), a PI3K-dependent site (C), and no-primary-antibody negative control (D). Original magnification: ×100 (upper row); ×400 (lower row). In each panel (A–D), images at the left are of control lung tissue, which stains positive only for PTEN but not for phospho-PTEN (S380) or phospho-Akt (T308); images at the right are of a representative skin biopsy, in which the same tissue section is positive for total PTEN, phospho-PTEN (S380), and phospho-Akt (T308). E: Staining of a second TMA incorporating AIDS-KS from tissues of three different origins for phospho-PTEN (S380), PI3K activation markers phospho-Akt (T308) and phospho-S6r (S235/236), KSHV marker LANA, and proliferation marker Ki67. Sections were selected such that a region of the biopsy was negative (asterisks), in an otherwise positive section, serving as an internal control. Original magnification, ×100.
We used a newer, second independent AIDS-KS TMA to statistically verify the correlation of phospho-PTEN (S380) with activated Akt (Figure 5E). For each core, the KS diagnosis and tissue of origin was reverified (images of H&E stains for each core are available on request). Altogether, we analyzed 130 cores of AIDS-KS and normal controls. Of these, 29 were from lymph node KS, 40 from oral KS (including tonsillar and adenoid), and 71 from skin KS lesions. This TMA was stained with antibodies to phospho-PTEN (S380), phospho-Akt (T308), phospho-S6 ribosomal (S6r) protein (S235/236), LANA, and the proliferation marker Ki67. Sections from three different sites (skin, lymph node, and head and neck) were stained for phospho-PTEN (S380), phospho-Akt (T308) phospho-S6r (S235/236), KSHV marker LANA and Ki67; all sections were counterstained with hematoxylin (Figure 5E). The sections were selected to include regions of no tumor and no staining within an otherwise positive biopsy, thus providing an internal negative control.
To support our visual impressions, we conducted a quantitative analysis (Figure 6). Images were recorded from each core, and staining intensity was quantified as described under Materials and Methods. Linear regression analysis was performed to determine the correlation between phospho-PTEN and markers of PI3K-mTOR activation (phospho-Akt (T308) and phospho-S6r (S235/236)), KSHV-infection (LANA), and active proliferation (Ki67). Each of the plots in Figure 6 represents the relative staining intensity for different markers on the y axis (phospho-Akt, phospho-S6r, LANA and Ki67) against phospho-PTEN (S380) on the x axis. We found a strong linear correlation between phospho-PTEN (S380) and both phospho-Akt (T308) and phospho-S6r (S235/236). This indicates that the PI3K-mTOR signaling pathway is activated in KS and that PTEN is phosphorylated at S380 and thus is inactive in KS (P ≤ 10−14), across all three sites (Figure 6, A and B). By contrast, we found no significant correlation between phospho-PTEN (S380) and LANA or Ki67 (Figure 6, C and D). There were no significant differences in staining patterns across the different tumor sites. Regardless of tumor site, KS presented with characteristic spindle cell morphology and a similar pattern of PI3K-Akt-mTOR pathway member status. This suggests that in KS, as in PEL, post-translational inactivation of PTEN contributes to the activation of the PI3K-Akt-mTOR pathway.
Figure 6.
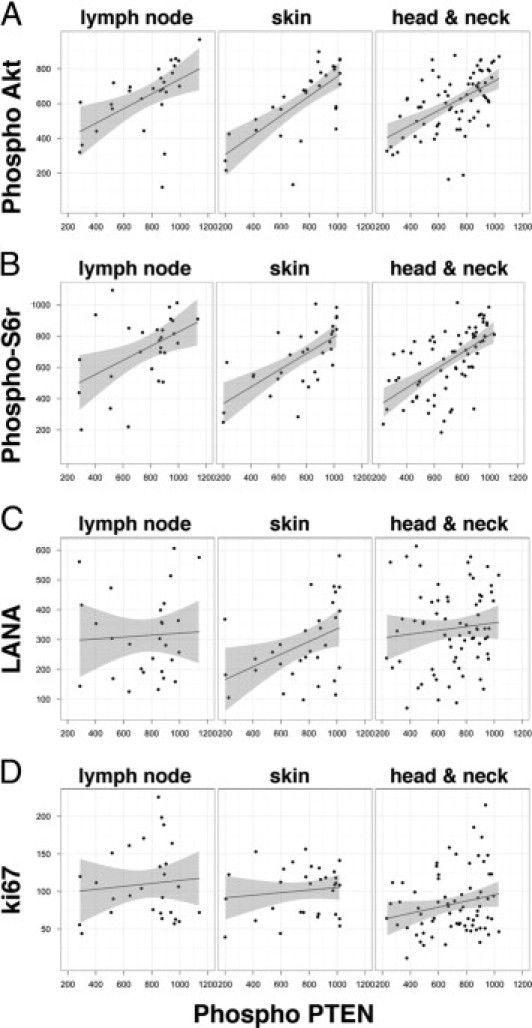
Significant correlation of phospho-Akt (T308) and phospho-S6 ribosomal protein (S235/236) with phospho-PTEN (S380) in KS. The square root of the intensity count for phospho-Akt (A), phospho-S6r (B), LANA (C), and Ki67 (D), is plotted on the vertical axis and that for phospho-PTEN is plotted on the horizontal axis for KS sections from three body sites: lymph node, oral, and skin. The solid line indicates the linear regression; the shaded region indicates the 95% confidence interval of the fit. There was a significant correlation of both phospho-Akt (T308) and phospho-S6r (S235/236) with phospho-PTEN (S380), with P values of 3.09 × 10⁻¹³ and 2.6 × 10⁻¹³ respectively. There was no significant correlation between LANA positivity (denoting viral infection) and Ki67 (denoting active proliferation) (P > 0.05).
Discussion
Activation of the PI3K-Akt-mTOR signaling cascade is a defining phenotype of the KSHV-associated cancers PEL and KS. KS has been reported to respond to rapamycin,7 and PEL also appears to respond to rapamycin (D. Henry and D.P. Dittmer, unpublished data); however, exceptions have also been noted.12–16 Other virus-associated lymphoproliferative diseases such as EBV-associated post-transplant lymphoproliferative disease also rely on activation of the PI3K-Akt-mTORC1 pathway73,74 and respond to mTOR inhibitors in culture and in the clinic.75–77 In EBV-associated tumors, however, similar to the KSHV setting, exception from an overall favorable response has been reported.78 Thus, there is urgent need to understand the mechanism of rapamycin, and discover potential biomarkers of response. To activate this pathway, either a positive regulator has to be hyperactivated, or a negative regulator has to be inactivated, or both. To date, most studies in PEL and KS have concentrated on positive regulators of the PI3K-Akt-mTOR pathway. In the present study, we investigated the principal negative regulator of PI3K-Akt-mTOR signaling, the tumor suppressor PTEN.
PTEN antagonizes PI3K in the first step in the PI3K-Akt-mTOR cascade by dephosphorylating PIP3 to PIP2 and thus constitutes a major step of regulation. Diminished PTEN activity in human cancer results in hyperactivation of the PI3K signaling pathway, a condition that has also been termed oncogene addiction to PI3K-mTOR. In nonviral tumors, PTEN is typically inactivated by deletion or mutation. The PTEN gene is deleted in many solid tumors34 and in ∼40% of cell lines derived from prostate, endometrial, and nervous system cancers (Cancer Genome Project, Wellcome Trust Sanger Institute; http://www.sanger.ac.uk/perl/genetics/CGP/core_line_viewer?action=bygene&ln=PTEN&start=1&end=404&coords=AA:AA. Accessed August 11, 2011). In the context of hematological malignancies, it was reported that the majority of primary acute leukemias and non-Hodgkin's lymphomas, both primary and cell lines, show abnormalities in PTEN gene and protein expression.79
The situation is different for PEL, which is a viral lymphoma. We conclude that genetic aberrations of PTEN are infrequent in PEL and our data show that KSHV-associated PELs invariably express high levels of PTEN protein (Figures 1 and 2) and at the same time exhibit high levels of phosphorylated Akt.35 We observed the same pattern in KS biopsies (Figure 5 and 6). We found no evidence of point mutations in PEL cell lines, and no evidence of mislocalization. Rather, PTEN appeared to be hyperphosphorylated in PEL and KS. Furthermore, we showed that ectopic expression of PTEN in PEL or KS-tumor derived cell lines inhibited colony formation (Figure 4). This suggests that downstream effectors of the PI3K-Akt-mTOR pathway cannot override the growth-inhibitory signal of PTEN in PEL and KS. This phenotype is in contrast to the behavior of cells carrying activating mutations in downstream players such as Akt.80,81
Boulanger et al82 reported similarly on the absence of PTEN mutations in archived biopsies from PEL patients, although they found mutations in some of their PEL cell lines. For instance, they reported a homozygous deletion of PTEN exons 6 to 9 in the BCP-1 cell line, whereas we detect PTEN protein in this cell line. Uddin et al65 also detected PTEN protein in the BCP-1 cell line. This suggests that perhaps the subline used by Boulanger et al82 had changed as a result of prolonged passage in culture. Such discrepancies are not unexpected, given that PEL cell lines change on passage in culture (Roy and Dittmer, unpublished data). Of note, BCP-1 is unique among PELs, because it carries homozygous mutant p53 and would thus be expected to be less genetically stable than other PEL cell lines, all of which carry wild-type p53.83
At present, we do not know which kinase phosphorylates PTEN in PEL. KSHV proteins may mediate the phosphorylation of PTEN. Alternatively, casein kinase 2 (CK2), glycogen synthase kinase 3β (GSK3β), LKB1, and rhoA-associated kinase (ROCK) have all been implicated in PTEN phosphorylation.33,84 The KSHV LANA protein can bind and sequester GSK3β in the nucleus,85 which would eliminate GSK3β from mediating PTEN phosphorylation in PEL. Further studies are needed to elucidate the players in phosphorylation of PTEN in KSHV-associated malignancies.
What is the significance of our findings? Viral cancers express viral oncogenes. Viral lymphomas in particular express viral oncoproteins that involve the PI3K-Akt-mTOR pathway. Several KSHV proteins, such as K1 and vGPCR, can activate PI3K.36–38 This would lessen the selective pressure to mutate and genetically inactivate PTEN. EBV, a human herpesvirus closely related to KSHV, is capable of silencing PTEN protein expression by CpG island and promoter methylation in gastric cancers,86,87 but no such observations have been reported for EBV-associated lymphomas. It appears that KSHV silences PTEN protein function by inducing constitutive phosphorylation, which, like deletion, relieves the negative regulation of PTEN on the PI3K-mTOR signaling pathway. Phosphorylation of PTEN contributes to PI3K-Akt-mTOR activation in KSHV-infected cells and can thus be speculated to contribute to the proliferative advantage of PEL and KS tumor cells. In addition, we found two reports of nonviral lymphomas in which PTEN was also inactivated post-translationally: cases of mantle cell lymphoma (MCL) and some cases of T-cell acute lymphoblastic leukemia (T-ALL) show hyperactivation of PI3K in the context of wild-type PTEN.88,89 What seems to be the default route for viral lymphomas (ie, post-translational or epigenetic inactivation of PTEN) is also seen in the evolution of nonviral cancers. It is intriguing that of all non-Hodgkin's lymphomas, only mantle cell lymphoma responds clinically to mTOR inhibitors.90 We speculate that phospho-PTEN (S380) expression may serve (assuming confirmation in a clinical trial) as a novel biomarker for rapamycin sensitivity of human cancers.
A key finding of the present study is that expression of wild-type PTEN in PEL inhibited growth in semisolid medium.4 This implies that adding back PTEN can revert virus- and/or cell-induced Akt activation.80,81 This result fuels the speculation that PTEN activation by small molecules may present a novel treatment modality for wild-type PTEN tumors, similar to the rationale for p53 activation by Nutlin-368,91 as a possible treatment modality for post-translationally inactivated but genetically wild-type p53 cancers.
Acknowledgments
We thank Sang-Hoon Sin for providing p53 sequence data for BC2, BC5, and TY1 cell lines and Jessica L. Poisson for evaluating the TMA cores for tissue of origin. The initial KS array was constructed by Barbara Hackman with the help of Leona Ayers (pathologist) at the Ohio State University AIDS Cancer Specimen Resource (ACSR) site. The second KS-TMA was constructed by Alanna Morris with the help of Nancy Ciau (pathologist) at the University of California at San Francisco ACSR site under the direction of Michael S. McGrath. We thank Blossom Damania and members of her laboratory for helpful discussion and critical reading. We apologize to our colleagues whose work we could not cite because of space limitations.
Footnotes
Supported by NIH grants DE018304 and CA163217 (D.P.D.). TMA construction was funded by NIH grant NCI CA066529.
Supplemental material for this article can be found at http://ajp.amjpathol.org or at doi: 10.1016/j.ajpath.2011.06.017.
Supplementary data
Immunofluorescence analysis showing the distribution of total PTEN and phospho-PTEN (S380) in PEL cells. Green punctate staining marks either total PTEN (A) or phospho-PTEN (S380) (B). Independent of its phosphorylation status, PTEN localizes to both the cytoplasm and nucleus of the cells. LANA staining (red) was exclusively localized to the nucleus, as expected, and therefore was used both as a control for nuclear staining and to denote the presence of viral episome in the PEL cells. Merge of total PTEN or phospho-PTEN (S380) illustrates the lack of colocalization of PTEN with LANA, independent of PTEN phosphorylation. DAPI (blue) nuclear counterstain added to the merge of LANA and PTEN confirms LANA localization to the nucleus. Immunofluorescence analysis was performed in three PEL cell lines, BC1, BCBL1, and BCP1, that were generated independently and show different KSHV and EBV infection, as well as distinct p53 status (as shown in Table 1). All images were processed through deconvolution software, as described under Materials and Methods. Original magnification, ×630. Scale bars, 10 µm.
References
- 1.Cesarman E., Chang Y., Moore P.S., Said J.W., Knowles D.M. Kaposi's sarcoma-associated herpesvirus-like DNA sequences in AIDS-related body-cavity-based lymphomas. N Engl J Med. 1995;332:1186–1191. doi: 10.1056/NEJM199505043321802. [DOI] [PubMed] [Google Scholar]
- 2.Matsushima A.Y., Strauchen J.A., Lee G., Scigliano E., Hale E.E., Weisse M.T., Burstein D., Kamel O., Moore P.S., Chang Y. Posttransplantation plasmacytic proliferations related to Kaposi's sarcoma-associated herpesvirus. Am J Surg Pathol. 1999;23:1393–1400. doi: 10.1097/00000478-199911000-00010. [DOI] [PubMed] [Google Scholar]
- 3.Dotti G., Fiocchi R., Motta T., Facchinetti B., Chiodini B., Borleri G.M., Gavazzeni G., Barbui T., Rambaldi A. Primary effusion lymphoma after heart transplantation: a new entity associated with human herpesvirus-8. Leukemia. 1999;13:664–670. doi: 10.1038/sj.leu.2401390. [DOI] [PubMed] [Google Scholar]
- 4.Nador R.G., Cesarman E., Chadburn A., Dawson D.B., Ansari M.Q., Sald J., Knowles D.M. Primary effusion lymphoma: a distinct clinicopathologic entity associated with the Kaposi's sarcoma-associated herpes virus. Blood. 1996;88:645–656. [PubMed] [Google Scholar]
- 5.Horenstein M.G., Nador R.G., Chadburn A., Hyjek E.M., Inghirami G., Knowles D.M., Cesarman E. Epstein-Barr virus latent gene expression in primary effusion lymphomas containing Kaposi's sarcoma-associated herpesvirus/human herpesvirus-8. Blood. 1997;90:1186–1191. [PubMed] [Google Scholar]
- 6.Chang Y., Cesarman E., Pessin M.S., Lee F., Culpepper J., Knowles D.M., Moore P.S. Identification of herpesvirus-like DNA sequences in AIDS-associated Kaposi's sarcoma. Science. 1994;266:1865–1869. doi: 10.1126/science.7997879. [DOI] [PubMed] [Google Scholar]
- 7.Stallone G., Schena A., Infante B., Di Paolo S., Loverre A., Maggio G., Ranieri E., Gesualdo L., Schena F.P., Grandaliano G. Sirolimus for Kaposi's sarcoma in renal-transplant recipients. N Engl J Med. 2005;352:1317–1323. doi: 10.1056/NEJMoa042831. [DOI] [PubMed] [Google Scholar]
- 8.Guenova E., Metzler G., Hoetzenecker W., Berneburg M., Rocken M. Classic Mediterranean Kaposi's sarcoma regression with sirolimus treatment. Arch Dermatol. 2008;144:692–693. doi: 10.1001/archderm.144.5.692. [DOI] [PubMed] [Google Scholar]
- 9.Yaich S., Zagdane S., Charfeddine K., Hssairi D., Hachicha J. Simultaneous Hodgkin's disease and Kaposi sarcoma in a renal transplant recipient. Saudi J Kidney Dis Transpl. 2010;21:306–309. [PubMed] [Google Scholar]
- 10.Ho C.M., Huang S.F., Hu R.H., Ho M.C., Wu Y.M., Lee P.H. Sirolimus-induced signaling modifications in Kaposi's sarcoma with resolution in a liver transplant recipient. Clin Transplant. 2010;24:127–132. doi: 10.1111/j.1399-0012.2009.01132.x. [DOI] [PubMed] [Google Scholar]
- 11.Yuksekkaya H.A., Arikan C., Yazici A., Baran M., Aydogdu S., Kilic M. Successful treatment of a child having generalized Kaposi's sarcoma after living donor liver transplantation with conversion to sirolimus. Pediatr Transplant. 2009;13:375–378. doi: 10.1111/j.1399-3046.2008.00944.x. [DOI] [PubMed] [Google Scholar]
- 12.Boratyńska M., Zmonarski S.C., Klinger M. Reccurence of Kaposi's sarcoma after increased exposure to sirolimus. Int Immunopharmacol. 2006;6:2018–2022. doi: 10.1016/j.intimp.2006.09.018. [DOI] [PubMed] [Google Scholar]
- 13.Merimsky O., Jiveliouk I., Sagi-Eisenberg R. Targeting mTOR in HIV-negative classic Kaposi's sarcoma. Sarcoma. 2008;2008:825093. doi: 10.1155/2008/825093. [DOI] [PMC free article] [PubMed] [Google Scholar]
- 14.Babel N., Eibl N., Ulrich C., Bold G., Sefrin A., Hammer M.H., Rosenberger C., Reinke P. Development of Kaposi's sarcoma under sirolimus-based immunosuppression and successful treatment with imiquimod. Transpl Infect Dis. 2008;10:59–62. doi: 10.1111/j.1399-3062.2007.00239.x. [DOI] [PubMed] [Google Scholar]
- 15.Boulanger E., Afonso P.V., Yahiaoui Y., Adle-Biassette H., Gabarre J., Agbalika F. Human herpesvirus-8 (HHV-8)-associated primary effusion lymphoma in two renal transplant recipients receiving rapamycin. Am J Transplant. 2008;8:707–710. doi: 10.1111/j.1600-6143.2007.02110.x. [DOI] [PubMed] [Google Scholar]
- 16.Descoeudres B., Giannini O., Graf T., Steiger J., Mayr M. No effect of sirolimus for Kaposi sarcoma in a renal transplant recipient. Transplantation. 2006;81:1472–1474. doi: 10.1097/01.tp.0000203322.99037.d2. [DOI] [PubMed] [Google Scholar]
- 17.Barozzi P., Riva G., Vallerini D., Bosco R., Quadrelli C., Zanetti E., Potenza L., Forghieri F., Torelli G., Luppi M. Indirect antitumor effects of mammalian target of rapamycin inhibitors against Kaposi sarcoma in transplant patients. Transplantation. 2009;88:597–598. doi: 10.1097/TP.0b013e3181b15d56. [DOI] [PubMed] [Google Scholar]
- 18.Kahan B.D. Sirolimus: a comprehensive review. Expert Opin Pharmacother. 2001;2:1903–1917. doi: 10.1517/14656566.2.11.1903. [DOI] [PubMed] [Google Scholar]
- 19.Cully M., You H., Levine A.J., Mak T.W. Beyond PTEN mutations: the PI3K pathway as an integrator of multiple inputs during tumorigenesis. Nat Rev Cancer. 2006;6:184–192. doi: 10.1038/nrc1819. [DOI] [PubMed] [Google Scholar]
- 20.Hay N. The Akt-mTOR tango and its relevance to cancer. Cancer Cell. 2005;8:179–183. doi: 10.1016/j.ccr.2005.08.008. [DOI] [PubMed] [Google Scholar]
- 21.Sabatini D.M. mTOR and cancer: insights into a complex relationship. Nat Rev Cancer. 2006;6:729–734. doi: 10.1038/nrc1974. [DOI] [PubMed] [Google Scholar]
- 22.Stambolic V., Suzuki A., de la Pompa J.L., Brothers G.M., Mirtsos C., Sasaki T., Ruland J., Penninger J.M., Siderovski D.P., Mak T.W. Negative regulation of PKB/Akt-dependent cell survival by the tumor suppressor PTEN. Cell. 1998;95:29–39. doi: 10.1016/s0092-8674(00)81780-8. [DOI] [PubMed] [Google Scholar]
- 23.Vivanco I., Sawyers C.L. The phosphatidylinositol 3-kinase AKT pathway in human cancer. Nat Rev Cancer. 2002;2:489–501. doi: 10.1038/nrc839. [DOI] [PubMed] [Google Scholar]
- 24.Carrasco D.R., Fenton T., Sukhdeo K., Protopopova M., Enos M., You M.J., Di Vizio D., Nogueira C., Stommel J., Pinkus G.S., Fletcher C., Hornick J.L., Cavenee W.K., Furnari F.B., Depinho R.A. The PTEN and INK4A/ARF tumor suppressors maintain myelolymphoid homeostasis and cooperate to constrain histiocytic sarcoma development in humans. Cancer Cell. 2006;9:379–390. doi: 10.1016/j.ccr.2006.03.028. [DOI] [PubMed] [Google Scholar]
- 25.Cloughesy T.F., Yoshimoto K., Nghiemphu P., Brown K., Dang J., Zhu S., Hsueh T., Chen Y., Wang W., Youngkin D., Liau L., Martin N., Becker D., Bergsneider M., Lai A., Green R., Oglesby T., Koleto M., Trent J., Horvath S., Mischel P.S., Mellinghoff I.K., Sawyers C.L. Antitumor activity of rapamycin in a phase I trial for patients with recurrent PTEN-deficient glioblastoma. PLoS Med. 2008;5:e8. doi: 10.1371/journal.pmed.0050008. [DOI] [PMC free article] [PubMed] [Google Scholar]
- 26.Hyun T., Yam A., Pece S., Xie X., Zhang J., Miki T., Gutkind J.S., Li W. Loss of PTEN expression leading to high Akt activation in human multiple myelomas. Blood. 2000;96:3560–3568. [PubMed] [Google Scholar]
- 27.Li J., Yen C., Liaw D., Podsypanina K., Bose S., Wang S.I., Puc J., Miliaresis C., Rodgers L., McCombie R., Bigner S.H., Giovanella B.C., Ittmann M., Tycko B., Hibshoosh H., Wigler M.H., Parsons R. PTEN, a putative protein tyrosine phosphatase gene mutated in human brain, breast, and prostate cancer. Science. 1997;275:1943–1947. doi: 10.1126/science.275.5308.1943. [DOI] [PubMed] [Google Scholar]
- 28.Neshat M.S., Mellinghoff I.K., Tran C., Stiles B., Thomas G., Petersen R., Frost P., Gibbons J.J., Wu H., Sawyers C.L. Enhanced sensitivity of PTEN-deficient tumors to inhibition of FRAP/mTOR. Proc Natl Acad Sci USA. 2001;98:10314–10319. doi: 10.1073/pnas.171076798. [DOI] [PMC free article] [PubMed] [Google Scholar]
- 29.Sarbassov D.D., Ali S.M., Sengupta S., Sheen J.H., Hsu P.P., Bagley A.F., Markhard A.L., Sabatini D.M. Prolonged rapamycin treatment inhibits mTORC2 assembly and Akt/PKB. Mol Cell. 2006;22:159–168. doi: 10.1016/j.molcel.2006.03.029. [DOI] [PubMed] [Google Scholar]
- 30.Steelman L.S., Navolanic P.M., Sokolosky M.L., Taylor J.R., Lehmann B.D., Chappell W.H., Abrams S.L., Wong E.W., Stadelman K.M., Terrian D.M., Leslie N.R., Martelli A.M., Stivala F., Libra M., Franklin R.A., McCubrey J.A. Suppression of PTEN function increases breast cancer chemotherapeutic drug resistance while conferring sensitivity to mTOR inhibitors. Oncogene. 2008;27:4086–4095. doi: 10.1038/onc.2008.49. [DOI] [PMC free article] [PubMed] [Google Scholar]
- 31.Chang C.J., Mulholland D.J., Valamehr B., Mosessian S., Sellers W.R., Wu H. PTEN nuclear localization is regulated by oxidative stress and mediates p53-dependent tumor suppression. Mol Cell Biol. 2008;28:3281–3289. doi: 10.1128/MCB.00310-08. [DOI] [PMC free article] [PubMed] [Google Scholar]
- 32.Liu J.L., Mao Z., LaFortune T.A., Alonso M.M., Gallick G.E., Fueyo J., Yung W.K. Cell cycle-dependent nuclear export of phosphatase and tensin homologue tumor suppressor is regulated by the phosphoinositide-3-kinase signaling cascade. Cancer Res. 2007;67:11054–11063. doi: 10.1158/0008-5472.CAN-07-1263. [DOI] [PubMed] [Google Scholar]
- 33.Gericke A., Munson M., Ross A.H. Regulation of the PTEN phosphatase. Gene. 2006;374:1–9. doi: 10.1016/j.gene.2006.02.024. [DOI] [PubMed] [Google Scholar]
- 34.Wendel H.G., Malina A., Zhao Z., Zender L., Kogan S.C., Cordon-Cardo C., Pelletier J., Lowe S.W. Determinants of sensitivity and resistance to rapamycin-chemotherapy drug combinations in vivo. Cancer Res. 2006;66:7639–7646. doi: 10.1158/0008-5472.CAN-06-0419. [DOI] [PMC free article] [PubMed] [Google Scholar]
- 35.Sin S.H., Roy D., Wang L., Staudt M.R., Fakhari F.D., Patel D.D., Henry D., Harrington W.J., Jr, Damania B.A., Dittmer D.P. Rapamycin is efficacious against primary effusion lymphoma (PEL) cell lines in vivo by inhibiting autocrine signaling. Blood. 2007;109:2165–2173. doi: 10.1182/blood-2006-06-028092. [DOI] [PMC free article] [PubMed] [Google Scholar]
- 36.Damania B. Modulation of cell signaling pathways by Kaposi's sarcoma-associated herpesvirus (KSHV/HHV-8) Cell Biochem Biophys. 2004;40:305–322. doi: 10.1385/CBB:40:3:305. [DOI] [PubMed] [Google Scholar]
- 37.Montaner S. Akt/TSC/mTOR activation by the KSHV G protein-coupled receptor: emerging insights into the molecular oncogenesis and treatment of Kaposi's sarcoma. Cell Cycle. 2007;6:438–443. doi: 10.4161/cc.6.4.3843. [DOI] [PubMed] [Google Scholar]
- 38.Tomlinson C.C., Damania B. The K1 protein of Kaposi's sarcoma-associated herpesvirus activates the Akt signaling pathway. J Virol. 2004;78:1918–1927. doi: 10.1128/JVI.78.4.1918-1927.2004. [DOI] [PMC free article] [PubMed] [Google Scholar]
- 39.Boshoff C., Gao S.J., Healy L.E., Matthews S., Thomas A.J., Coignet L., Warnke R.A., Strauchen J.A., Matutes E., Kamel O.W., Moore P.S., Weiss R.A., Chang Y. Establishing a KSHV+ cell line (BCP-1) from peripheral blood and characterizing its growth in Nod/SCID mice. Blood. 1998;91:1671–1679. [PubMed] [Google Scholar]
- 40.Cesarman E., Moore P.S., Rao P.H., Inghirami G., Knowles D.M., Chang Y. In vitro establishment and characterization of two acquired immunodeficiency syndrome-related lymphoma cell lines (BC-1 and BC-2) containing Kaposi's sarcoma-associated herpesvirus-like (KSHV) DNA sequences. Blood. 1995;86:2708–2714. [PubMed] [Google Scholar]
- 41.Arvanitakis L., Mesri E.A., Nador R.G., Said J.W., Asch A.S., Knowles D.M., Cesarman E. Establishment and characterization of a primary effusion (body cavity- based) lymphoma cell line (BC-3) harboring Kaposi's sarcoma-associated herpesvirus (KSHV/HHV-8) in the absence of Epstein-Barr virus. Blood. 1996;88:2648–2654. [PubMed] [Google Scholar]
- 42.Guasparri I., Keller S.A., Cesarman E. KSHV vFLIP is essential for the survival of infected lymphoma cells [Erratum appeared in J Exp Med 2006, 203:1383] J Exp Med. 2004;199:993–1003. doi: 10.1084/jem.20031467. [DOI] [PMC free article] [PubMed] [Google Scholar] [Retracted]
- 43.Komanduri K.V., Luce J.A., McGrath M.S., Herndier B.G., Ng V.L. The natural history and molecular heterogeneity of HIV-associated primary malignant lymphomatous effusions. J Acquir Immune Defic Syndr Hum Retrovirol. 1996;13:215–226. doi: 10.1097/00042560-199611010-00003. [DOI] [PubMed] [Google Scholar]
- 44.Ghosh S.K., Wood C., Boise L.H., Mian A.M., Deyev V.V., Feuer G., Toomey N.L., Shank N.C., Cabral L., Barber G.N., Harrington W.J., Jr Potentiation of TRAIL-induced apoptosis in primary effusion lymphoma through azidothymidine-mediated inhibition of NF-kappa B. Blood. 2003;101:2321–2327. doi: 10.1182/blood-2002-08-2525. [DOI] [PubMed] [Google Scholar]
- 45.Menezes J., Leibold W., Klein G., Clements G. Establishment and characterization of an Epstein-Barr virus (EBC)-negative lymphoblastoid B cell line (BJA-B) from an exceptional, EBV-genome-negative African Burkitt's lymphoma. Biomedicine. 1975;22:276–284. [PubMed] [Google Scholar]
- 46.Ben-Bassat H., Goldblum N., Mitrani S., Goldblum T., Yoffey J.M., Cohen M.M., Bentwich Z., Ramot B., Klein E., Klein G. Establishment in continuous culture of a new type of lymphocyte from a “Burkitt like” malignant lymphoma (line D.G.-75) Int J Cancer. 1977;19:27–33. doi: 10.1002/ijc.2910190105. [DOI] [PubMed] [Google Scholar]
- 47.Crook T., Parker G.A., Rozycka M., Crossland S., Allday M.J. A transforming p53 mutant, which binds DNA, transactivates and induces apoptosis reveals a nuclear: cytoplasmic shuttling defect. Oncogene. 1998;16:1429–1441. doi: 10.1038/sj.onc.1201699. [DOI] [PubMed] [Google Scholar]
- 48.Cannon J.S., Ciufo D., Hawkins A.L., Griffin C.A., Borowitz M.J., Hayward G.S., Ambinder R.F. A new primary effusion lymphoma-derived cell line yields a highly infectious Kaposi's sarcoma herpesvirus-containing supernatant. J Virol. 2000;74:10187–10193. doi: 10.1128/jvi.74.21.10187-10193.2000. [DOI] [PMC free article] [PubMed] [Google Scholar]
- 49.Katano H., Hoshino Y., Morishita Y., Nakamura T., Satoh H., Iwamoto A., Herndier B., Mori S. Establishing and characterizing a CD30-positive cell line harboring HHV-8 from a primary effusion lymphoma. J Med Virol. 1999;58:394–401. [PubMed] [Google Scholar]
- 50.Brander C., Suscovich T., Lee Y., Nguyen P.T., O'Connor P., Seebach J., Jones N.G., van Gorder M., Walker B.D., Scadden D.T. Impaired CTL recognition of cells latently infected with Kaposi's sarcoma-associated herpes virus. J Immunol. 2000;165:2077–2083. doi: 10.4049/jimmunol.165.4.2077. [DOI] [PubMed] [Google Scholar]
- 51.van Hattem W.A., Brosens L.A., de Leng W.W., Morsink F.H., Lens S., Carvalho R., Giardiello F.M., Offerhaus G.J. Large genomic deletions of SMAD4, BMPR1A and PTEN in juvenile polyposis. Gut. 2008;57:623–627. doi: 10.1136/gut.2007.142927. [DOI] [PubMed] [Google Scholar]
- 52.Zhou Y.H., Tan F., Hess K.R., Yung W.K. The expression of PAX6, PTEN, vascular endothelial growth factor, and epidermal growth factor receptor in gliomas: relationship to tumor grade and survival. Clin Cancer Res. 2003;9:3369–3375. [PubMed] [Google Scholar]
- 53.Chen W., Hilton I.B., Staudt M.R., Burd C.E., Dittmer D.P. Distinct p53, p53: LANA, and LANA complexes in Kaposi's sarcoma-associated herpesvirus lymphomas. J Virol. 2010;84:3898–3908. doi: 10.1128/JVI.01321-09. [DOI] [PMC free article] [PubMed] [Google Scholar]
- 54.Ayers L.W., Silver S., McGrath M.S., Orenstein J.M. The AIDS and Cancer Specimen Resource: role in HIV/AIDS scientific discovery. Infect Agent Cancer. 2007;2:7. doi: 10.1186/1750-9378-2-7. [DOI] [PMC free article] [PubMed] [Google Scholar]
- 55.Staudt M.R., Kanan Y., Jeong J.H., Papin J.F., Hines-Boykin R., Dittmer D.P. The tumor microenvironment controls primary effusion lymphoma growth in vivo. Cancer Res. 2004;64:4790–4799. doi: 10.1158/0008-5472.CAN-03-3835. [DOI] [PubMed] [Google Scholar]
- 56.Parsons R. Human cancer, PTEN and the PI-3 kinase pathway. Semin Cell Dev Biol. 2004;15:171–176. doi: 10.1016/j.semcdb.2003.12.021. [DOI] [PubMed] [Google Scholar]
- 57.Vazquez F., Ramaswamy S., Nakamura N., Sellers W.R. Phosphorylation of the PTEN tail regulates protein stability and function. Mol Cell Biol. 2000;20:5010–5018. doi: 10.1128/mcb.20.14.5010-5018.2000. [DOI] [PMC free article] [PubMed] [Google Scholar]
- 58.Carracedo A., Alimonti A., Pandolfi P.P. PTEN level in tumor suppression: how much is too little? Cancer Res. 2011;71:629–633. doi: 10.1158/0008-5472.CAN-10-2488. [DOI] [PMC free article] [PubMed] [Google Scholar]
- 59.Kay J.E., Smith M.C., Frost V., Morgan G.Y. Hypersensitivity to rapamycin of BJAB B lymphoblastoid cells. Immunology. 1996;87:390–395. [PMC free article] [PubMed] [Google Scholar]
- 60.Chung J.H., Eng C. Nuclear-cytoplasmic partitioning of phosphatase and tensin homologue deleted on chromosome 10 (PTEN) differentially regulates the cell cycle and apoptosis. Cancer Res. 2005;65:8096–8100. doi: 10.1158/0008-5472.CAN-05-1888. [DOI] [PubMed] [Google Scholar]
- 61.Liu J.L., Sheng X., Hortobagyi Z.K., Mao Z., Gallick G.E., Yung W.K. Nuclear PTEN-mediated growth suppression is independent of Akt down-regulation. Mol Cell Biol. 2005;25:6211–6224. doi: 10.1128/MCB.25.14.6211-6224.2005. [DOI] [PMC free article] [PubMed] [Google Scholar]
- 62.Planchon S.M., Waite K.A., Eng C. The nuclear affairs of PTEN. J Cell Sci. 2008;121:249–253. doi: 10.1242/jcs.022459. [DOI] [PubMed] [Google Scholar]
- 63.Kedes D.H., Lagunoff M., Renne R., Ganem D. Identification of the gene encoding the major latency-associated nuclear antigen of the Kaposi's sarcoma-associated herpesvirus. J Clin Invest. 1997;100:2606–2610. doi: 10.1172/JCI119804. [DOI] [PMC free article] [PubMed] [Google Scholar]
- 64.Picchio G.R., Sabbe R.E., Gulizia R.J., McGrath M., Herndier B.G., Mosier D.E. The KSHV/HHV8-infected BCBL-1 lymphoma line causes tumors in SCID mice but fails to transmit virus to a human peripheral blood mononuclear cell graft. Virology. 1997;238:22–29. doi: 10.1006/viro.1997.8822. [DOI] [PubMed] [Google Scholar]
- 65.Uddin S., Hussain A.R., Al-Hussein K.A., Manogaran P.S., Wickrema A., Gutierrez M.I., Bhatia K.G. Inhibition of phosphatidylinositol 3′-kinase/AKT signaling promotes apoptosis of primary effusion lymphoma cells. Clin Cancer Res. 2005;11:3102–3108. doi: 10.1158/1078-0432.CCR-04-1857. [DOI] [PubMed] [Google Scholar]
- 66.Cheney I.W., Johnson D.E., Vaillancourt M.T., Avanzini J., Morimoto A., Demers G.W., Wills K.N., Shabram P.W., Bolen J.B., Tavtigian S.V., Bookstein R. Suppression of tumorigenicity of glioblastoma cells by adenovirus-mediated MMAC1/PTEN gene transfer. Cancer Res. 1998;58:2331–2334. [PubMed] [Google Scholar]
- 67.Morimoto A.M., Berson A.E., Fujii G.H., Teng D.H., Tavtigian S.V., Bookstein R., Steck P.A., Bolen J.B. Phenotypic analysis of human glioma cells expressing the MMAC1 tumor suppressor phosphatase. Oncogene. 1999;18:1261–1266. doi: 10.1038/sj.onc.1202441. [DOI] [PubMed] [Google Scholar]
- 68.Petre C.E., Sin S.H., Dittmer D.P. Functional p53 signaling in Kaposi's sarcoma-associated herpesvirus lymphomas: implications for therapy. J Virol. 2007;81:1912–1922. doi: 10.1128/JVI.01757-06. [DOI] [PMC free article] [PubMed] [Google Scholar]
- 69.Herndier B.G., Werner A., Arnstein P., Abbey N.W., Demartis F., Cohen R.L., Shuman M.A., Levy J.A. Characterization of a human Kaposi's sarcoma cell line that induces angiogenic tumors in animals. AIDS. 1994;8:575–581. doi: 10.1097/00002030-199405000-00002. [DOI] [PubMed] [Google Scholar]
- 70.Albini A., Paglieri I., Orengo G., Carlone S., Aluigi M.G., DeMarchi R., Matteucci C., Mantovani A., Carozzi F., Donini S., Benelli R. The beta-core fragment of human chorionic gonadotrophin inhibits growth of Kaposi's sarcoma-derived cells and a new immortalized Kaposi's sarcoma cell line. AIDS. 1997;11:713–721. doi: 10.1097/00002030-199706000-00003. [DOI] [PubMed] [Google Scholar]
- 71.Lunardi-Iskandar Y., Gill P., Lam V.H., Zeman R.A., Michaels F., Mann D.L., Reitz M.S., Jr, Kaplan M., Berneman Z.N., Carter D., Bryant J.L., Gallo R.C. Isolation and characterization of an immortal neoplastic cell line (KS Y-1) from AIDS-associated Kaposi's sarcoma. J Natl Cancer Inst. 1995;87:974–981. doi: 10.1093/jnci/87.13.974. [DOI] [PubMed] [Google Scholar]
- 72.An F.Q., Folarin H.M., Compitello N., Roth J., Gerson S.L., McCrae K.R., Fakhari F.D., Dittmer D.P., Renne R. Long-term-infected telomerase-immortalized endothelial cells: a model for Kaposi's sarcoma-associated herpesvirus latency in vitro and in vivo. J Virol. 2006;80:4833–4846. doi: 10.1128/JVI.80.10.4833-4846.2006. [DOI] [PMC free article] [PubMed] [Google Scholar]
- 73.Wlodarski P., Kasprzycka M., Liu X., Marzec M., Robertson E.S., Slupianek A., Wasik M.A. Activation of mammalian target of rapamycin in transformed B lymphocytes is nutrient dependent but independent of Akt, mitogen-activated protein kinase/extracellular signal-regulated kinase kinase, insulin growth factor-I, and serum. Cancer Res. 2005;65:7800–7808. doi: 10.1158/0008-5472.CAN-04-4180. [DOI] [PubMed] [Google Scholar]
- 74.Majewski M., Korecka M., Kossev P., Li S., Goldman J., Moore J., Silberstein L.E., Nowell P.C., Schuler W., Shaw L.M., Wasik M.A. The immunosuppressive macrolide RAD inhibits growth of human Epstein-Barr virus-transformed B lymphocytes in vitro and in vivo: a potential approach to prevention and treatment of posttransplant lymphoproliferative disorders. Proc Natl Acad Sci USA. 2000;97:4285–4290. doi: 10.1073/pnas.080068597. [DOI] [PMC free article] [PubMed] [Google Scholar]
- 75.Kaposztas Z., Etheridge W.B., Kahan B.D. Case report: successful treatment of posttransplant lymphoproliferative disorder and quiescence of dermatomyositis with rituximab and sirolimus. Transplant Proc. 2008;40:1744–1746. doi: 10.1016/j.transproceed.2007.11.072. [DOI] [PubMed] [Google Scholar]
- 76.Cen O., Longnecker R. Rapamycin reverses splenomegaly and inhibits tumor development in a transgenic model of Epstein-Barr virus-related Burkitt's lymphoma. Mol Cancer Ther. 2011;10:679–686. doi: 10.1158/1535-7163.MCT-10-0833. [DOI] [PMC free article] [PubMed] [Google Scholar]
- 77.Ma B.B., Lui V.W., Hui E.P., Lau C.P., Ho K., Ng M.H., Cheng S.H., Tsao S.W., Chan A.T. The activity of mTOR inhibitor RAD001 (everolimus) in nasopharyngeal carcinoma and cisplatin-resistant cell lines. Invest New Drugs. 2010;28:413–420. doi: 10.1007/s10637-009-9269-x. [DOI] [PubMed] [Google Scholar]
- 78.Holtan S.G., Porrata L.F., Colgan J.P., Zent C.S., Habermann T.M., Markovic S.N. mTOR inhibitor monotherapy is insufficient to suppress viremia and disease progression in Epstein-Barr virus-driven lymphoproliferative disorders (EBV-LPD) Am J Hematol. 2008;83:688–689. doi: 10.1002/ajh.21216. [DOI] [PubMed] [Google Scholar]
- 79.Dahia P.L., Aguiar R.C., Alberta J., Kum J.B., Caron S., Sill H., Marsh D.J., Ritz J., Freedman A., Stiles C., Eng C. PTEN is inversely correlated with the cell survival factor Akt/PKB and is inactivated via multiple mechanisms in haematological malignancies. Hum Mol Genet. 1999;8:185–193. doi: 10.1093/hmg/8.2.185. [DOI] [PubMed] [Google Scholar]
- 80.Van de Sande T., De Schrijver E., Heyns W., Verhoeven G., Swinnen J.V. Role of the phosphatidylinositol 3′-kinase/PTEN/Akt kinase pathway in the overexpression of fatty acid synthase in LNCaP prostate cancer cells. Cancer Res. 2002;62:642–646. [PubMed] [Google Scholar]
- 81.Radu A., Neubauer V., Akagi T., Hanafusa H., Georgescu M.M. PTEN induces cell cycle arrest by decreasing the level and nuclear localization of cyclin D1. Mol Cell Biol. 2003;23:6139–6149. doi: 10.1128/MCB.23.17.6139-6149.2003. [DOI] [PMC free article] [PubMed] [Google Scholar]
- 82.Boulanger E., Marchio A., Hong S.S., Pineau P. Mutational analysis of TP53, PTEN, PIK3CA and CTNNB1/beta-catenin genes in human herpesvirus 8-associated primary effusion lymphoma. Haematologica. 2009;94:1170–1174. doi: 10.3324/haematol.2009.007260. [DOI] [PMC free article] [PubMed] [Google Scholar]
- 83.Abbott R.T., Tripp S., Perkins S.L., Elenitoba-Johnson K.S., Lim M.S. Analysis of the PI-3-kinase-PTEN-AKT pathway in human lymphoma and leukemia using a cell line microarray. Mod Pathol. 2003;16:607–612. doi: 10.1097/01.MP.0000067423.83712.74. [DOI] [PubMed] [Google Scholar]
- 84.Al-Khouri A.M., Ma Y., Togo S.H., Williams S., Mustelin T. Cooperative phosphorylation of the tumor suppressor phosphatase and tensin homologue (PTEN) by casein kinases and glycogen synthase kinase 3beta. J Biol Chem. 2005;280:35195–35202. doi: 10.1074/jbc.M503045200. [DOI] [PubMed] [Google Scholar]
- 85.Fujimuro M., Hayward S.D. The latency-associated nuclear antigen of Kaposi's sarcoma-associated herpesvirus manipulates the activity of glycogen synthase kinase-3beta. J Virol. 2003;77:8019–8030. doi: 10.1128/JVI.77.14.8019-8030.2003. [DOI] [PMC free article] [PubMed] [Google Scholar]
- 86.Kang G.H., Lee S., Kim W.H., Lee H.W., Kim J.C., Rhyu M.G., Ro J.Y. Epstein-Barr virus-positive gastric carcinoma demonstrates frequent aberrant methylation of multiple genes and constitutes CpG island methylator phenotype-positive gastric carcinoma. Am J Pathol. 2002;160:787–794. doi: 10.1016/S0002-9440(10)64901-2. [DOI] [PMC free article] [PubMed] [Google Scholar]
- 87.Hino R., Uozaki H., Murakami N., Ushiku T., Shinozaki A., Ishikawa S., Morikawa T., Nakaya T., Sakatani T., Takada K., Fukayama M. Activation of DNA methyltransferase 1 by EBV latent membrane protein 2A leads to promoter hypermethylation of PTEN gene in gastric carcinoma. Cancer Res. 2009;69:2766–2774. doi: 10.1158/0008-5472.CAN-08-3070. [DOI] [PubMed] [Google Scholar]
- 88.Dal Col J., Zancai P., Terrin L., Guidoboni M., Ponzoni M., Pavan A., Spina M., Bergamin S., Rizzo S., Tirelli U., De Rossi A., Doglioni C., Dolcetti R. Distinct functional significance of Akt and mTOR constitutive activation in mantle cell lymphoma. Blood. 2008;111:5142–5151. doi: 10.1182/blood-2007-07-103481. [DOI] [PubMed] [Google Scholar]
- 89.Silva A., Yunes J.A., Cardoso B.A., Martins L.R., Jotta P.Y., Abecasis M., Nowill A.E., Leslie N.R., Cardoso A.A., Barata J.T. PTEN posttranslational inactivation and hyperactivation of the PI3K/Akt pathway sustain primary T cell leukemia viability. J Clin Invest. 2008;118:3762–3774. doi: 10.1172/JCI34616. [DOI] [PMC free article] [PubMed] [Google Scholar]
- 90.Hess G., Herbrecht R., Romaguera J., Verhoef G., Crump M., Gisselbrecht C., Laurell A., Offner F., Strahs A., Berkenblit A., Hanushevsky O., Clancy J., Hewes B., Moore L., Coiffier B. Phase III study to evaluate temsirolimus compared with investigator's choice therapy for the treatment of relapsed or refractory mantle cell lymphoma. J Clin Oncol. 2009;27:3822–3829. doi: 10.1200/JCO.2008.20.7977. [DOI] [PubMed] [Google Scholar]
- 91.Sarek G., Kurki S., Enbäck J., Iotzova G., Haas J., Laakkonen P., Laiho M., Ojala P.M. Reactivation of the p53 pathway as a treatment modality for KSHV-induced lymphomas. J Clin Invest. 2007;117:1019–1028. doi: 10.1172/JCI30945. [DOI] [PMC free article] [PubMed] [Google Scholar]
Associated Data
This section collects any data citations, data availability statements, or supplementary materials included in this article.
Supplementary Materials
Immunofluorescence analysis showing the distribution of total PTEN and phospho-PTEN (S380) in PEL cells. Green punctate staining marks either total PTEN (A) or phospho-PTEN (S380) (B). Independent of its phosphorylation status, PTEN localizes to both the cytoplasm and nucleus of the cells. LANA staining (red) was exclusively localized to the nucleus, as expected, and therefore was used both as a control for nuclear staining and to denote the presence of viral episome in the PEL cells. Merge of total PTEN or phospho-PTEN (S380) illustrates the lack of colocalization of PTEN with LANA, independent of PTEN phosphorylation. DAPI (blue) nuclear counterstain added to the merge of LANA and PTEN confirms LANA localization to the nucleus. Immunofluorescence analysis was performed in three PEL cell lines, BC1, BCBL1, and BCP1, that were generated independently and show different KSHV and EBV infection, as well as distinct p53 status (as shown in Table 1). All images were processed through deconvolution software, as described under Materials and Methods. Original magnification, ×630. Scale bars, 10 µm.