

Abstract
DLK1-MEG3 is an imprinted locus consisting of multiple maternally expressed noncoding RNA genes and paternally expressed protein-coding genes. The expression of maternally expressed gene 3 (MEG3) is selectively lost in clinically nonfunctioning adenomas (NFAs) of gonadotroph origin; however, expression status of other genes at this locus in human pituitary adenomas has not previously been reported. Using quantitative real-time RT-PCR, we evaluated expression of 24 genes from the DLK1-MEG3 locus in 44 human pituitary adenomas (25 NFAs, 7 ACTH-secreting, 7 GH-secreting, and 5 PRL-secreting adenomas) and 10 normal pituitaries. The effects on cell proliferation of five miRNAs whose expression was lost in NFAs were investigated by flow cytometry analysis. We found that 18 genes, including 13 miRNAs at the DLK1-MEG3 locus, were significantly down-regulated in human NFAs. In ACTH-secreting and PRL-secreting adenomas, 12 and 7 genes were significantly down-regulated, respectively; no genes were significantly down-regulated in GH-secreting tumors. One of the five miRNAs tested induced cell cycle arrest at the G2/M phase in PDFS cells derived from a human NFA. Our data indicate that the DLK1-MEG3 locus is silenced in NFAs. The growth suppression by miRNAs in PDFS cells is consistent with the hypothesis that the DLK1-MEG3 locus plays a tumor suppressor role in human NFAs.
Human pituitary adenomas account for approximately 15% of intracranial neoplasms.1 They can be classified as clinically nonfunctioning or functioning adenomas, based on clinical phenotype and hormone hypersecretion. Clinically nonfunctioning adenomas (NFAs), mostly derived from gonadotroph cells, are often large and cause symptoms of mass effects such as visual disturbance, cranial nerve palsies, or headache. In contrast, hormone hypersecretion in functioning pituitary adenomas causes specific clinical syndromes. Human pituitary adenomas are monoclonal in origin,2 indicating that genetic and/or epigenetic events play causal roles in development of these tumors. For example, mutations in the GNAS1 gene are found in approximately 30% to 40% of GH-secreting tumors.3 Silencing of RB1 and CDKN2A genes by promoter hypermethylation is found in most human NFAs, although genetic mutations in either gene are rarely found.4,5 We identified a novel noncoding RNA gene, maternally expressed gene 3 (MEG3), which is highly expressed in the normal pituitary. In NFAs of gonadotroph origin, however, its expression is selectively lost.6,7 Loss of MEG3 expression has also been found in certain brain tumors and in many human cancer cell lines.8,9 Furthermore, MEG3 activates p53, selectively stimulates expression of p53 target genes, and inhibits cell proliferation in vitro.10 In mice, deletion of Gtl2, the murine ortholog of MEG3, causes enhanced embryonic brain angiogenesis and perinatal death.11,12 These data strongly suggest that MEG3 functions as a novel noncoding RNA tumor suppressor gene and that it plays a critical role in NFA pathogenesis.
The MEG3 gene belongs to the imprinted DLK1-MEG3 locus located on human chromosome band 14q32. The mouse ortholog DLK1-Gtl2 locus is located on distal chromosome 12. To date, at least 80 imprinted genes have been identified at this locus. Three are paternally expressed genes (PEGs): delta-like homolog 1 (DLK1), retrotransposon-like 1 (RTL1), and iodothyronine deiodinase type III (DIO3). All three are protein-coding genes. The remainder are maternally expressed genes (MEGs), which consist of large noncoding RNAs, including MEG3, MEG8, and RTL1 antisense (RTL1as), along with many small RNAs. The latter belong to three small-RNA gene families: the C/D small nucleolar RNAs (snoRNAs), the microRNAs (miRNAs), and likely piwi-interacting RNAs.13
The microRNA cluster in the DLK1-MEG3 locus, which is one of the largest miRNA clusters in humans, is organized into two smaller clusters: one is between MEG3 and MEG8 and contains approximately 9 miRNAs; the other consists of more than 40 miRNAs mapped downstream to the C/D snoRNA gene cluster.13,14 These maternally expressed miRNAs are transcribed in the same orientation as MEG3 and MEG8.15 Imprinting of the DLK1-MEG3 locus is regulated by an intergenic differentially methylated region (IG-DMR) located 13 kb upstream of the MEG3 gene. The IG-DMR is hypermethylated on the paternal chromosome.16,17 Imprinting of this locus plays an important role in growth and development. Loss of imprinting results in a phenotypic spectrum ranging from embryonic lethality to growth retardation and developmental abnormalities.18,19 In addition, dysregulation of genes at this locus has been found in a subset of human tumors, such as renal cell carcinoma and neuroblastoma,20,21 suggesting that the DLK1-MEG3 locus plays a role in the development of a number of human neoplasms.
We have previously shown that methylation in the IG-DMR and the MEG3 promoter region is increased in human NFAs, suggesting that genes in this locus also play a role in human pituitary tumor pathogenesis.6,7 This is consistent with the finding that MEG3 was not expressed in virtually all NFAs examined; however, little is known regarding expression of other imprinted genes in the DLK1-MEG3 locus in NFAs. We therefore analyzed the expression levels of 21 MEGs and all known PEGs in primary NFAs and other human pituitary tumors types by quantitative real-time PCR. We found that 18 of them were significantly down-regulated in NFAs and 12 and 7 were down-regulated in ACTH-secreting and PRL-secreting tumors, respectively. In contrast, none of the genes examined were significantly down-regulated in GH-secreting tumors. Transfection of the significantly down-regulated miR-134 resulted in cell cycle arrest in PDFS cells, which are derived from a human clinically NFA. Our data are consistent with the hypothesis that silencing of the DLK1-MEG3 locus plays an important role in human NFA pathogenesis.
Materials and Methods
Tissue and Tumor Samples
Tissues from 44 human pituitary adenomas were obtained during surgery at Massachusetts General Hospital (25 NFA, 7 somatotropin-secreting, 7 adrenocorticotropic hormone-secreting, and 5 prolactin-secreting tumors). Of the total, 40 were macroadenomas and 4 (all ACTH-secreting) were microadenomas. Tumor tissue not used for standard pathological examination was stored in Ambion RNAlater solution (Applied Biosystems, Austin, TX) at −20°C or snap-frozen and stored in liquid nitrogen until use. Immunohistochemical staining for follicle stimulating hormone subunit beta (FSHβ), luteinizing hormone subunit beta (LHβ), thyrotropin subunit beta (TSHβ), prolactin (PRL), somatotropin (GH), adrenocorticotropic hormone (ACTH), and glycoprotein hormone α-subunit was performed on formalin-fixed, paraffin-embedded sections. Immunohistochemical results are given in Table 1, and additional characteristics of nonfunctioning pituitary tumors (ie, patient age at tumor onset, tumor size, and proliferation index) are given in Table 2. The study was approved by the Partners institutional review board.
Table 1.
Clinical and Immunohistochemical Characteristics of 44 Human Pituitary Adenomas
| Clinical diagnosis | Immunohistochemical status⁎ |
||||||
|---|---|---|---|---|---|---|---|
| FSH | LH | TSH | α-Subunit | PRL | GH | ACTH | |
| Nonfunctioning adenoma | |||||||
| 1 | rare | − | rare | rare | − | − | 1+ |
| 2 | − | − | − | − | − | − | − |
| 3 | rare | − | − | rare | − | − | − |
| 4 | 3+ | − | − | 1+ | rare | − | − |
| 5 | 3+ | 4+ | 3+ | 1+ | − | − | − |
| 6 | 1+ | rare | rare | − | − | − | − |
| 7 | rare | − | − | rare | − | − | − |
| 8 | − | − | − | − | − | rare | − |
| 9 | − | rare | − | − | − | − | − |
| 10 | − | − | rare | − | − | − | rare |
| 11 | 3+ | 4+ | 4+ | rare | rare | − | − |
| 12 | 2+ | 3+ | 1+ | 1+ | rare | − | − |
| 13 | 1+ | 1+ | 1+ | rare | rare | rare | − |
| 14 | rare | 2+ | 1+ | − | rare | − | − |
| 15 | 1+ | rare | − | − | rare | − | − |
| 16 | 1+ | 1+ | 1+ | rare | − | − | − |
| 17 | 1+ | rare | 1+ | 1+ | − | − | − |
| 18 | 4+ | 4+ | − | rare | rare | − | − |
| 19 | rare | − | rare | rare | rare | − | rare |
| 20 | 1+ | 1+ | 1+ | 1+ | rare | − | − |
| 21 | 3+ | 3+ | 1+ | rare | 1+ | − | − |
| 22 | 1+ | 1+ | 1+ | 1+ | 1+ | − | − |
| 23 | − | − | − | − | rare | 1+ | − |
| 24 | − | − | − | − | − | − | − |
| 25 | − | − | − | − | − | − | − |
| Acromegaly | |||||||
| 26 | ND | ND | ND | − | rare | 3+ | ND |
| 27 | rare | 1+ | − | − | 2+ | 3+ | 1+ |
| 28 | − | − | − | − | 3+ | 4+ | − |
| 29 | rare | rare | 3+ | 3+ | rare | 4+ | − |
| 30 | ND | ND | ND | 2+ | 2+ | 4+ | ND |
| 31 | ND | ND | ND | − | ND | 4+ | ND |
| 32 | ND | ND | ND | ND | 2+ | 3+ | ND |
| Prolactinoma | |||||||
| 33 | − | − | − | − | 4+ | 2+ | − |
| 34 | − | − | − | − | 4+ | 2+ | − |
| 35 | − | − | − | − | 4+ | − | − |
| 36 | − | − | − | − | 4+ | − | − |
| 37 | − | − | − | − | 4+ | − | − |
| Cushing's disease | |||||||
| 38 | rare | − | − | − | − | − | 4+ |
| 39 | ND | ND | ND | ND | − | ND | 4+ |
| 40 | ND | ND | ND | − | − | ND | 4+ |
| 41 | − | − | − | − | − | − | 4+ |
| 42 | ND | ND | ND | ND | rare | ND | 4+ |
| 43 | − | − | − | 1+ | rare | − | 4+ |
| 44 | − | − | − | − | 1+ | − | 4+ |
ACTH, adrenocorticotropic hormone; FSH, follicle-stimulating hormone; GH, somatotropin (growth hormone); LH, luteinizing hormone; PRL, prolactin; TSH, thyrotropin (thyroid-stimulating hormone); α-subunit of glycoprotein hormones.
Immunostaining was graded by the number of positive cells: −, negative; rare, only a few cells are positive; 1+, 1% to 5% positivity; 2+, 6% to 20% positivity; 3+, 21% to 50% positivity; 4+, >50% positivity; ND, not done (staining was not performed).
Table 2.
Clinical Characteristics of 25 Human Clinically Nonfunctioning Pituitary Adenomas
| No. | Sex | Age at onset (years) | Tumor size (cm) | Ki-67 (%) |
|---|---|---|---|---|
| 1 | M | 50 | 2.2 | 1.7 |
| 2 | M | 63 | 3.7 | <1 |
| 3 | M | 88 | 3 | <1 |
| 4 | M | 65 | 2.5 | <1 |
| 5 | F | 74 | 2.1 | 2.1 |
| 6 | F | 60 | 2 | <1 |
| 7 | M | 60 | 2.5 | 2.6 |
| 8 | F | 66 | 2.5 | <1 |
| 9 | M | 52 | 2.8 | 1.7 |
| 10 | M | 46 | 3 | 3.6 |
| 11 | M | 68 | 2.3 | 2.2 |
| 12 | M | 59 | 1.8 | 1.5 |
| 13 | M | 53 | 2 | <1 |
| 14 | F | 67 | 1.6 | <1 |
| 15 | M | 50 | 1.6 | <1 |
| 16 | F | 69 | 1.8 | <1 |
| 17 | M | 37 | 5 | 3.2 |
| 18 | M | 55 | 1.5 | <1 |
| 19 | M | 53 | 2 | 1.7 |
| 20 | M | 48 | 2.1 | 2.5 |
| 21 | F | 58 | 2.7 | 1.5 |
| 22 | M | 65 | 3 | 3.6 |
| 23 | M | 59 | 3 | 3.9 |
| 24 | M | 80 | 1.5 | ND |
| 25 | M | 82 | 3.1 | <1 |
F, female; M, male; ND, not done (analysis not performed).
RNA Extraction and cDNA Synthesis
Total RNA was isolated using TRIzol reagent according to the manufacturer's instructions (Invitrogen, Carlsbad, CA). RNA quality was determined by two methods. The overall integrity of RNAs was determined using the Bioanalyzer platform (Agilent Technologies, Santa Clara, CA). Samples showing significant RNA degradation were excluded from further assays. We also evaluated the transcripts of internal controls, including GAPDH for large RNA and SNORD44 for small RNA, by quantitative RT-PCR. We considered an RNA sample acceptable for further analysis if the cycle threshold counts (Ct values) for these controls were approximately 20 to 22. One microgram of total RNA was subjected to reverse transcription using a ProtoScript M-MuLV first-strand cDNA synthesis kit (New England Biolabs, Ipswich, MA). MicroRNA cDNA synthesis was performed with 1 μg of total RNA using an NCode VILO miRNA cDNA synthesis kit according to the manufacturer's protocol (Invitrogen, Carlsbad, CA).
Quantitative Real-Time RT-PCR
Expression of MEG3 (NR_002766), MEG8 (NR_024149), DLK1 (NM_003836), RTL1 (NM_001134888), and DIO3 (NM_001362) was quantified using TaqMan probes and TaqMan universal PCR master mix (Applied Biosystems, Foster City, CA). GAPDH was used as the internal control. Expression levels of miRNAs and snoRNAs were determined using an EXPRESS SYBR GreenER miRNA qRT-PCR kit (Invitrogen) according to the manufacturer's instructions. PCR reactions were performed using the NCode universal reverse primer (Invitrogen) in conjunction with specific forward primers for each miRNA. The PCR forward primer sequences were obtained using Invitrogen's NCode database (http://escience.invitrogen.com/ncode) or were custom-designed based on mature miRNA sequences (http://www.mirbase.org), as follows: hsa-miR-127-3p (MIMAT0000446), 5′-GATCCGTCTGAGCTTGGCT-3′; hsa-miR-134 (MIMAT0000447), 5′-TGTGACTGGTTGACCAGAGGGG-3′; hsa-miR-136 (MIMAT0000448), 5′-GCACTCCATTTGTTTTGATGTGGA-3′; hsa-miR-154 (MIMAT0000452), 5′-TAGGTTATCCGTGTTGCCTTCG-3′; hsa-miR-299-5p (MIMAT0002890), 5′-TGGTTTACCGTCCCACATACAT-3′; hsa-miR-323-3p (MIMAT0000755), 5′-CACATTACACGGTCGACCTCT-3′; hsa-miR-329 (MIMAT0001629), 5′-CAACACACCTGGTTAACCTCTTT-3′; hsa-miR-337-5p (MIMAT0004695), 5′-GAACGGCTTCATACAGGAGTT-3′; hsa-miR-369-5p (MIMAT0001621, 5′-AGATCGACCGTGTTATATTCGC-3′; hsa-miR-369-3p (MIMAT0000721), 5′-CGGAATAATACATGGTTGATCTTT-3′; hsa-miR-370 (MIMAT0000722), 5′-CTGGGGTGGAACCTGGTAAAA-3′; hsa-miR-376c (MIMAT0000720), 5′-CAACATAGAGGAAATTCCACGT-3′; hsa-miR-377 (MIMAT0000730), 5′-GCATCACACAAAGGCAACTTTTGT-3′; hsa-miR-380 (MIMAT0000735), 5′-CCGTATGTAATATGGTCCACATCTT-3′; hsa-miR-410(MIMAT0002171), 5′-GCGAATATAACACAGATGGCCTGT-3′; hsa-miR-431 (MIMAT0001625), 5′-CAGGCCGTCATGCAAAA-3′; hsa-miR-432 (MIMAT0002814), 5′-TGGAGTAGGTCATTGGGTGG-3′; hsa-miR-433 (MIMAT0001627), 5′-GATGGGCTCCTCGGTGTAAA-3′; and hsa-miR-770-5p (MIMAT0003948), 5′-CCCTGACACGTGGTACTGGAAA-3′; SNORD113-5 (NR_003233.1), 5′-GGATCAATGATGAGTATTGGTGGA-3′. Housekeeping genes SNORD44 and SNORD48 were used as internal controls. SNORD44 and SNORD48 are members of a group of snoRNAs that function as guide RNAs in the site-specific ribose methylation of pre-rRNA.22 Both snoRNAs have been widely used as internal controls for quantitative RT-PCR.23–27 The forward primers were as follows: SNORD44 (NR_002750.2), 5′-CCTGGATGATGATAGCAAATGCTG-3′; and SNORD48 (NR_002745.1), 5′-AGTGATGATGACCCCAGGTAACT-3′.
PCR efficiency was tested on each primer pair using the 10-fold serial dilution method. The Ct values were plotted against the log of cDNA dilution. The amplification rate was calculated based on a linear regression slope using the equation m = −(1/log E), where m is the slope and E is the efficiency. In all primer sets, efficiencies ranged between 1.8 and 2.2, which is considered optimal.28 All PCR reactions were done in triplicate and were repeated once on an Applied Biosystems 7500 fast thermocycler with the following parameters: 50°C for 2 minutes, 95°C for 10 minutes, and 40 cycles of 95°C for 15 seconds and 60°C for 1 minute. Melting curve analysis was performed and a no-template control was included in every qPCR using an Invitrogen SYBR PCR master mix.
Expression levels for each tested gene in normal pituitaries and tumors were determined using the formula 2−ΔCt, where ΔCt = Cttested gene − Ctinternal control. The relative tumor expression levels for each gene were calculated by normalizing the value from the tumor against the mean average of values from the 10 normal pituitaries. The statistical significance of gene expression between NFAs, functioning adenomas, and normal pituitary was assessed by a two-tailed Student's t-test with unequal variance and multiple range test. P < 0.05 was considered significant.
Double Immunofluorescence Staining
Normal anterior pituitaries were fixed in formalin and embedded in paraffin. Sections were cut at 5-μm thickness. Detection of DLK1 and FSHβ in the same sections was performed by double immunofluorescence staining, as described previously,6 using antibodies against human DLK1 protein (Santa Cruz Biotechnologies, Santa Cruz, CA). The antibody against FSHβ was obtained from Dr. A.F. Parlow, National Hormone and Peptide Program, NIH-National Institute of Diabetes and Digestive and Kidney Diseases.
MicroRNA Transfection and Cell Cycle Analysis
The human pituitary-derived cell line (PDFS) was maintained as described previously29 and plated into six-well plates in triplicate 24 hours before transfection. The cells were transfected with a miRIDIAN miRNA mimic of hsa-miR-134 (MIMAT0000447), hsa-miR-136 (MIMAT0000448), hsa-miR-154 (MIMAT0000452), hsa-miR-299-5p (MIMAT0002890), and hsa-miR-369-5p (MIMAT0001621) (Thermo Scientific-Dharmacon, Lafayette, CO) using a DharmaFECT 1 transfection reagent according to manufacturer's instructions. Negative control wells were transfected with miRIDIAN microRNA mimic negative control no. 1. FAM-labeled Pre-miR negative control no. 1 (Ambion, Austin, TX) was used to determine transfection efficiency. Final concentrations of all synthetic miRNAs were 25 nmol/L in a 2-mL final transfection volume. At 48 hours after transfection, cells were harvested, fixed in 70% ice-cold ethanol, and stained with propidium iodide. Cell cycle analyses were performed at the Flow Cytometry Core, Massachusetts General Hospital. All experiments were repeated three times.
Statistical Analysis
Expression-level data are reported as means ± SD, except as otherwise specified. Group comparisons were made using a two-sided independent samples t-test. Associations between loci were examined by Pearson's correlation coefficient. A P value of <0.05 was interpreted as significant.
Results
Expression of Maternally Expressed Genes in the DLK1-MEG3 Locus in Human Pituitary Adenomas
Over 80 genes have been identified in the DLK1-MEG3 locus (Figure 1).14,19 Of these, three are paternally expressed protein-coding genes (DLK1, RTL1, and DIO3); all the others are maternally expressed large noncoding RNAs, snoRNAs, and miRNAs. Using quantitative real-time PCR, we investigated the expression of these genes in NFAs and three functioning human pituitary adenoma types. Almost no expression of MEG3 is detected in clinically NFAs (Figure 2A), in contrast to clinically functioning tumors. MEG8 is a large noncoding RNA, located is approximately 33 kb downstream of MEG3. Its expression is lost in NFAs and significantly reduced in ACTH-secreting tumors; in both PRL-secreting and GH-secreting tumors, however, its expression is comparable to that in normal pituitary (Figure 2B). Similarly, expression of SNORD113, a snoRNA located approximately 80 kb downstream of MEG3, is significantly reduced in both NFAs and ACTH-secreting tumors, but not in PRL-secreting and GH-secreting tumors (Figure 2C).
Figure 1.
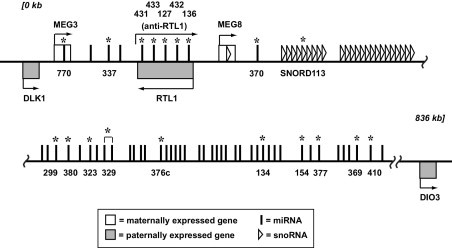
The DLK1-MEG3 imprinting locus on human chromosome band 14q32. MEG3, MEG8, snoRNAs, and miRNAs are maternally expressed noncoding RNAs transcribed in the direction from 5′ to 3′. DLK1, RTL1, and DIO3 are paternally expressed protein-coding genes transcribed in either direction, as indicated by arrows. The SnoRNA and miRNA IDs indicated by names or numbers and marked with asterisks were subjected to test by quantitative RT-PCR. The length and distance are not depicted to scale.
Figure 2.
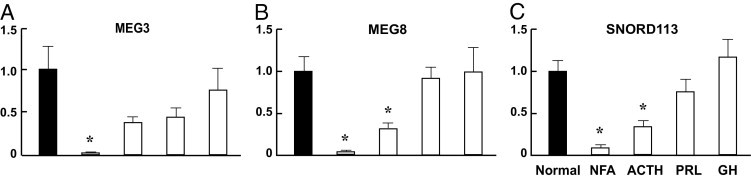
Expression of MEG3 (A), MEG8 (B), and SNORD113 (C) in human pituitary adenomas. Transcripts were detected by quantitative real-time PCR, as described under Materials and Methods. Values from normal pituitaries were designated as 1, against which values from pituitary tumors were normalized. Data were obtained using 10 normal pituitaries, 25 NFAs, 7 GH-secreting, 5 PRL-secreting, and 7 ACTH-secreting tumors. Data are reported as means ± SEM. Student's t-test was used to compare values between tumors and the normal pituitaries. *P < 0.05.
More than 50 miRNAs have been identified in the DLK1-MEG3 locus. Of these, 18 were examined for their expression (Table 3). These 18 miRNAs were chosen mainly on the basis of their locations, spanning the entire locus (Figure 1). We found that NFAs had 13 miRNAs whose expression was lost or significantly diminished versus normal pituitary (Table 3). ACTH-secreting and PRL-secreting tumors had 9 and 7 significantly down-regulated miRNAs, respectively; no miRNAs were down-regulated in GH-secreting tumors. In contrast, the GH-secreting tumors had 12 significantly up-regulated miRNAs, but NFAs and ACTH-secreting tumors had only 2 and 1 significantly up-regulated miRNAs, respectively, and no miRNA was significantly up-regulated in PRL-secreting tumors. Among the significantly down-regulated miRNAs, the detected expression levels generally remained significantly higher in functioning tumors (ACTH-secreting and PRL-secreting tumors) than in NFAs. For example, levels of, miR-299-5p, miR-377, and miR-433 were significantly higher in ACTH-secreting tumors versus NFA (Table 3). Levels of miR-154, miR-329, and miR-376c in NFAs were significantly higher in PRL-secreting tumors, compared with their levels in NFAs (Table 3). The expression pattern of miRNAs was highly similar between ACTH-secreting tumors and PRL-secreting tumors. In 90% of miRNAs examined, there was no significant difference in expression levels between these two types of tumors (Table 3).
Table 3.
Expression Levels of miRNAs in Human Pituitary Adenomas
| miRNA | Expression level (mean ± SD) and significance⁎ |
|||
|---|---|---|---|---|
| NFA | GH | PRL | ACTH | |
| miR-127-3p | 0.559 ± 0.569 | 1.767 ± 1.279 | 0.482 ± 0.22 | 0.348 ± 0.143 |
| versus normal | P = 0.06 | P = 0.178 | P = 0.028 | P = 0.006 |
| versus NFA | P = 0.054 | P = 0.417 | P = 0.048 | |
| miR-134 | 0.047 ± 0.190 | 5.281 ± 2.712 | 1.44 ± 0.794 | 0.951 ± 0.926 |
| versus normal | P < 0.001 | P = 0.006 | P = 0.289 | P = 0.896 |
| versus NFA | P = 0.002 | P = 0.017 | P = 0.041 | |
| miR-136 | 0.002 ± 0.01 | 1.492 ± 0.884 | 0.932 ± 0.972 | 0.138 ± 0.26 |
| versus normal | P < 0.001 | P = 0.195 | P = 0.885 | P < 0.001 |
| versus NFA | P = 0.005 | P = 0.108 | P = 0.348 | |
| miR-154 | 0.087 ± 0.140 | 2.163 ± 0.706 | 0.512 ± 0.125 | 0.309 ± 0.217 |
| versus normal | P < 0.001 | P = 0.004 | P < 0.001 | P < 0.001 |
| versus NFA | P < 0.001 | P < 0.001 | P = 0.057 | |
| miR-299-5p | 0.048 ± 0.127 | 4.692 ± 2.359 | 1.003 ± 0.215 | 0.492 ± 0.295 |
| versus normal | P < 0.001 | P = 0.006 | P = 0.993 | P = 0.003 |
| versus NFA | P = 0.002 | P < 0.001 | P = 0.012 | |
| miR-323-3p | 0.029 ± 0.111 | 2.345 ± 1.108 | 0.737 ± 0.576 | 0.828 ± 0.591 |
| versus normal | P < 0.001 | P = 0.018 | P = 0.415 | P = 0.543 |
| versus NFA | P = 0.002 | P = 0.068 | P = 0.017 | |
| miR-329 | 0.041 ± 0.090 | 2.422 ± 0.944 | 0.57 ± 0.262 | 0.5 ± 0.296 |
| versus normal | P < 0.001 | P = 0.006 | P = 0.02 | P = 0.006 |
| versus NFA | P = 0.001 | P = 0.012 | P = 0.009 | |
| miR-337 | 1.356 ± 1.234 | 4.262 ± 4.593 | 0.26 ± 0.582 | 0.395 ± 0.68 |
| versus normal | P = 0.212 | P = 0.109 | P = 0.043 | P = 0.061 |
| versus NFA | P = 0.166 | P = 0.005 | P = 0.007 | |
| miR-369-5p | 0.047 ± 0.071 | 2.328 ± 0.707 | 0.254 ± 0.352 | 0.29 ± 0.32 |
| versus normal | P < 0.001 | P = 0.002 | P = 0.005 | P < 0.001 |
| versus NFA | P < 0.001 | P = 0.314 | P = 0.123 | |
| miR-369-3p | 0.08 ± 0.188 | 2.107 ± 1.273 | 0.747 ± 0.57 | 0.127 ± 0.17 |
| versus normal | P < 0.001 | P = 0.062 | P = 0.394 | P < 0.001 |
| versus NFA | P = 0.006 | P = 0.061 | P = 0.635 | |
| miR-370 | 0.290 ± 0.270 | 4.004 ± 2.353 | 0.707 ± 0.182 | 0.676 ± 0.278 |
| versus normal | P < 0.001 | P = 0.015 | P = 0.074 | P = 0.068 |
| versus NFA | P = 0.006 | P = 0.004 | P = 0.016 | |
| miR-376c | 0.039 ± 0.102 | 2.382 ± 0.931 | 0.442 ± 0.27 | 0.271 ± 0.245 |
| versus normal | P < 0.001 | P = 0.007 | P = 0.013 | P = 0.001 |
| versus NFA | P = 0.001 | P = 0.033 | P = 0.064 | |
| miR-377 | 0.067 ± 0.132 | 4.058 ± 1.403 | 1.072 ± 0.334 | 0.619 ± 0.291 |
| versus normal | P < 0.001 | P = 0.001 | P = 0.699 | P = 0.023 |
| versus NFA | P < 0.001 | P = 0.002 | P = 0.002 | |
| miR-380 | 1.496 ± 1.174 | 3.095 ± 2.5 | 1.101 ± .556 | 0.806 ± 0.315 |
| versus normal | P = 0.119 | P = 0.069 | P = 0.754 | P = 0.399 |
| versus NFA | P = 0.187 | P = 0.148 | P = 0.007 | |
| miR-410 | 0.036 ± 0.174 | 4.285 ± 1.936 | 1.122 ± 1.208 | 1.104 ± 0.835 |
| versus normal | P < 0.001 | P = 0.004 | P = 0.835 | P = 0.767 |
| versus NFA | P = 0.001 | P = 0.134 | P = 0.019 | |
| miR-431 | 2.441 ± 2.240 | 6.157 ± 3.569 | 1.585 ± 1.055 | 1.876 ± 0.833 |
| versus normal | P = 0.007 | P = 0.009 | P = 0.291 | P = 0.033 |
| versus NFA | P = 0.042 | P = 0.135 | P = 0.186 | |
| miR-432 | 0.067 ± 0.198 | 4.247 ± 1.582 | 1.253 ± 0.734 | 1.213 ± 0.671 |
| versus normal | P < 0.001 | P = 0.001 | P = 0.511 | P = 0.486 |
| versus NFA | P < 0.001 | P = 0.029 | P = 0.006 | |
| miR-433 | 0.065 ± 0.098 | 0.979 ± 0.985 | 0.402 ± 0.331 | 0.539 ± 0.309 |
| versus normal | P < 0.001 | P = 0.958 | P = 0.011 | P = 0.007 |
| versus NFA | P = 0.061 | P = 0.131 | P = 0.011 | |
| miR-770-5p | 3 ± 3.704 | 2.95 ± 2.301 | 0.984 ± 0.67 | 1.248 ± 1.027 |
| versus normal | P = 0.018 | P = 0.067 | P = 0.963 | P = 0.566 |
| versus NFA | P = 0.928 | P = 0.013 | P = 0.035 | |
Values from normal pituitaries were designated as 1, against which values from pituitary tumors were normalized. Data were obtained using 10 normal pituitaries, 25 NFAs, and 7 GH-secreting, 5 PRL-secreting, and 7 ACTH-secreting tumors. P values were obtained from two-tailed Student's t-test with unequal variance.
The NFA group consists of 25 tumors, which are derived from patients with specific clinical and pathological characteristics (Table 2). To determine whether gene expression in these tumors is influenced by age of diagnosis, tumor size, or Ki-67 staining, we analyzed the relationship between expression levels of individual genes in NFAs and these characteristics. We found that the expression level of miR-134 is positively correlated with patient age at tumor diagnosis (r = 0.430, P = 0.0318), and that of miR-337 is positively correlated with Ki-67 index (r = 0.441, P = 0.0311); however, no significant correlations were found between the rest of the genes and tumor size, proliferation status (as assessed by Ki-67 staining), or age at diagnosis.
All maternally expressed genes in the DLK1-MEG3 locus are transcribed in the same orientation. The MEG3 gene is upstream of all other MEGs. We have previously shown that deletion of the Gtl2 gene and a small portion of its upstream promoter in mice resulted in silencing of all downstream maternally expressed genes,12 suggesting a possible dependence of downstream MEG expression on MEG3. We therefore analyzed the relationship between MEG3 expression and its downstream MEGs in pituitary tumors and normal pituitary tissue using their expression data obtained by quantitative real-time PCR. We found that expression of 14/20 MEGs significantly correlated with MEG3 expression (Table 4). The two genes whose expression was highly correlated with MEG3 expression were MEG8 (r = 0.863) and SNORD113 (r = 0.642).
Table 4.
Correlation between Expression of MEG3 and Other Maternally Expressed Genes in the DLK1-MEG3 Locus in Normal Pituitary and in Pituitary Adenomas
| Gene symbol⁎ | Pearson's r | P value |
|---|---|---|
| MEG8 | 0.863 | <0.001 |
| SNORD113-5 | 0.642 | <0.001 |
| MIR369-5p | 0.533 | <0.001 |
| MIR376c | 0.522 | <0.001 |
| MIR323-3p | 0.463 | <0.001 |
| MIR329 | 0.463 | <0.001 |
| MIR154 | 0.453 | <0.001 |
| MIR369-3p | 0.439 | <0.001 |
| MIR377 | 0.436 | 0.001 |
| MIR433 | 0.424 | 0.001 |
| MIR136 | 0.410 | 0.002 |
| MIR370 | 0.378 | 0.005 |
| MIR432 | 0.377 | 0.005 |
| MIR410 | 0.332 | 0.014 |
| MIR299-5p | 0.28 | 0.040 |
| MIR134 | 0.259 | 0.058 |
| MIR127-3p | 0.175 | 0.206 |
| MIR337 | 0.053 | 0.701 |
| MIR431 | −0.050 | 0.722 |
| MIR380 | −0.113 | 0.418 |
| MIR770-5p | −0.189 | 0.170 |
Associations between MEG3 expression levels and the rest of the maternally expressed genes were examined by Pearson's correlation coefficient. A P value of <0.05 was interpreted as significant. (n = 54).
For miRNA genes, -3p and -5p denote miRNAs derived from the 3′ arm and the 5′ arm of the precursor miRNA, respectively.
Expression of Paternally Expressed Genes in the DLK1-MEG3 Locus In Human Pituitary Adenomas
The expression of three known paternally expressed genes in the DLK1-MEG3 locus (ie, DLK1, RTL1, and DIO3) was examined by quantitative real-time PCR. We found no significant change in DIO3 expression in either NFAs or functioning tumors. RTL1 expression was significantly down-regulated in NFAs, but not in any functioning tumors. DLK1 expression was reduced 2500-fold in NFAs, compared with normal pituitary (Figure 3A). DLK1 expression was also significantly reduced in ACTH-secreting tumors, but not in GH-secreting or PRL-secreting tumors (Figure 3A). The finding that DLK1 was virtually undetectable in all NFAs examined raised the possibility that DLK1 is not expressed in normal gonadotroph cells, from which most NFAs were derived. We therefore performed double immunofluorescence staining on normal human anterior pituitaries using antibodies against DLK1 and FSHβ to determine the DLK1 expression status in normal gonadotroph cells. DLK1 was readily detected in FSH-expressing cells, indicating that gonadotroph cells normally express DLK1 (Figure 3B).
Figure 3.
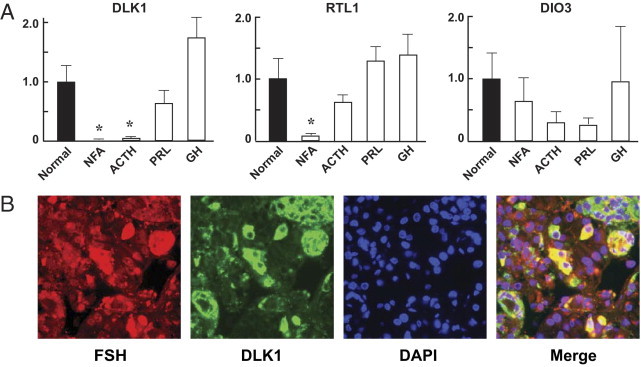
Paternally expressed genes. A: Expression of DLK1, RTL1, and DIO3 in clinically NFA, ACTH-secreting, PRL-secreting, and GH-secreting pituitary adenomas was detected by quantitative real-time PCR as described under Materials and Methods. Values from normal pituitaries were designated as 1, against which values from pituitary tumors were normalized. Data are reported as means ± SEM. Student's t-test was used to compare values between tumors and the normal pituitaries. *P < 0.05. B: Coexpression of DLK1 and FSHβ in normal human anterior pituitary. Sections of normal pituitaries were immunostained with antibodies against DLK1 and FSHβ, and nuclei were stained by DAPI. The merged image demonstrates the co-localization (yellow) of DLK1 and FSHβ in normal pituitary cells. Original magnification, 400×.
Ectopic Expression of miR-134 Caused Cell Cycle Arrest in Pituitary Tumor Cells
Of the miRNAs examined, 70% were significantly down-regulated in NFAs, suggesting that loss of expression of these miRNAs in this locus plays a role in development of these tumors. We therefore selected five miRNAs (miR-134, miR-136, miR-154, miR-299-5p, and miR-369-5p) to test this possibility. These five miRNAs were selected because all five were significantly down-regulated and detected at very low expression levels among all of the miRNAs tested in NFAs and because these miRNAs were not detected in PDFS cells (data not shown), which are derived from a human NFA.29 Individual synthetic miRNAs of miR-134, miR-136, miR-154, miR-299-5p, and miR-369-5p were transfected into PDFS cells and cell cycle analysis was performed using these transfected cells. Transfection of miR-134 significantly decreased the G0/G1 cell population and increased the G2/M population in PDFS cells by 33% (P = 0.002) and 128% (P = 0.014), respectively, compared with transfection of the negative control (Figure 4). In contrast, transfection of miR-136, miR-154, miR-299-5p, and miR-369-5p did not affect the cell cycle profiles in PDFS cells, compared with transfection of a nonspecific negative control miRNA (Figure 4).
Figure 4.
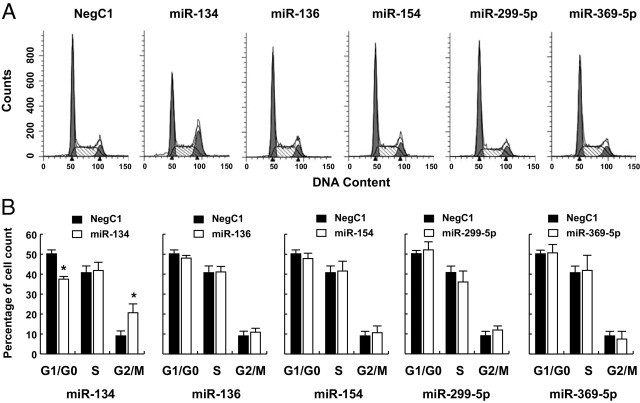
Cell cycle arrest induced by miRNA. PDFS cells were transfected with synthetic miRIDIAN microRNA mimic negative control no. 1 (NegC1), miR-134, miR-136, miR-154, miR-299-5p, and miR-369-5p. At 48 hours after transfection, cells were harvested, fixed, stained with propidium iodide, and subjected to cell cycle analysis. A: Representative histograms of flow cytometry analysis for PDFS cells transfected with synthetic miRNAs. B: Percentages of cells in each phase of the cell cycle were calculated using data from at least three independent experiments (mean ± SD). Student's t-test was used to compare values between cells transfected with miRNAs and the negative control. *P < 0.05.
Discussion
The DLK1-MEG3 locus consists of multiple maternally expressed and paternally expressed genes whose imbalanced expression has been implicated in a number of human malignancies. MEG3, the first noncoding RNA identified at this locus, is selectively lost in human clinically NFA,6 and its ectopic expression activates p5310 and inhibits cell proliferation in vitro.9,10 These data indicate that loss of MEG3 noncoding RNA plays an important role in the pathogenesis of human NFAs. We found that, in clinically NFAs, expression of 75% of maternally expressed and paternally expressed genes examined was virtually abolished. Although a significant percentage of down-regulated genes was also found in ACTH-secreting and PRL-secreting tumors, their expression levels were significantly higher than their expression in NFAs. In contrast, none of the genes examined were significantly down-regulated in GH tumors, but 50% of the genes were significantly up-regulated. These data indicate that the DLK1-MEG3 locus is silenced exclusively in human NFAs and suggest that the silencing of this locus contributes to NFA development.
Emerging evidence indicates that noncoding RNAs play an important role in the pathogenesis of many human neoplasms. Noncoding RNAs, such as miRNAs, may function as tumor suppressors. For example, loss of miR-15a and miR-16-1 expression contributes to the development of chronic lymphocytic leukemia.30,31 Various miRNAs may also function as oncogenes. Up-regulation of miR-21 occurs in several types of solid tumors and leukemia32–34 and may promote tumor growth by targeting tumor suppressive genes, including PTEN, PDCD4, and TPM1.35–37 The possible involvement of miRNAs in human pituitary tumors has also been reported. Stilling et al38 profiled miRNA expression using a microarray technique and found that 188 miRNAs are up-regulated and 160 miRNAs are down-regulated in corticotroph adenomas, compared with normal pituitaries. Bottoni et al39 reported that expression of miR-15a and of miR-16-1 is significantly reduced in both corticotroph adenomas and prolactinomas. Amaral et al25 also reported that several miRNAs, including let-7a, miR-15a, miR-16, miR-21, miR-141, miR-143, miR-145, and miR-150, are significantly down-regulated in corticotropinomas compared with normal pituitary.
We examined expression of 18 miRNAs within the DLK1-MEG3 locus in normal pituitaries and pituitary tumors. Expression of miR-134, miR-323, miR-370, miR-410, and miR-432 were significantly down-regulated in NFAs but not in functioning tumors, suggesting that these miRNAs play a role in the pathogenesis of clinically NFAs. The mechanism whereby loss of expression of these miRNAs contributes to the development of NFAs is unknown. One possibility we investigated is the involvement of these miRNAs in cell cycle regulation. Guo et al40 reported that miR-134 induced cell cycle arrest in the lung cancer cell line H68AR. In accord, we found that miR-134 arrested the cell cycle at the G2/M phase in PDFS cells. The PDFS line has characteristics of folliculostellate cells. Normal folliculostellate cells account for up to 10% of cell population of the anterior pituitary and are known to be part of pituitary tumors. The PDFS cell line was established because of spontaneous transformation of human NFA tumor cells, which suggests that these cells have acquired additional genetic or epigenetic mutations during cell culture, making the cell line phenotypically aggressive. Given that miR-134 is capable of inhibiting proliferation of PDFS in culture, it is highly likely that miR-134 can suppress proliferation of other cell types in the pituitary.
Other miRNAs at the DLK1-MEG3 locus whose expression was also significantly down-regulated in NFAs may also play a role in suppression of NFA development. For example, miR-377 expression was found to be significantly elevated in senescent human fibroblast WI-38 cells,41 and miR-369 was elevated in senescing mesenchymal stem cells,42 suggesting that these miRNAs are involved in regulating cellular senescence, which is one of the most important tumor suppression mechanisms. Luo et al43 reported that miR-433 was down-regulated in human gastric cancers. It is thought that miR-433 may suppress tumor growth by regulating its target, GRB2,43 which is a crucial adaptor protein mediating growth signaling to the cell.44 We also observed that two miRNAs (miR-431 and miR-770) were significantly up-regulated in NFAs. Little is known about their functions, however, and whether their high expression in NFAs plays a role in promoting tumor growth remains unknown.
The imprinting of the DLK1-MEG3 locus is controlled by the IG-DMR. Deletion of this region in mice caused complete silencing of all maternally expressed genes and activation of paternally expressed genes.16 The MEG3 gene also plays a pivotal role in imprinting regulation. We previously reported that deletion of the Gtl2 gene and a small portion of its upstream promoter in mice silences MEGs and activates PEGs, such as DLK1.12 Expression of DLK1 was increased twofold in mice with deletion of the IG-DMR or the Gtl2 gene. In human NFAs, expression of MEG3 is virtually completely abolished. Surprisingly, DLK1 expression was completely lost in all NFAs examined.
DLK1 (synonym: Pref-1) functions as an inhibitor of adipocyte differentiation.45 Its role in tumor development is not clear; the function of DLK1 is cell-type dependent, acting either as an oncogene or as a tumor suppressor. Expression of DLK1 is elevated in gliomas, and ectopic expression of DLK1 stimulates glioblastoma cell line proliferation.46 DLK1 can also be activated by PTTG and is thought to mediate inhibition of differentiation by PTTG.47 Kim et al48 reported that high levels of DLK1 expression inhibits differentiation and enhances tumorigenic potential in tumor cells. In contrast, Li et al49 reported that expression of DLK1 resulted in inhibition of proliferation in hematopoietic cells. Furthermore, Kawakami et al21 demonstrated that DLK1 expression is lost in human renal cell carcinomas and that its re-expression increases anchorage-independent cell death and suppresses tumor growth in nude mice. The role of DLK1 in human pituitary tumor development requires further investigation.
The IG-DMR and the MEG3 promoter may be the positive control elements regulating expression of MEG3 and all its downstream MEGs.16 It has been hypothesized that the maternally expressed genes are derived from one giant transcript initiated from the MEG3 gene. We have previously reported that methylation in both the IG-DMR and the MEG3 promoter was significantly increased in human clinically NFAs.6,7 This increased methylation may, at least in part, contribute to the silencing of MEG3 in these tumors. In agreement with this hypothesis, 12 downstream MEGs (including the large noncoding RNA MEG8, snoRNA SNORD113, and 10 miRNAs) were expressed at similar levels as the MEG3 gene in NFAs. Not all MEGs are expressed in parallel with the MEG3 gene. The MEG miR-770, for example, which is located in an intron of the MEG3 gene, was up-regulated by threefold in NFAs, compared with normal pituitaries, although MEG3 expression was virtually silenced in these tumors. In GH-secreting tumors, 12 miRNAs were up-regulated by more than twofold, compared with normal pituitaries, even though MEG3 expression in these tumors was unchanged. These data suggest that these MEGs are also controlled by gene-specific regulatory elements, independent of the MEG3 gene. For example, Song and Wang50,51 showed that expression of miR-127, miR-134, miR-154, miR-329, miR-337, and miR-433 were increased by 40-, 12-, 38-, 9-, 15-, and 4-fold, respectively, in the orphan nuclear receptor short heterodimer partner (SHP)-null mice, compared with wild-type controls, and have cloned promoters controlling miR-127 and miR-433. We have shown that the IG-DMR and the MEG3 promoter regions were not fully methylated in NFAs, although overall methylation was significantly increased,6,7 suggesting the possibility that the IG-DMR and the MEG3 promoter remain partially active in these tumors. Thus, another possible cause for the varied levels of MEG expression detected in pituitary tumors is post-transcriptional regulation. This may be the case, especially in functioning tumors, in which MEG3 expression was not significantly changed; however, the expression levels for individual MEGs vary significantly compared with normal pituitaries. We note that these two possible mechanisms are not mutually exclusive.
Expression of the DLK1-MEG3 locus was mostly silenced in human NFAs, but not in functioning adenomas. The silenced genes include MEG3 and many of its downstream miRNAs. Our previous studies indicated that MEG3 itself may function as a tumor suppressor. Because MEG3 is required for expression of its downstream maternally expressed genes, it is possible that loss of MEG3 expression is an initiation event in NFA development. However, data from the present study suggest that the maternally expressed miRNAs are capable of tumor suppression. This raises the question of whether loss of MEG3 alone is sufficient to cause NFAs, or whether loss of other MEGs including miRNAs is also required for NFA development. Future studies, particularly using mouse models, are needed to determine the specific role of MEG3 and its downstream genes in pituitary tumor development. Our data are consistent with the hypothesis that silencing of the DLK1-MEG3 locus plays an important role in the development of human NFAs. The tumor suppressor function of this locus in NFAs is at least in part attributed to the anti-proliferation function of several genes within the locus, including MEG3 and MIR134 (miR-134).
Footnotes
Supported by grants from the NIH (R01-DK40947 to A.K.), the Guthart Family Foundation, and the Jarislowsky Foundation.
References
- 1.Lloyd R.V., Kovacs K., Young W.F., Jr, Farrell W.E., Asa S.L., Trouillas J., Kontogeorgos G., Sano T., Scheithauer B.W., Horvath E. Tumours of the pituitary. Pathology and Genetics of Tumours of Endocrine Organs, ed 3. WHO Classification of Tumours 8. In: DeLellis R.A., Lloyd R.V., Heitz P.U., Eng C., editors. IARC Press; Lyon: 2004. pp. 9–39. [Google Scholar]
- 2.Alexander J.M., Biller B.M., Bikkal H., Zervas N.T., Arnold A., Klibanski A. Clinically nonfunctioning pituitary tumors are monoclonal in origin. J Clin Invest. 1990;86:336–340. doi: 10.1172/JCI114705. [DOI] [PMC free article] [PubMed] [Google Scholar]
- 3.Pertuit M., Barlier A., Enjalbert A., Gérard C. Signalling pathway alterations in pituitary adenomas: involvement of Gsalpha, cAMP and mitogen-activated protein kinases. J Neuroendocrinol. 2009;21:869–877. doi: 10.1111/j.1365-2826.2009.01910.x. [DOI] [PubMed] [Google Scholar]
- 4.Simpson D.J., Bicknell J.E., McNicol A.M., Clayton R.N., Farrell W.E. Hypermethylation of the p16/CDKN2A/MTSI gene and loss of protein expression is associated with nonfunctional pituitary adenomas but not somatotrophinomas. Genes Chromosomes Cancer. 1999;24:328–336. [PubMed] [Google Scholar]
- 5.Simpson D.J., Hibberts N.A., McNicol A.M., Clayton R.N., Farrell W.E. Loss of pRb expression in pituitary adenomas is associated with methylation of the RB1 CpG island. Cancer Res. 2000;60:1211–1216. [PubMed] [Google Scholar]
- 6.Gejman R., Batista D.L., Zhong Y., Zhou Y., Zhang X., Swearingen B., Stratakis C.A., Hedley-Whyte E.T., Klibanski A. Selective loss of MEG3 expression and intergenic differentially methylated region hypermethylation in the MEG3/DLK1 locus in human clinically nonfunctioning pituitary adenomas. J Clin Endocrinol Metab. 2008;93:4119–4125. doi: 10.1210/jc.2007-2633. [DOI] [PMC free article] [PubMed] [Google Scholar]
- 7.Zhao J., Dahle D., Zhou Y., Zhang X., Klibanski A. Hypermethylation of the promoter region is associated with the loss of MEG3 gene expression in human pituitary tumors. J Clin Endocrinol Metab. 2005;90:2179–2186. doi: 10.1210/jc.2004-1848. [DOI] [PubMed] [Google Scholar]
- 8.Zhang X., Gejman R., Mahta A., Zhong Y., Rice K.A., Zhou Y., Cheunsuchon P., Louis D.N., Klibanski A. Maternally expressed gene 3, an imprinted noncoding RNA gene, is associated with meningioma pathogenesis and progression. Cancer Res. 2010;70:2350–2358. doi: 10.1158/0008-5472.CAN-09-3885. [DOI] [PMC free article] [PubMed] [Google Scholar]
- 9.Zhang X., Zhou Y., Mehta K.R., Danila D.C., Scolavino S., Johnson S.R., Klibanski A. A pituitary-derived MEG3 isoform functions as a growth suppressor in tumor cells. J Clin Endocrinol Metab. 2003;88:5119–5126. doi: 10.1210/jc.2003-030222. [DOI] [PubMed] [Google Scholar]
- 10.Zhou Y., Zhong Y., Wang Y., Zhang X., Batista D.L., Gejman R., Ansell P.J., Zhao J., Weng C., Klibanski A. Activation of p53 by MEG3 non-coding RNA. J Biol Chem. 2007;282:24731–24742. doi: 10.1074/jbc.M702029200. [DOI] [PubMed] [Google Scholar]
- 11.Gordon F.E., Nutt C.L., Cheunsuchon P., Nakayama Y., Provencher K.A., Rice K.A., Zhou Y., Zhang X., Klibanski A. Increased expression of angiogenic genes in the brains of mouse Meg3-null embryos. Endocrinology. 2010;151:2443–2452. doi: 10.1210/en.2009-1151. [DOI] [PMC free article] [PubMed] [Google Scholar]
- 12.Zhou Y., Cheunsuchon P., Nakayama Y., Lawlor M.W., Zhong Y., Rice K.A., Zhang L., Zhang X., Gordon F.E., Lidov H.G., Bronson R.T., Klibanski A. Activation of paternally expressed genes and perinatal death caused by deletion of the Gtl2 gene. Development. 2010;137:2643–2652. doi: 10.1242/dev.045724. [DOI] [PMC free article] [PubMed] [Google Scholar]
- 13.Royo H., Cavaillé J. Non-coding RNAs in imprinted gene clusters. Biol Cell. 2008;100:149–166. doi: 10.1042/BC20070126. [DOI] [PubMed] [Google Scholar]
- 14.Kircher M., Bock C., Paulsen M. Structural conservation versus functional divergence of maternally expressed microRNAs in the Dlk1/Gtl2 imprinting region. BMC Genomics. 2008;9:346. doi: 10.1186/1471-2164-9-346. [DOI] [PMC free article] [PubMed] [Google Scholar]
- 15.Seitz H., Royo H., Bortolin M.L., Lin S.P., Ferguson-Smith A.C., Cavaille J. A large imprinted microRNA gene cluster at the mouse DLK1-Gtl2 domain. Genome Res. 2004;14:1741–1748. doi: 10.1101/gr.2743304. [DOI] [PMC free article] [PubMed] [Google Scholar]
- 16.Lin S.P., Youngson N., Takada S., Seitz H., Reik W., Paulsen M., Cavaille J., Ferguson-Smith A.C. Asymmetric regulation of imprinting on the maternal and paternal chromosomes at the DLK1-Gtl2 imprinted cluster on mouse chromosome 12. Nat Genet. 2003;35:97–102. doi: 10.1038/ng1233. [DOI] [PubMed] [Google Scholar]
- 17.Murphy S.K., Wylie A.A., Coveler K.J., Cotter P.D., Papenhausen P.R., Sutton V.R., Shaffer L.G., Jirtle R.L. Epigenetic detection of human chromosome 14 uniparental disomy. Hum Mutat. 2003;22:92–97. doi: 10.1002/humu.10237. [DOI] [PubMed] [Google Scholar]
- 18.Ogata T., Kagami M., Ferguson-Smith A.C. Molecular mechanisms regulating phenotypic outcome in paternal and maternal uniparental disomy for chromosome 14. Epigenetics. 2008;3:181–187. doi: 10.4161/epi.3.4.6550. [DOI] [PubMed] [Google Scholar]
- 19.da Rocha S.T., Edwards C.A., Ito M., Ogata T., Ferguson-Smith A.C. Genomic imprinting at the mammalian Dlk1-Dio3 domain. Trends Genet. 2008;24:306–316. doi: 10.1016/j.tig.2008.03.011. [DOI] [PubMed] [Google Scholar]
- 20.Astuti D., Latif F., Wagner K., Gentle D., Cooper W.N., Catchpoole D., Grundy R., Ferguson-Smith A.C., Maher E.R. Epigenetic alteration at the DLK1-GTL2 imprinted domain in human neoplasia: analysis of neuroblastoma, phaeochromocytoma and Wilms' tumour. Br J Cancer. 2005;92:1574–1580. doi: 10.1038/sj.bjc.6602478. [DOI] [PMC free article] [PubMed] [Google Scholar]
- 21.Kawakami T., Chano T., Minami K., Okabe H., Okada Y., Okamoto K. Imprinted DLK1 is a putative tumor suppressor gene and inactivated by epimutation at the region upstream of GTL2 in human renal cell carcinoma. Hum Mol Genet. 2006;15:821–830. doi: 10.1093/hmg/ddl001. [DOI] [PubMed] [Google Scholar]
- 22.Kiss-László Z., Henry Y., Bachellerie J.P., Caizergues-Ferrer M., Kiss T. Site-specific ribose methylation of preribosomal RNA: a novel function for small nucleolar RNAs. Cell. 1996;85:1077–1088. doi: 10.1016/s0092-8674(00)81308-2. [DOI] [PubMed] [Google Scholar]
- 23.Poliseno L., Salmena L., Zhang J., Carver B., Haveman W.J., Pandolfi P.P. A coding-independent function of gene and pseudogene mRNAs regulates tumour biology. Nature. 2010;465:1033–1038. doi: 10.1038/nature09144. [DOI] [PMC free article] [PubMed] [Google Scholar]
- 24.Mees S.T., Mardin W.A., Wendel C., Baeumer N., Willscher E., Senninger N., Schleicher C., Colombo-Benkmann M., Haier J. EP300–A miRNA-regulated metastasis suppressor gene in ductal adenocarcinomas of the pancreas. Int J Cancer. 2010;126:114–124. doi: 10.1002/ijc.24695. [DOI] [PubMed] [Google Scholar]
- 25.Amaral F.C., Torres N., Saggioro F., Neder L., Machado H.R., Silva W.A., Jr, Moreira A.C., Castro M. MicroRNAs differentially expressed in ACTH-secreting pituitary tumors. J Clin Endocrinol Metab. 2009;94:320–323. doi: 10.1210/jc.2008-1451. [DOI] [PubMed] [Google Scholar]
- 26.Schuster C., Budczies J., Faber C., Kirchner T., Hlubek F. MicroRNA expression profiling of specific cells in complex archival tissue stained by immunohistochemistry. Lab Invest. 2011;91:157–165. doi: 10.1038/labinvest.2010.134. [DOI] [PubMed] [Google Scholar]
- 27.Pallasch C.P., Patz M., Park Y.J., Hagist S., Eggle D., Claus R., Debey-Pascher S., Schulz A., Frenzel L.P., Claasen J., Kutsch N., Krause G., Mayr C., Rosenwald A., Plass C., Schultze J.L., Hallek M., Wendtner C.M. miRNA deregulation by epigenetic silencing disrupts suppression of the oncogene PLAG1 in chronic lymphocytic leukemia. Blood. 2009;114:3255–3264. doi: 10.1182/blood-2009-06-229898. [DOI] [PMC free article] [PubMed] [Google Scholar]
- 28.Schmittgen T.D., Livak K.J. Analyzing real-time PCR data by the comparative C(T) method. Nat Protoc. 2008;3:1101–1108. doi: 10.1038/nprot.2008.73. [DOI] [PubMed] [Google Scholar]
- 29.Danila D.C., Zhang X., Zhou Y., Dickersin G.R., Fletcher J.A., Hedley-Whyte E.T., Selig M.K., Johnson S.R., Klibanski A. A human pituitary tumor-derived folliculostellate cell line. J Clin Endocrinol Metab. 2000;85:1180–1187. doi: 10.1210/jcem.85.3.6424. [DOI] [PubMed] [Google Scholar]
- 30.Calin G.A., Cimmino A., Fabbri M., Ferracin M., Wojcik S.E., Shimizu M., Taccioli C., Zanesi N., Garzon R., Aqeilan R.I., Alder H., Volinia S., Rassenti L., Liu X., Liu C.G., Kipps T.J., Negrini M., Croce C.M. MiR-15a and miR-16-1 cluster functions in human leukemia. Proc Natl Acad Sci USA. 2008;105:5166–5171. doi: 10.1073/pnas.0800121105. [DOI] [PMC free article] [PubMed] [Google Scholar]
- 31.Cimmino A., Calin G.A., Fabbri M., Iorio M.V., Ferracin M., Shimizu M., Wojcik S.E., Aqeilan R.I., Zupo S., Dono M., Rassenti L., Alder H., Volinia S., Liu C.G., Kipps T.J., Negrini M., Croce C.M. miR-15 and miR-16 induce apoptosis by targeting BCL2. Proc Natl Acad Sci USA. 2005;102:13944–13949. doi: 10.1073/pnas.0506654102. [Erratum appeared in Proc Natl Acad Sci U S A 2006, 103:2464] [DOI] [PMC free article] [PubMed] [Google Scholar]
- 32.Volinia S., Calin G.A., Liu C.G., Ambs S., Cimmino A., Petrocca F., Visone R., Iorio M., Roldo C., Ferracin M., Prueitt R.L., Yanaihara N., Lanza G., Scarpa A., Vecchione A., Negrini M., Harris C.C., Croce C.M. A microRNA expression signature of human solid tumors defines cancer gene targets. Proc Natl Acad Sci USA. 2006;103:2257–2261. doi: 10.1073/pnas.0510565103. [DOI] [PMC free article] [PubMed] [Google Scholar]
- 33.Calin G.A., Ferracin M., Cimmino A., Di Leva G., Shimizu M., Wojcik S.E., Iorio M.V., Visone R., Sever N.I., Fabbri M., Iuliano R., Palumbo T., Pichiorri F., Roldo C., Garzon R., Sevignani C., Rassenti L., Alder H., Volinia S., Liu C.G., Kipps T.J., Negrini M., Croce C.M. A MicroRNA signature associated with prognosis and progression in chronic lymphocytic leukemia. N Engl J Med. 2005;353:1793–1801. doi: 10.1056/NEJMoa050995. [Erratum appeared in N Engl J Med 2006, 355:533] [DOI] [PubMed] [Google Scholar]
- 34.Garzon R., Volinia S., Liu C.G., Fernandez-Cymering C., Palumbo T., Pichiorri F., Fabbri M., Coombes K., Alder H., Nakamura T., Flomenberg N., Marcucci G., Calin G.A., Kornblau S.M., Kantarjian H., Bloomfield C.D., Andreeff M., Croce C.M. MicroRNA signatures associated with cytogenetics and prognosis in acute myeloid leukemia. Blood. 2008;111:3183–3189. doi: 10.1182/blood-2007-07-098749. [DOI] [PMC free article] [PubMed] [Google Scholar]
- 35.Frankel L.B., Christoffersen N.R., Jacobsen A., Lindow M., Krogh A., Lund A.H. Programmed cell death 4 (PDCD4) is an important functional target of the microRNA miR-21 in breast cancer cells. J Biol Chem. 2008;283:1026–1033. doi: 10.1074/jbc.M707224200. [DOI] [PubMed] [Google Scholar]
- 36.Meng F., Henson R., Wehbe-Janek H., Ghoshal K., Jacob S.T., Patel T. MicroRNA-21 regulates expression of the PTEN tumor suppressor gene in human hepatocellular cancer. Gastroenterology. 2007;133:647–658. doi: 10.1053/j.gastro.2007.05.022. [DOI] [PMC free article] [PubMed] [Google Scholar]
- 37.Zhu S., Si M.L., Wu H., Mo Y.Y. MicroRNA-21 targets the tumor suppressor gene tropomyosin 1 (TPM1) J Biol Chem. 2007;282:14328–14336. doi: 10.1074/jbc.M611393200. [DOI] [PubMed] [Google Scholar]
- 38.Stilling G., Sun Z., Zhang S., Jin L., Righi A., Kovacs G., Korbonits M., Scheithauer B.W., Kovacs K., Lloyd R.V. MicroRNA expression in ACTH-producing pituitary tumors: up-regulation of microRNA-122 and -493 in pituitary carcinomas. Endocrine. 2010;38:67–75. doi: 10.1007/s12020-010-9346-0. [DOI] [PubMed] [Google Scholar]
- 39.Bottoni A., Piccin D., Tagliati F., Luchin A., Zatelli M.C., degli Uberti E.C. miR-15a and miR-16-1 down-regulation in pituitary adenomas. J Cell Physiol. 2005;204:280–285. doi: 10.1002/jcp.20282. [DOI] [PubMed] [Google Scholar]
- 40.Guo L., Liu Y., Bai Y., Sun Y., Xiao F., Guo Y. Gene expression profiling of drug-resistant small cell lung cancer cells by combining microRNA and cDNA expression analysis. Eur J Cancer. 2010;46:1692–1702. doi: 10.1016/j.ejca.2010.02.043. [DOI] [PubMed] [Google Scholar]
- 41.Maes O.C., Sarojini H., Wang E. Stepwise up-regulation of microRNA expression levels from replicating to reversible and irreversible growth arrest states in WI-38 human fibroblasts. J Cell Physiol. 2009;221:109–119. doi: 10.1002/jcp.21834. [DOI] [PubMed] [Google Scholar]
- 42.Wagner W., Horn P., Castoldi M., Diehlmann A., Bork S., Saffrich R., Benes V., Blake J., Pfister S., Eckstein V., Ho A.D. Replicative senescence of mesenchymal stem cells: a continuous and organized process. PLoS One. 2008;3:e2213. doi: 10.1371/journal.pone.0002213. [DOI] [PMC free article] [PubMed] [Google Scholar]
- 43.Luo H., Zhang H., Zhang Z., Zhang X., Ning B., Guo J., Nie N., Liu B., Wu X. Down-regulated miR-9 and miR-433 in human gastric carcinoma. J Exp Clin Cancer Res. 2009;28:82. doi: 10.1186/1756-9966-28-82. [DOI] [PMC free article] [PubMed] [Google Scholar]
- 44.Tari A.M., Lopez-Berestein G. GRB2: a pivotal protein in signal transduction. Semin Oncol. 2001;28:142–147. doi: 10.1016/s0093-7754(01)90291-x. [DOI] [PubMed] [Google Scholar]
- 45.Smas C.M., Sul H.S. Pref-1, a protein containing EGF-like repeats, inhibits adipocyte differentiation. Cell. 1993;73:725–734. doi: 10.1016/0092-8674(93)90252-l. [DOI] [PubMed] [Google Scholar]
- 46.Yin D., Xie D., Sakajiri S., Miller C.W., Zhu H., Popoviciu M.L., Said J.W., Black K.L., Koeffler H.P. DLK1: increased expression in gliomas and associated with oncogenic activities. Oncogene. 2006;25:1852–1861. doi: 10.1038/sj.onc.1209219. [DOI] [PubMed] [Google Scholar]
- 47.Espina A.G., Méndez-Vidal C., Moreno-Mateos M.A., Sáez C., Romero-Franco A., Japón M.A., Pintor-Toro J.A. Induction of Dlk1 by PTTG1 inhibits adipocyte differentiation and correlates with malignant transformation. Mol Biol Cell. 2009;20:3353–3362. doi: 10.1091/mbc.E08-09-0965. [DOI] [PMC free article] [PubMed] [Google Scholar]
- 48.Kim Y., Lin Q., Zelterman D., Yun Z. Hypoxia-regulated delta-like 1 homologue enhances cancer cell stemness and tumorigenicity. Cancer Res. 2009;69:9271–9280. doi: 10.1158/0008-5472.CAN-09-1605. [DOI] [PMC free article] [PubMed] [Google Scholar]
- 49.Li L., Forman S.J., Bhatia R. Expression of DLK1 in hematopoietic cells results in inhibition of differentiation and proliferation. Oncogene. 2005;24:4472–4476. doi: 10.1038/sj.onc.1208637. [DOI] [PubMed] [Google Scholar]
- 50.Song G., Wang L. MiR-433 and miR-127 arise from independent overlapping primary transcripts encoded by the miR-433-127 locus. PLoS One. 2008;3:e3574. doi: 10.1371/journal.pone.0003574. [DOI] [PMC free article] [PubMed] [Google Scholar]
- 51.Song G., Wang L. Transcriptional mechanism for the paired miR-433 and miR-127 genes by nuclear receptors SHP and ERRgamma. Nucleic Acids Res. 2008;36:5727–5735. doi: 10.1093/nar/gkn567. [DOI] [PMC free article] [PubMed] [Google Scholar]