

Abstract
Alzheimer's disease (AD) is a progressive neurodegenerative disorder characterized by severe memory loss and cognitive impairment. Neuroinflammation, including the extensive production of pro-inflammatory molecules and the activation of microglia, has been implicated in the disease process. Tumor necrosis factor (TNF)-α, a prototypic pro-inflammatory cytokine, is elevated in AD, is neurotoxic, and colocalizes with amyloid plaques in AD animal models and human brains. We previously demonstrated that the expression of TNF-α is increased in AD mice at ages preceding the development of hallmark amyloid and tau pathological features and that long-term expression of this cytokine in these mice leads to marked neuronal death. Such observations suggest that TNF-α signaling promotes AD pathogenesis and that therapeutics suppressing this cytokine's activity may be beneficial. To dissect TNF-α receptor signaling requirements in AD, we generated triple-transgenic AD mice (3xTg-AD) lacking both TNF-α receptor 1 (TNF-RI) and 2 (TNF-RII), 3xTg-ADxTNF-RI/RII knock out, the cognate receptors of TNF-α. These mice exhibit enhanced amyloid and tau-related pathological features by the age of 15 months, in stark contrast to age-matched 3xTg-AD counterparts. Moreover, 3xTg-ADxTNF-RI/RII knock out–derived primary microglia reveal reduced amyloid-β phagocytic marker expression and phagocytosis activity, indicating that intact TNF-α receptor signaling is critical for microglial-mediated uptake of extracellular amyloid-β peptide pools. Overall, our results demonstrate that globally ablated TNF receptor signaling exacerbates pathogenesis and argues against long-term use of pan-anti-TNF-α inhibitors for the treatment of AD.
The inflammatory responses associated with Alzheimer's disease (AD) and their contributions to the course of the disease and resultant neurodegeneration are becoming better appreciated.1 In contrast to normal brains, in which microglia and astrocytes are relatively quiescent and evenly distributed, in the AD brain, activated microglia and astrocytes cluster in close proximity, with extracellular plaques and neurons harboring intraneuronal tangles.2 Although the mechanisms underlying synapse loss and eventual neuronal death have yet to be completely elucidated, it is clearly evident that inflammatory molecules and cytokines found at enhanced levels during various stages of the disease play distinct and influential roles throughout AD pathophysiology.3–7 Tumor necrosis factor (TNF)-α is a pleiotropic pro-inflammatory cytokine elevated in the serum of patients with AD8 and is proximal to amyloid plaques on autopsy.9 Enhanced levels of TNF-α appear to be reflective of disease severity10 and have been implicated in neurotoxicity.11–14 Our laboratory previously demonstrated a pre-pathological up-regulation of TNF-α and correlating enhancement of F4/80-positive microglia/macrophage numbers in the 6-month-old triple-transgenic AD (3xTg-AD) mouse model that exhibits an age-related development of amyloid and tau pathological features and deficits in synaptic plasticity, including hippocampal long-term potentiation (LTP), reminiscent of human AD.15,16 McAlpine et al17 recently reported that viral vector-mediated expression of truncated TNF receptor in lipopolysaccharide-infused 3xTg-AD mice suppresses AD-related amyloid pathological features in the short-term. In further support of a potential contributory role of TNF-α to AD pathogenesis, long-term TNF-α overexpression via viral vector-based gene transfer leads to enhanced inflammation and marked neuronal cell death in this mouse model of AD.18
TNF-α belongs to the TNF superfamily of ligands and promotes inflammatory signaling by coordinating innate responses. Both biologically active transmembrane TNF-α and soluble TNF-α are produced by microglia, astrocytes, and specific subpopulations of neurons.19–21 TNF-α signals through two distinct membrane glycoprotein receptors: TNF-α receptor 1 (TNF-RI) and 2 (TNF-RII). Most cell types express TNF-RI, and either soluble TNF-α or transmembrane TNF-α is able to initiate signaling through this cognate receptor, whereas TNF-RII is primarily engaged by transmembrane TNF-α and is expressed by microglia and endothelial cells.22 Signaling via the cognate TNF-α receptors elicits a complex variety of downstream responses, including cell proliferation, cell migration, and apoptosis mediated through the NF-κB, p38, c-jun N-terminal kinase, and ceramide-sphingomyelinase pathways.23–25
Because of the presence of excessive TNF-α in patients with AD and the profound effects that are engendered by modulating this cytokine's expression level/activity in the setting of experimental models of AD, it is not surprising that clinical testing of TNF-α inhibition strategies has intensified in recent years. Protein-related TNF-α inhibitors that modulate circulating TNF-α levels, such as etanercept and infliximab, have shown limited promise in altering the course of AD, because of their inability to efficiently traverse the blood-brain barrier.26 A prospective open-label pilot study27 was conducted on 15 patients with AD who were administered perispinal etanercept, a potent TNF-α antagonist, semiweekly; these patients claimed cognitive improvements in three independent tests, whereas untreated patients exhibited progressive cognitive decline. Such findings are promising, yet they undoubtedly spur debate regarding the safety and efficacy of TNF-α inhibition over the lifetime of an AD-afflicted individual.
To better understand the effect of TNF-α signaling ablation during a protracted period in the context of progressive AD-related pathogenesis, we generated 3xTg-AD mice devoid of cognate TNF-RI and TNF-RII (3xTg-ADxTNF-RI/RII knock out [KO]). Herein, we demonstrate that 3xTg-ADxTNF-RI/RII KO mice exhibit higher amyloid and tau-related pathological burden at the age of 15 months than age-matched 3xTg-AD mice. Moreover, microglia in 3xTg-ADxTNF-RI/RII KO mice appear nonresponsive to ongoing development of AD pathological features in vivo and exhibit reduced amyloid-β (Aβ)42 phagocytosis activity in vitro. In aggregate, these data imply that long-term inhibition of TNF-α in the central nervous system without consideration of cell type–specific requirements for intact TNF-α signaling may result in dire consequences by accelerating AD-related pathological features and may ultimately lead to enhanced neurodegeneration.
Materials and Methods
Transgenic Mice
Triple-transgenic AD (3xTg-AD) B1 line and non-transgenic (Non-Tg) mice were previously generated.15,28 The TNF-RI/RII KO mice were previously described.29 At the time of mouse crossing for this study, the C57BL/6 genetic background was the predominant background for our 3xTg-AD colony (six backcrosses), with the TNF-RI/RII line being completely on the C57BL/6 genetic background. A monogamous mating strategy was used to generate 3xTg-ADxTNF-RI/RII KO mice by crossing the 3xTg-AD and TNF-RI/RII KO mice until all genes were homozygous. Briefly, in the parental (P) generation, 3xTg-AD mice and C57BL/6 TNF-RI/RII knockout mice generated (F1) offspring composed of heterozygous 3xTg-AD and TNF-α- receptor genes [3xTg-AD+/− (TNF-RI+/−) TNF-RII+/−]. The F1 generation mice were backcrossed with 3xTg-AD mice to yield homozygous PS1, APPswe, and taup301L genes, resulting in an F2 generation designated as 3xTg-AD+/+ (TNF-RI+/−) TNF-RII+/−. Mice harboring homozygous 3xTg-AD and TNF-RI genes were generated by crossing F2 generation mice with each other to yield F3 mice [3xTg-AD+/+ (TNF-RI−/−) TNF-RII+/−]. Subsequently, F3 generation mice were crossed to generate mice homozygous for the 3xTg-AD, TNF-RI, and TNF-RII genes (Figure 1A). 3xTg-AD and 3xTg-ADxTNF-RI/RII KO mice were monogamously mated to produce offspring, which were housed until sacrificed at the indicated points. Age-matched 2-, 3-, 6-, 9-, 12-, and 15-month-old male mice were used in the immunohistochemical (IHC)/semiquantitative studies (n = 3 to 7 per experimental group). P1 pups were used to establish primary microglial cultures for phagocytosis analyses (N = 8 per genotype). For IHC analyses, mice were euthanized with an overdose of pentobarbital, followed by transcardiac perfusion with heparinized saline, then by 4% paraformaldehyde in 0.1 mol/L phosphate buffer (PB). Brains were extracted and postfixed overnight in 4% paraformaldehyde in 0.1 mol/L PB, then equilibrated with 20% sucrose in 0.1 mol/L PBS and transferred into 30% sucrose in 0.1 mol/L PBS. Brains were coronally divided into sections (30-μm thick) on a freezing stage-sliding microtome (Microtome, Walldorf, Germany) and stored at −20°C in cryoprotectant until use for IHC analysis. All mice were housed and bred in accordance with the University of Rochester (Rochester, NY) requirements for animal welfare and care. Mice were on a 12-hour light-dark cycle and were allowed food and water ad libitum.
Figure 1.
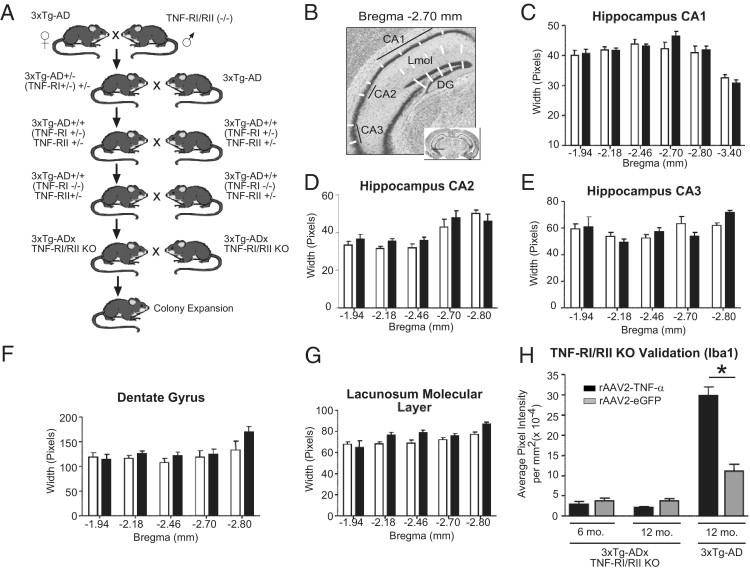
Generation and verification of 3xTg-ADxTNF-RI/RII KO transgenic mice. A: A schematic representation of the breeding strategy between 3xTg-AD and C57BL/6 double TNF-RI/RII knockout mice that yielded 3xTg-ADxTNF-RI/RII KO mice. The gross neuroanatomical structure of 2-month-old 3xTg-AD (white bars) and 3xTg-ADxTNF-RI/RII KO (black bars) mice was assessed by Nissl IHC (B) and measuring the width of the CA1 (C), CA2 (D), and CA3 (E) layers, the DG (F), and the lacunosum molecular layer (G) of the hippocampal formation. Two-way analysis of variance with the Bonferroni's posttest was used to assess statistical significance (N = 3 to 7). H: Iba1-positive microglia of 12-month-old 3xTg-AD and 6- and 12-month-old 3xTg-ADxTNF-RI/RII KO mice after long-term overexpression of AAV2–TNF-α and AAV2-eGFP. Statistical analyses were performed using a one-way analysis of variance and Bonferroni's posttest between AAV2–TNF-α and AAV2-eGFP infused mice for each genotype. *P < 0.001. N = 3 to 4. Error bars represent SEM.
Genotyping
Genotyping of transgenic mice was conducted via conventional PCR using mouse genomic DNA extracted from tail biopsy specimens. PCR was performed in 25-μL reaction mixtures, each containing 100 ng/μL genomic DNA, 20 μmol/L of each primer, 10 mmol/L deoxyribonucleotide triphosphate mixture, 2.5 μL of 10× Taq buffer, and 0.3 μL of Taq polymerase (Promega, Madison, WI). The primers specific for the APP transgene amplification used were as follows: 5′-GCTTGCACCAGTTCTGGATGG-3′ (forward) and 5′-GAGGTATTCAGTCATGTGCT-3′ (reverse). The following conditions were used: 5 minutes at 94°C; 30 seconds at 94°C, 30 seconds at 53°C, and 1 minute at 72°C for 20 cycles; and then 1 minute at 72°C using a MyCyclerThermal Cycler (BioRad, Hercules, CA). The tau-specific primers used were as follows: 5′-GAGGTATTCAGTCATGTGCT-3′ (forward) and 5′-TTCAAAGTTCACCTGATAGT-3′ (reverse). The following conditions were used: 94°C for 5 minutes; 94°C for 30 seconds, 52°C for 30 seconds, and 72°C for 1 minute for 25 cycles; and then 72°C for 3 minutes using the MyCyclerThermal Cycler. For PS1, the PCR was doubled with forward primer, 5′-CACACGCAACTCTGACATGCACAGGC-3′, and reverse primer, 5′-AGGCAGGAAGATCACGTGTTCAAGTAC-3′, at 94°C for 2.5 minutes; 94°C for 40 seconds, 62°C for 40 seconds, and 72°C for 1 minute for 35 cycles; and then 72°C for 3 minutes using an Eppendorf Mastercycler Gradient system (Eppendorf, Hauppauge, NY). Subsequently, half of the PCR product was digested with BstEII at 60°C for 1 hour because the primers also amplify the endogenous PS1 gene. Two bands, 300 and 250 bp, indicated homozygous mice. TNF-RI amplification was performed using three primers with the following oligonucleotide sequences: 5′-TGTGAAAAGGGCACCTTTACGGC-3′, 5′-GGCTGCAGTCCACGCACTGG-3′, and 5′-ATTCGCCAATGACAAGACGCTGG-3′. The amplification conditions used were as follows: 94°C for 3 minutes; 94°C for 20 seconds, 64°C for 30 seconds with −0.5°C per cycle, and 72°C for 35 seconds for 12 cycles; 94°C for 20 seconds, 58°C for 30 seconds, and 72°C for 35 seconds for 25 cycles; and then 72°C for 2 minutes using a MyCyclerThermal Cycler to amplify a 300-bp band for homozygous mice. Similarly, TNF-RII cDNA was amplified using the following primer sequences: 5′-CCTCTCATGCTGTCCCGGAAT-3′, 5′-AGCTCCAGGCACAAGGGCGGG-3′, 5′-GCCCTGAATGAACTGCAGGACG-3′, and 5′-CACGGGTAGCCAACGCTATGTC-3′. The conditions were as follows: 94°C for 3 minutes; 94°C for 1 minute, 62°C for 1 minute, and 72°C for 1 minute for 32 cycles; and then 72°C for 10 minutes using MyCyclerThermal Cycler. Homozygous mice were indicated by a 400-bp amplification product. PCR products were separated electophoretically on 0.5% agarose gels and visualized via ethidium bromide.
Nissl Staining
Brain sections were washed with 0.15 mol/L PB for 2 hours to remove cryoprotectant, subsequently mounted on SuperFrost Plus slides (VWR International, West Chester, PA), and allowed to dry. The slides were hydrated in dH-2O for 5 minutes before staining with 0.02% Cresyl violet acetate in 0.25% acetic acid for 30 minutes. To destain, sections were rinsed in three changes of dH-2O, then placed in 50% ethanol for 1 minute, followed by 70% ethanol for 1 minute. Sections were then completely dried, dipped in xylene, and coverslipped. Sections were analyzed via the MCID 6.0 ELITE Imaging Software Program (Interfocus Imaging, Cambridge, UK) using the length tool to measure (in pixels) five regions of the hippocampus, including the Cornu Ammonis (CA)1, CA2, CA3, dentate gyrus (DG), and lacunosum molecular layer under ×40 magnification. Measurements were taken at specific bregma positions, and 4–51 values were used per bregma position per anatomical region. Identical measurements were performed for a particular bregma position and brain region between 3xTg-AD and 3xTg-ADxTNF-RI/RII KO mice. Measurements were analyzed with a two-way analysis of variance and a Bonferroni's multiple comparisons posttest (N = 3 to 7 per genotype per time point).
Stereotactic Infusion of rAAV2–TNF-α and rAAV2-eGFP
3xTg-AD and 3xTg-ADxTNF-RI/RII KO mice at the age of 2 months were stereotactically infused with 2 μL (3 × 10⁹ transducing units) of recombinant adeno-associated virus serotype-2 (rAAV2)–TNF-α and rAAV2–enhanced green fluorescence protein (eGFP), as previously described.18
Antibodies
The following antibodies were used to IHC stain 3xTg-AD and 3xTg-AD × TNF-RI/RII KO brain sections at the indicated dilutions: microglia/macrophage-specific cell marker [anti-ionized calcium-binding adaptor molecule 1 (Iba1), rabbit polyclonal, 1:750; Wako, Richmond, VA]; astrocyte-specific cell marker [polyclonal rabbit anti-glial fibrillary acidic protein (GFAP), 1:1000; Dako, Richmond, VA]; anti-Aβ 1–42 clone 12F4 reactive to the C-terminus of β-amyloid and specific for the isoform ending at amino acid 42 (1:1000; Signet Labs, Berkeley, CA); anti-human phosphorylated-tau monoclonal AT-180 specific human tau recognizing doubly phosphorylated Thr231 and Ser235 residues (1:500; Pierce, Rockford, IL); anti-human tau HT7, specific to residues 159 to 163 (1:200; Pierce); anti-amyloid precursor protein A4, corresponding to the NPXY motif of hAPP (Clone Y188, 1:750; AbCam, Cambridge, MA); paired helical filament (PHF)-1 recognizing singly or doubly phosphorylated tau at Ser396 or Ser404 residues (1:30; provided by Dr. Peter Davies, Albert Einstein College of Medicine, Bronx, NY); and anti-human tau HT7, reactive to residues 159 to 163 (1:200; Pierce).
LTP Studies
To characterize basal synaptic transmission and function, electrophysiological procedures were performed on 6- to 7-month-old 3xTg-AD, 3xTg-AD × TNF-RI/RII KO, and Non-Tg mice under deep urethane anesthesia (1.5 g/kg i.p., administered in one dose and supplemented with 0.1 to 0.2 g/kg as required before the onset of data collection). All mice were placed in a stereotaxic apparatus, and body temperature was maintained between 36°C and 37°C by using an electrical heating blanket. An incision was made to expose the skull surface, and small skull holes were drilled above the CA3 region (anterior-posterior [AP], -2.20; medial-lateral [ML], -2.5; ventral-dorsal [VD], -2.3 to −2.5 mm) and the contralateral CA1 area (AP, -2.20; ML, 1.50; VD, -1.6 mm). Skull holes for ground and reference electrodes (jewelry screws attached to miniature connectors) were made in the bone overlying the prefrontal cortex and cerebellum, respectively. All stereotaxic measurements were based on the anatomical work of Paxinos and Franklin.30 Final ventral placements of the CA3 stimulation and the CA1 recording electrodes were adjusted to elicit the maximal amplitude of field excitatory post-synaptic potentials (fEPSPs) and paired-pulse facilitation (100-millisecond interstimulus interval) in area CA1 in response to contralateral CA3 stimulation.
Stimulation of CA3 (0.2-millisecond pulses every 30 seconds, intensity adjusted to yield 50% to 60% of maximal fEPSP amplitude) was provided by a concentric bipolar electrode (Rhodes Medical Instruments Series 100; David Kopf, Tujunga, CA) connected to a stimulus isolation unit providing a constant current output (PowerLab/16-second system with ML 180 Stimulus Isolator; AD Instruments, Toronto, ON, Canada). All fEPSPs in stratum radiatum of CA1 were differentially recorded (Teflon-insulated stainless steel wire, 125-μm tip diameter) against a reference electrode placed in the bone overlaying the cerebellum. The CA1 signals were amplified, filtered (0.3 to 1 kHz), digitized (10 kHz), and stored for subsequent off-line analysis using PowerLab system running Scope software, version 4.0.2 (AD Instruments, Toronto, Canada). Before formal data collection, input-output curves were established for each animal by recording fEPSPs in CA1 in response to CA3 stimulation between 0 and 400 μA (50-μA increments). Based on these input-output curves, a stimulation intensity eliciting between 50% and 60% of the maximal fEPSP amplitude was chosen for the subsequent experiment.
For each mouse, 60 initial baseline fEPSPs (every 30 seconds) were recorded. After stable baseline recordings, all animals received a burst of high-frequency stimulation (HFS) to the CA3 area (100 pulses at 100 Hz). Recordings of fEPSPs in CA1 (every 30 seconds, as in baseline) in response to single-pulse CA3 stimulation continued for 1 hour after the HFS episode.
At the end of each experiment, mice were intracardially perfused with 10% paraformaldehyde, their brains were extracted, and standard histological techniques were used to verify all electrode placements. Data obtained with inaccurate placements were excluded from the data analysis. All electrophysiological data are expressed as mean ± SEM. The maximal fEPSP amplitude was analyzed offline by the Scope software. Subsequently, amplitude data were averaged over 10-minute intervals, and these averages were normalized by dividing all data for each mouse by the average baseline (pre-HFS) amplitude of that animal. All LTP data were analyzed using analyses of variance and, where statistically appropriate, simple effects and Tukey's post hoc tests, all of which were computed using GraphPad Prism software (GraphPad, La Jolla, CA).
IHC Analyses of Fixed Tissue
Brain sections were washed with 0.15 mol/L PB to remove cryoprotectant, followed by a 20-minute incubation with 3% H2O2 in 0.15 mol/L PB to quench endogenous peroxidase activity. Epitope retrieval was used for Aβ peptide-specific stains using 70% formic acid for 15 minutes. IHC processing was performed as previously described.31 Slides were visualized, and staining intensities were quantified. Statistics for the IHC experiments were performed using a two-way analysis of variance and a Bonferroni's multiple comparison test via GraphPad Prism software.
Microscopic and Stereological Assessments
By using an Olympus AX-70 microscope equipped with a motorized stage (Olympus, Center Valley, PA) and MCID 6.0 ELITE Imaging Software Program (Interfocus Imaging subsidiary of GE Healthcare, Cambridge, England), the hippocampal CA1 region of immunohistologically stained sections was quantified under ×20 magnification in a blinded fashion. Each image represented one-twelfth of the total hippocampus. Ten to fifty images per mouse were analyzed and averaged for statistical analysis. N = 3 to 7 was used per time point per genotype.
Imaging and Image Processing
Photomicrographic images were processed consistently where brightness and contrast alterations were applied identically over all images within an experimental data set using Photoshop CS3 (Adobe Systems, Inc., San Jose, CA). No other image processing changes were applied.
Primary Microglial Cultures
Microglia were derived from 3xTg-AD or 3xTg-ADxTNF-RI/RII KO postnatal day 1 (P1) pups. Cerebral cortexes were isolated, and meninges were removed and minced in Hanks' balanced salt solution (HBSS; Invitrogen, Frederick, MD). Cells were dissociated by trituration in minimum essential media (Invitrogen, Frederick) containing Earle's salts, l-glutamine, 0.01% pyruvate, 0.6% glucose, 4% fetal bovine serum, and 6% horse serum (complete medium); centrifuged; and plated into 75-cm2 tissue culture flasks containing 10 mL of complete media. Cultures were grown at 37°C under 6% CO2. The next day, 8 mL of complete media was added to the cultures. At approximately 14 days, cultures were harvested by collecting all media and washing with warm PBS, followed by incubation with 1 mmol/L EDTA at 37°C. Microglia were pelleted by centrifugation (170 × g at 5 minutes); resuspended in minimum essential media with Earle's salts, l-glutamine, 0.01% pyruvate, 0.6% glucose, and 5% fetal bovine serum; and enumerated.
Immunocytochemical Analyses of Microglial Culture Cell Composition
Primary microglial culture composition was characterized via immunocytochemistry. After enumeration, primary microglia were plated in 24-well plates on glass coverslips (VWR International) at a density of 4 × 10⁴ cells per well. Cells were incubated for 24 hours and then fixed with 4% paraformaldehyde for 20 minutes at room temperature. Cells were permeabilized with Tris-buffered saline (TBS) and 0.1% Triton X-100, followed by blocking in TBS with 10% normal goat serum for 1 hour at room temperature. Immunostaining was performed with an Iba1 microglial/macrophage-specific primary antibody (anti-Iba1, rabbit polyclonal, 1:1000; Wako) and a pre-conjugated anti-GFAP-Cy3 to detect astrocytes (1:1000; Sigma-Aldrich, St Louis, MO). Primary antibodies were diluted with TBS and 5% normal goat serum and incubated overnight at 4°C. Cells were washed and incubated for 2 hours at room temperature with a goat anti-rabbit 488 secondary antibody (1:2000; Invitrogen, Carlsbad, CA) to detect Iba1-stained cells. TBS, followed by distilled H2O, was used for the final washes, and glass coverslips of stained microglia were mounted onto slides. Positively stained Iba1 and GFAP-expressing cells were visualized using an Olympus IX51 microscope and DP Controller software 3.21.276 (Olympus).
Phagocytosis Assay
Microglia were plated onto black 96-well tissue culture plates at a cell density of 2 × 10⁴ cells/well with 125 μL of minimum essential media (Invitrogen, Frederick) containing Earle's salts, l-glutamine, 0.01% pyruvate, 0.6% glucose, and 5% fetal bovine serum. Twenty-four hours later, primary microglia were incubated for 8 hours with fluorescein isothiocyanate (FITC)–labeled Escherichia coli bioparticles at 0.25 mg/mL or FITC-Aβ42 at 5 μm. Medium was removed and cells were washed in 0.25 mg/mL trypan blue in PBS to quench signal from extracellular peptide. A SpectraMax Gemini microplate spectrofluorometer (Molecular Devices, Downingtown, PA) was used to quantify the intracellular fluorescence at 480-nm excitation and 520-nm emission. Relative fluorescent intensities were ascertained by normalizing to background FITC–E. coli bioparticles, where wells received primary microglia at the same cell density. alamarBlue® viability (Invitrogen, Carlsbad) staining at a 1:10 dilution was also performed on the same cohort of cells under identical culture conditions in separate tissue culture plates at the start of the phagocytosis assay (when FITC–E. coli bioparticles were added) and used for normalization.
SIRP-β1 and Iba1 Immunocytochemistry
Primary microglia were plated on glass coverslips at 4 × 10⁴ cells/well in a 24-well tissue culture dish and incubated at 37°C for 24 hours. Microglial cells were fixed with 4% paraformaldehyde and permeabilized with TBS plus 0.1% Triton-X 100. Cells were blocked with 10% goat serum for 1 hour at room temperature and co-immunostained with rat monoclonal anti- signal regulator protein-β1 (SIRP-β1) (1:750; provided by Dr. Takashi Matozaki, Gunma University, Maebashi City, Gunma, Japan) and Iba1 (1:1000; Wako), followed by AlexaFluor (Invitrogen, Carlsbad) secondary antibodies for detection. Images were captured with immunofluorescent microscopy with an Olympus IX51 microscope and DP Controller software 3.21.276 (Olympus).
Western Blot Analyses
To assess CD14 expression in primary microglia, cells were plated at 1 × 10⁵ in a 24-well culture plate. Twenty-four hours later, cells were lysed in radioimmunoprecipitation assay buffer containing 150 mmol/L Tris-HCl (pH 7.4), 150 mmol/L NaCl, 1% Triton-X 100, 1% sodium deoxycholate, 0.1% SDS, 1 mmol/L EDTA, protease inhibitor cocktail (Sigma-Aldrich, St Louis, MO), and activated sodium orthovanadate, where three wells were pooled together for a single sample group. Cell lysates were analyzed for CD14 expression using a mouse monoclonal anti-CD14 primary antibody (Abnova, Littleton, CO) at 1:1000 and incubated for 2 hours at room temperature, followed by a horseradish peroxidase–conjugated goat anti-mouse IgG (H+L) secondary antibody (Jackson ImmunoResearch Laboratories, West Grove, PA) at 1:2000 for 1 hour at room temperature. Membranes were subsequently stripped and reprobed with the β-actin (Sigma-Aldrich) loading control antibody at 1:5000 in combination with a horseradish peroxidase–conjugated goat anti-mouse secondary antibody (1:2000; Jackson ImmunoResearch Laboratories). Blots were visualized with chemiluminescence and analyzed with densitometry for total raw density (LabWorks by UVP, Upland, CA).
ELISA
Age-matched (2-, 6-, 9-, 12-, and 15-month-old) 3xTg-AD and 3xTg-ADxTNF-RI/RII KO mouse hippocampal tissue was microdissected and snap frozen on dry ice, followed by storage at 80°C. Frozen tissue was weighed, homogenized, and fractionated by ultracentrifugation. Hippocampal tissue homogenates were assessed for levels of insoluble Aβ40 and Aβ42, as previously described.32
Nu-4 Dot Blots
Nu-4 dot blots were performed as previously described.32 Briefly, nitrocellulose membranes were incubated in transfer buffer and 25 μg of soluble hippocampal homogenates was spotted onto the membrane while vacuum pressure was applied. Membranes were blotted using the Nu-4 primary antibody33 at 1:1500 dilution for 1.5 hours at room temperature. A horseradish peroxidase–conjugated secondary antibody was used at a 1:2000 dilution for 1.5 hours at room temperature. The membranes were stripped and reprobed with anti-β-actin at 1:5000 for normalization of protein loading. Dot blots were visualized with chemiluminescence and analyzed with densitometry for total raw density (Labworks by UVP).
Congo Red Staining
Congo red stock solution was prepared with a saturated 1 mol/L NaCl solution and 0.2% Congo red (Sigma-Aldrich). This solution was filtered, and an equal volume of 80% ethanol was added. Free-floating sections were washed in 0.15 mol/L PB and then transferred to a Congo red working solution (50 mL of Congo red stock with 0.5 mL of 1% NaOH) for 30 minutes. Sections were washed in PBS and mounted on SuperFrost Plus slides (VWR International). After tissue was completely dried, slides were dipped in 30% ethanol for 30 seconds, followed by xylene for 15 seconds, and coverslipped.
Results
Derivation and Gross Characterization of 3xTg-ADxTNF-RI/RII KO Mice
3xTg-AD mice lacking functional TNF-RI (p55) and TNF-RII (p75) genes were generated by breeding 3xTg-AD mice15,28 and C57BL/6 TNF-RI/RII–deficient mice29 using a monogamous breeding strategy (Figure 1A). Verification of the homozygous status for APPswe and tauP301L genes was performed by crossing 3xTg-ADxTNF-RI/RII KO and C57BL/6 mice to screen for the genetic transfer from the three generations via mendelian inheritance patterns (data not shown). The 3xTg-ADxTNF-RI/RII KO mice did not display any gross phenotypic, behavioral, or reproductive anomalies. The founder 3xTg-ADxTNF-RI/RII KO colony was expanded by monogamous breeding and studied in subsequent IHC, biochemical, and functional analyses.
The overall neuroanatomical structure of 3xTg-AD and 3xTg-ADxTNF-RI/RII KO mice was analyzed using Nissl IHC (Figure 1, B–H). Coronally sliced and Nissl-stained tissue sections from 2-month-old 3xTg-AD and 3xTg-ADxTNF-RI/RII KO mice were quantitatively assessed in five regions of the hippocampal formation, including the CA1, CA2, and CA3 subfields, the DG, and the lacunosum molecular layer that is distally ventral to the pyramidal cell layer of the CA1 subfield. The schematic drawing in Figure 1B outlines the measurements that were taken at specific bregma positions using the length tool in the MCID 6.0 ELITE Imaging Software Program. These analyses demonstrate that the gross hippocampal cytoarchitecture of 3xTg-ADxTNF-RI/RII KO mice develops similarly to that of 3xTg-AD mice.
To further characterize the newly generated 3xTg-ADxTNF-RI/RII KO mice, 2-month-old 3xTg-AD and 3xTg-ADxTNF-RI/RII KO mice were stereotactically infused with AAV2 vectors expressing human TNF-α (ipsilateral) or eGFP (contralateral). Subsequently, 6- and 12-month-old 3xTg-ADxTNF-RI/RII KO and 12-month-old 3xTg-AD mice were sacrificed and coronal brain sections were processed and stained for Iba1 immunoreactivity. Figure 1H demonstrates that 3xTg-ADxTNF-RI/RII KO microglia are nonresponsive after long-term TNF-α or eGFP expression because of a lack of TNF-RI and TNF-RII receptor expression, whereas transduced 12-month-old 3xTg-AD microglia significantly respond to ectopically expressed TNF-α, as previously described.18 The infusion of rAAV2–TNF-α into 3xTg-ADxTNF-RI/RII KO and 3xTg-AD mice did not increase reactive astrocyte staining in either genotype (data not shown). These data are in agreement with our prior report18 that astrocytes in 3xTg-AD mice are unaffected by long-term, rAAV-mediated TNF-α expression.
Adult 3xTg-ADxTNF-RI/RII KO and 3xTg-AD Mice Express Similar Levels of LTP at the CA3-CA1 Synapses in Vivo
In addition to Aβ-mediated pathological features, deficits in synaptic function may also underlie cognitive impairments in AD. Synaptic function can be measured by LTP, a stable long-lasting increase in synaptic strength induced by HFS to afferent fiber inputs.34 Interestingly, 3xTg-AD mice display deficits in LTP induction in the CA1 area of the hippocampus by the age of 6 months, before overt neuronal degeneration.15 Thus, it was of interest to conduct LTP experiments in 3xTg-ADxTNF-RI/RII KO mice at a similar time point (aged 6 to 7 months) to examine the effects of long-term TNF receptor ablation on hippocampal basal synaptic transmission and function in vivo. To investigate basal synaptic transmission, we generated input-output curves by measuring fEPSP amplitude elicited in CA1 by stimulation of the contralateral CA3 area at increasing stimulus intensities (Figure 2A). At the age of 6 to 7 months, both 3xTg-ADxTNF-RI/RII KO and 3xTg-AD mice exhibited smaller fEPSP amplitudes at all stimulus intensities tested (50 to 400 μA) relative to age-matched Non-Tg controls. However, the 3xTg-ADxTNF-RI/RII KO mice were not significantly different from the 3xTg-AD mice, demonstrating comparable levels of impairment in basal synaptic transmission in these animals by the age of 6 to 7 months. Subsequently, we conducted LTP experiments at the CA3-CA1 synapse in all mice lines under urethane anesthesia (Figure 2B). A delivery of an HFS episode to CA3, consisting of 100 pulses at 100 Hz, produced a robust increase in CA1 fEPSP amplitude in Non-Tg mice that lasted for at least 1 hour after stimulation. In Non-Tg mice, the amplitude of fEPSPs averaged over the last 30 minutes of the experiment was 183% of baseline (Figure 2B). The 3xTg-ADxTNF-RI/RII KO and 3xTg-AD mice showed similar increases in fEPSP amplitude in response to HFS; however, the levels of potentiation in these mice were significantly less than those elicited in Non-Tg age-matched controls. The amplitudes of fEPSPs averaged over the final 30 minutes of the experiment in 3xTg-ADxTNF-RI/RII KO and 3xTg-AD mice were 153% and 141% of baseline, respectively.
Figure 2.
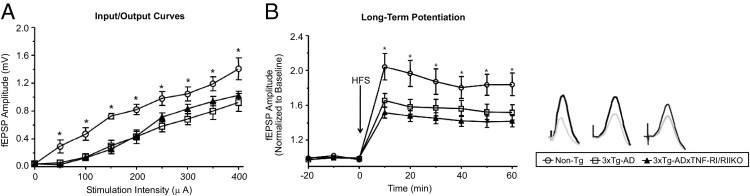
Characterization of hippocampal synaptic function in 3xTg-ADxTNF-RI/RII KO, 3xTg-AD, and Non-Tg mice. A: Input-output curves showing average fEPSP amplitude in the stratum radiatum of CA1 in response to single-pulse stimulation to the contralateral CA3 area at increasing stimulation intensities before acquisition of baseline recordings in 3xTg-ADxTNF-RI/RII KO (n = 8), 3xTg-AD (n = 9), and Non-Tg (n = 6) mice. Average fEPSP amplitude in CA1 increased similarly in all three groups with increasing stimulation intensities. An analysis of variance was performed comparing fEPSP amplitude across stimulation intensities in all three groups: significant effect of group, F2,20 = 6.6, P = 0.006; significant effect of stimulation, F8,160 = 82.8, P < 0.01; nonsignificant group by stimulation interaction, F8,160 = 1.3, P = 0.185. The simple effects of stimulation were significant for all animals receiving increasing stimulation intensities: Non-Tg (F8,56 = 49.4, P < 0.01), 3xTg-ADxTNF-RI/RII KO (F8,56 = 32.3, P < 0.01), and 3xTg-AD (F8,64 = 22.7, P < 0.01) mice. Moreover, 3xTg-ADxTNF-RI/RII KO and 3xTg-AD mice showed similar levels of fEPSP amplitude with increasing stimulus strength. Analyses of variance showed a nonsignificant effect of group (F1,151 = 0.2, P = 0.597), a significant effect of stimulation (F8,120 = 54.3, P < 0.01), and a nonsignificant group by stimulation interaction (F8,120 = 0.6, P = 0.742). Tukey's post hoc analysis showed that 3xTg-ADxTNF-RI/RII KO and 3xTg-AD mice showed significantly smaller evoked fEPSPs compared with Non-Tg mice (P = 0.02), indicating similar levels of impaired basal synaptic transmission in these animals. B: Left: The application of an HFS episode (100 pulses at 100 Hz) to the CA3 hippocampal area elicited robust LTP in CA1 in Non-Tg animals (n = 6) that lasted for at least 1 hour after LTP induction. The levels of hippocampal LTP in response to HFS were significantly diminished to comparable levels in both 3xTg-ADxTNF-RI/RII KO (n = 8) and 3xTg-AD (n = 9) mice. Analyses of variance comparing fEPSP amplitude in all three groups showed a significant effect of group (F2,20 = 4.5, P = 0.024), a significant effect of time (F8,160 = 100.5, P < 0.01), and a significant group by time interaction (F16,160 = 3.9, P < 0.01); for 3xTg-ADxTNF-RI/RII KO versus 3xTg-AD mice, there was a nonsignificant effect of group (F1,15 = 1.1, P = 0.300), a significant effect of time (F8,96 = 74.2, P < 0.01), and a nonsignificant group by time interaction (F8,120 = 1.2, P = 0.295); for 3xTg-ADxTNF-RI/RII KO versus Non-Tg mice, there was a significant effect of group (F1,12 = 7.8, P = 0.016), a significant effect of time (F8,96 = 63.4, P < 0.01), and a significant group by time interaction (F8,96 = 6.9, P < 0.0); for 3xTg-AD versus Non-Tg mice, there was a nonsignificant effect of group (F1,13 = 3.7, P = 0.074), a significant effect of time (F8,104 = 64.4, P < 0.01), and a significant group by time interaction (F8,104 = 3.0, P = 0.04). Right: fEPSPs during baseline (gray) and at the end of the experiment (black) for a Non-Tg (left), a 3xTg-AD (middle), and a 3xTg-ADxTNF-RI/RII KO (right) mouse receiving HFS (fEPSPs are averages of 10 individual sweeps, calibration is 10 milliseconds and 1.0 mV). *P < 0.05 between Non-Tg and transgenic animals (significant difference).
3xTg-ADxTNF-RI/RII KO Mice Express Human Tau and APPswe Transgenes Comparably to 3xTg-AD Mice
Transgenes encoding human APPswe and human tauP301L, both under the regulatory control of the mouse Thy1.2 promoter, are overexpressed in the 3xTg-AD mouse model to generate the two hallmark pathological features of AD: amyloid plaques and neurofibrillary tangles (NFTs). By using coronally sliced tissue sections of 2-, 3-, 6-, 9-, 12-, and 15-month-old 3xTg-AD and 3xTg-ADxTNF-RI/RII KO mice, diaminobenzidine (DAB) IHC and quantitative image analysis for transgene expression was performed. Human tau was detected using the HT7 antibody, whereas human APPswe was detected using the anti-hAPP Y188 antibody. Representative HT7 images for 3xTg-AD and 3xTg-ADxTNF-RI/RII KO are depicted in Figure 3A and include six times digitally enhanced images of the designated CA1 pyramidal cell layer at the age of 9 months. Image analysis demonstrated that there were no significant differences in HT7 immunoreactivity at any points between 3xTg-AD and 3xTg-ADxTNF-RI/RII KO mice (Figure 3B). Figure 3C shows representative images of Y188 DAB-stained immune-positive cells from 3xTg-AD and 3xTg-ADxTNF-RI/RII KO mice, respectively. Again, image analysis (Figure 3D) demonstrated that average pixel intensities of Y188-stained cells between the two genotypes were similar. These results indicate that ablated TNF-α receptor signaling does not overtly alter transgene expression of 3xTg-AD mice.
Figure 3.
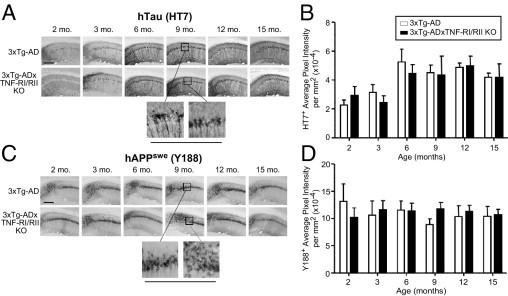
Human tauP301L and APPswe transgenes are expressed comparably in 3xTg-AD and 3xTg-ADxTNF-RI/RII KO mice. Coronal brain sections from 2-, 3-, 6-, 9-, 12-, and 15-month-old 3xTg-AD and 3xTg-ADxTNF-RI/RII KO mice were subjected to DAB IHC for human tauP301L transgene product using the HT7 antibody (A) and human APPswe transgene product using the Y188 antibody (C). Representative ×10 images are depicted. Underlined panels are digitally enhanced images six times the designated immunostained CA1 layer to better depict cellular morphological features. The staining intensities for HT7+ (B) and Y188+ (D) cells were determined for stained 3xTg-AD and 3xTg-ADxTNF-RI/RII KO brain sections. Statistical analyses were performed using a two-way analysis of variance with a Bonferroni's posttest. Error bars represent SEM (N = 3 to 7). Scale bars: 500 μm (A and C).
Age-Related Increase, then Decrease, in Iba1 Marker Expression Exhibited by 3xTg-AD Hippocampal Microglia Does Not Occur in 3xTg-ADxTNF-RI/RII KO Mice in Vivo
Activated microglia and astrocytes appear during all stages of AD and are recognized as participants in the neuroinflammatory process, whereby TNF-α may serve as a potent mediator. Our laboratory has previously shown that 6-month-old 3xTg-AD mice exhibit a regional and age-dependent enhancement of F4/80-positive microglia, correlating with up-regulated endogenous TNF-α expression.16 That prior finding suggested that TNF-α affects microglial activation and/or recruitment during early AD pathogenesis. To determine the effects of abrogated TNF-α signaling on glial cell marker expression in the 3xTg-AD model, we performed IHC for astrocytes and microglia by using GFAP and Iba1 antibodies, respectively. Figure 4A depicts representative images of Iba1-positive cells of 3xTg-AD and 3xTg-ADxTNF-RI/RII KO at 2, 3, 6, 9, 12, and 15 months. Representative images of GFAP-stained cells of 3xTg-AD and 3xTg-ADxTNF-RI/RII KO mice are also shown. Interestingly, the level of Iba1 staining remained relatively unchanged over 2 to 15 months in 3xTg-ADxTNF-RI/RII KO mice, whereas there appeared to be an increase, then a decrease, in the Iba1 staining population as a function of age in 3xTg-AD mice with intact TNF receptor expression (Figure 4B). We found that staining intensities of GFAP-expressing astrocytes remained unaltered between 3xTg-AD and 3xTg-ADxTNF-RI/RII KO mice (Figure 4, C and D).
Figure 4.

Loss of TNF-RI/RII expression does not alter astrocyte staining intensities but does lead to a blunting of Iba1+ microglia/macrophage levels compared with age-matched 3xTg-AD mice. Coronal brain sections from 2-, 3-, 6-, 9-, 12-, and 15-month-old 3xTg-AD and 3xTg-ADxTNF-RI/RII KO mice were subjected to DAB IHC for microglia using an Iba1-specific antibody (A) and astrocytes using a GFAP-specific antibody (C). Representative ×10 images are depicted. Underlined panels are digitally enhanced images six times the designated immunostained CA1 layer to better depict cellular morphological features. The staining intensities for Iba1+ (B) and GFAP+ (D) cells were determined for stained 3xTg-AD and 3xTg-ADxTNF-RI/RII KO brain sections. Statistical analyses were performed using a two-way analysis of variance with a Bonferroni's posttest. *P < 0.01. Error bars represent SEM (N = 3 to 7). Scale bars: 500 μm (A and C).
Ablated TNF-α Receptor Expression Reduces General and Aβ42-Specific Phagocytosis Activity and CD14 Surface Expression
Aβ is a strong microglial stimulator, resulting in the release of pro-inflammatory mediators. Koenigsknecht-Talboo and Landreth35 have demonstrated that elevated levels of pro-inflammatory cytokines, including TNF-α, may attenuate efficient phagocytosis of accumulated Aβ, leading to enhanced plaque load. To that end, we subsequently assessed the phagocytosis capability of primary microglial cultures derived from these mice. Microglia were isolated from P1 pups of 3xTg-AD and 3xTg-ADxTNF-RI/RII KO mice. Before performing the phagocytosis analyses, we confirmed that pure populations of microglia were being obtained. Under identical cell culture conditions, 3xTg-AD and 3xTg-ADxTNF-RI/RII KO primary microglial cultures harbor dramatically few GFAP-positive cells, indicating that our primary microglial cultures are highly pure and relatively free from astrocyte contamination (Figure 5A). No obvious morphological differences were discerned between the 3xTg-AD and 3xTg-ADxTNF-RI/RII KO primary microglial cells.
Figure 5.
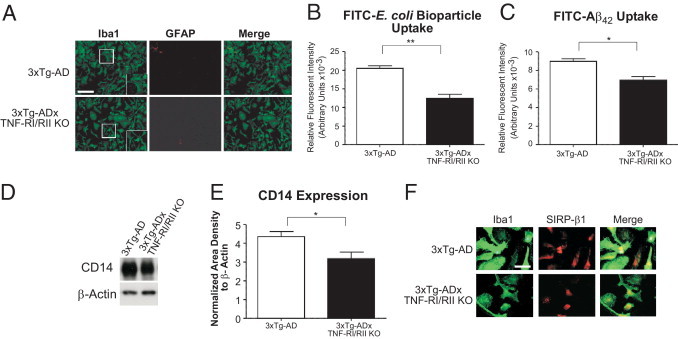
Ablated TNF-α receptor expression reduces general and Aβ42 peptide phagocytosis activity and CD14 surface expression but not SIRP-β1 levels of 3xTg-ADxTNF-RI/RII KO microglia. Primary microglial cultures were established from postnatal day 1 (P1) 3xTg-AD and 3xTg-ADxTNF-RI/RII KO pups and plated onto glass coverslips at a density of 4 × 10⁴ cells/well. A: Cells were stained with Iba1- and GFAP-specific antibodies to detect microglia and astrocytes, respectively. Fluorescent images were taken under ×20 magnification, and merged signals are also shown. Insets: Digitally enhanced images at ×1.5. Error bars represent SEM. Scale bar = 200 μm (A). P1 3xTg-AD and 3xTg-ADxTN-RI/RII KO pups were used to determine the general phagocytic activity of primary microglial cells in the presence of FITC–E. coli bioparticles (B). Cells were plated at 20,000 cells/well in a 96-well culture plate and treated 24 hours later with FITC–E. coli bioparticles or vehicle control for an additional 8 hours. A parallel experiment was performed to assess the uptake of FITC-labeled Aβ42 (C). Extracellular FITC signal was quenched with trypan blue and subsequently the fluorescent intensity was measured. Error bars represent SEM. Statistical analyses were performed using a two-tailed nonparametric Student's t-test. *P < 0.05, **P < 0.001. N = 8. D: CD14 expression detected by Western blot analysis for 3xTg-AD and 3xTg-ADxTNF-RI/RII KO primary microglia. E: Quantification of band intensities and normalization to β-actin. Statistical analyses were performed using a two-tailed nonparametric Student's t-test. *P < 0.05. N = 4. F: SIRP-β1 and Iba1 were concurrently stained using 3xTg-AD and 3xTg-ADxTNF-RI/RII KO microglia. Immunofluorescent images were captured for SIRP-β1– and Iba1-positive cells. Merged images are also depicted. Scale bar = 50 μm (F).
Microglia from these two genotypes were subsequently examined for their general and selective Aβ42 phagocytosis activity. 3xTg-AD and 3xTg-ADxTNF-RI/RII KO primary microglia were quantitatively assessed by uptake of FITC-labeled E. coli bioparticles. 3xTg-AD microglia exhibited a significantly higher E. coli bioparticle fluorescent intensity compared with that of 3xTg-ADxTNF-RI/RII KO primary microglia (Figure 5B). Similarly, when 3xTg-AD and 3xTg-ADxTNF-RI/RII KO primary microglia were incubated with FITC-conjugated Aβ42 peptide, 3xTg-ADxTNF-RI/RII KO microglia were less efficient in Aβ uptake than 3xTg-AD microglia (Figure 5C), indicating that TNF receptor expression status is important for effective microglial phagocytosis function.
Several proteins have been implicated in Aβ phagocytosis and are up-regulated on microglia during this process. One of these, CD14, is the lipopolysaccharide receptor and has participated in phagocytosis of both bacterial components and Aβ.36 3xTg-AD and 3xTg-ADxTNF-RI/RII KO primary microglia were examined for CD14 expression. Figure 5D depicts Western blot analyses of microglial cell lysates probed with anti-CD14 and β-actin antibodies. 3xTg-AD primary microglia exhibit higher steady-state CD14 levels compared with 3xTg-ADxTNF-RI/RII KO primary microglia (Figure 5E).
Ablated TNF-α Receptor Expression Does Not Affect SIRP-β1 Levels Expressed by 3xTg-ADxTNF-RI/RII KO Primary Microglia
Another receptor that has been reported to positively correlate with Aβ phagocytosis performed by monocyte lineage cells, including microglia in the central nervous system, is SIRP-β1, a transmembrane-associated receptor.37 Figure 5F depicts representative immunofluorescent images at ×100 magnification of 3xTg-AD and 3xTg-ADxTNF-RI/RII KO microglia costained with Iba1 (green) and SIRP-β1 (red). Cultured 3xTg-AD and 3xTg-ADxTNF-RI/RII KO cells possess ramified or nonactivated cell morphological features, with differences in SIRP-β1 staining intensities that were indistinguishable between the two genotypes. These data suggest that TNF receptor expression status may differentially affect proteins that compose microglia-resident phagocytic machinery.
Amyloid-Related Pathological Features Are More Severe in Older 3xTg-ADxTNF-RI/RII KO Mice
There are compelling data supporting the role of microglia in Aβ clearance.38–41 Microglia are attracted to and activated by amyloid deposits and exhibit the ability to eliminate Aβ, as previously reviewed.42 Given that 3xTg-ADxTNF-RI/RII KO primary microglia exhibit reduced Aβ42 phagocytosis activity in vitro that is further supported by a down-regulation of steady-state CD14 levels, it is possible that these mice develop more severe amyloid and tau pathological features. To that end, coronal brain sections of age-matched 3xTg-AD and 3xTg-ADxTNF-RI/RII KO mice were immunostained with the 12F4 antibody to assess the extent of extracellular Aβ42 deposition (Figure 6A). Image analysis revealed that 15-month-old 3xTg-ADxTNF-RI/RII KO mice exhibited a trending increase, although not statistically significant, in 12F4-positive plaque load, as measured by average pixel intensity (Figure 6B) and significantly more plaques in the CA1 region (Figure 6C) compared with age-matched 3xTg-AD counterparts. To corroborate these findings, we performed sandwich enzyme-linked immunosorbent assays to measure soluble and insoluble Aβ40 and Aβ42 levels in hippocampal tissue homogenates from age-matched 3xTg-AD and 3xTg-ADxTNF-RI/RII KO mice. We found that 15-month-old 3xTg-ADxTNF-RI/RII KO mice harbor significantly higher levels of soluble Aβ42 (Figure 6E), insoluble Aβ40 (Figure 6F), and insoluble Aβ42 (Figure 6G). These data support the 12F4 IHC analyses and demonstrate that aged 3xTg-ADxTNF-RI/RII KO mice have significantly higher Aβ peptide/plaque burden compared with age-matched 3xTg-AD counterparts. To determine the composition of the soluble fraction, hippocampal tissue homogenates were subjected to dot blot analysis (Figure 6H) to detect oligomeric species of amyloid-derived diffusible ligands using the Nu-4 antibody. We found that 6-month-old 3xTg-ADxTNF-RI/RII KO mice harbored significantly higher levels of oligomeric conformers compared with 3xTg-AD tissue homogenates, which decreased as a function of time, and by the age of 15 months, the 3xTg-AD mice exhibited a statistically significant increase of oligomers. Further characterization using Congo red histochemistry revealed that 15-month-old 3xTg-ADxTNF-RI/RII KO mice displayed significantly more compacted amyloid fibrils than did 15-month-old 3xTg-AD mice (Figure 6, I–K).
Figure 6.
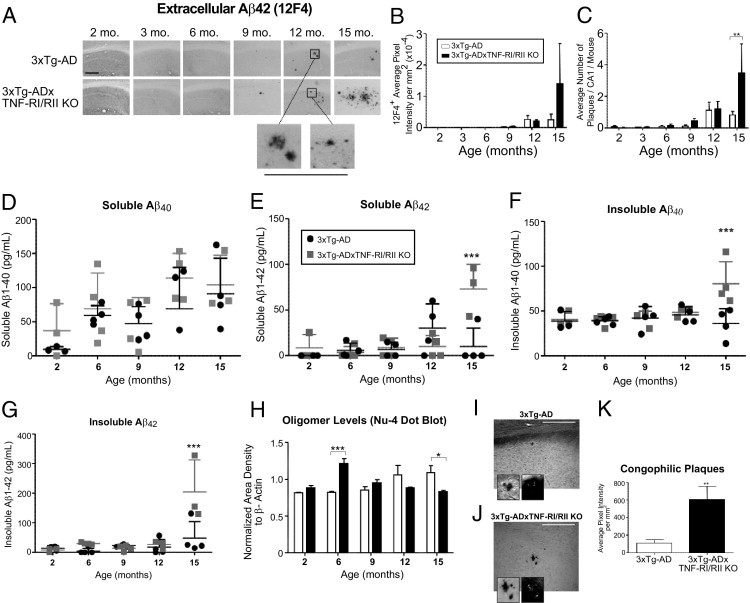
Fifteen-month-old 3xTg-ADxTNF-RI/RII KO mice exhibit elevated extracellular Aβ plaque load, soluble Aβ42, insoluble Aβ40, and Aβ42 protein levels and congophilic plaques compared with 3xTg-AD counterparts. A: Coronal brain sections from 2-, 3-, 6-, 9-, 12-, and 15-month-old 3xTg-AD and 3xTg-ADxTNF-RI/RII KO mice were subjected to DAB IHC for extracellular Aβ42 using a human Aβ42-specific antibody. Representative ×10 images are depicted. Underlined panels are digitally enhanced images six times the designated immunostained CA1 layer to better depict deposit morphological features. Scale bar = 500 μm (A). The staining intensities (B) and counts (C) for Aβ42 were determined for stained 3xTg-AD and 3xTg-ADxTNF-RI/RII KO brain sections. Statistical analyses were performed using a two-way analysis of variance with a Bonferroni's posttest. Error bars represent SEM. N = 3 to 7. **P < 0.01. Soluble and insoluble Aβ40 (D and F, respectively) and Aβ42 (E and G, respectively) levels were measured in hippocampal tissue homogenates diluted 1:5 from 2-, 6-, 9-, 12-, and 15-month-old 3xTg-AD and 3xTg-ADxTNF-RI/RII mice. H: A dot blot analysis was implemented to detect Nu-4 expression of oligomeric forms of amyloid protein from 2-, 6-, 9-, 12-, and 15-month-old 3xTg-AD and 3xTg-ADxTNF-RI/RII KO mice using hippocampal tissue homogenates. The statistical significance of Aβ enzyme-linked immunosorbent assays and an Nu-4 dot blot was determined by two-way analysis of variance and Bonferroni's posttest. N = 4. *P < 0.05, ***P < 0.001. I–K: Congophilic plaques were visualized and quantified in 15-month-old 3xTg-AD and 3xTg-ADxTNF-RI/RII KO mice (N = 4). Insets: ×60 magnification showing enhanced plaque morphological features and birefringence of β-sheet secondary structure under polarized light. A two-tailed Student's t-test was performed for statistical analysis. **P < 0.05. Scale bars: 50 μm (I and J). Error bars in I and J are SEM.
3xTg-ADxTNF-RI/RII KO Mice Demonstrate Intensified Intraneuronal PHF Pathological Features at the Age of 15 Months
Intracellular NFTs are the second major neuropathological hallmark of AD. NFTs contain hyperphosphorylated tau, a microtubule-stabilizing protein that eventually loses the ability to bind microtubules on aberrant hyperphosphorylation, thereby disrupting the axonal transport system.43–45 Our finding that 3xTg-ADxTNF-RI/RII KO mice harbor enhanced amyloid pathological features at the age of 15 months led us to ask whether tau pathological features are similarly affected in 3xTg-AD mice lacking TNF receptor signaling. By using the phospho-specific tau AT-180 antibody that recognizes doubly phosphorylated Thr231 and Ser235 residues, 2-, 3-, 6-, 9-, 12-, and 15-month-old 3xTg-AD and 3xTg-ADxTNF-RI/RII KO mice were IHC stained (Figure 7A). No overt differences in staining patterns or intensities in AT-180 staining were observed at any point between the two genotypes (Figure 7B). An examination of PHF pathological features using the PHF-1 antibody revealed that 15-month-old 3xTg-ADxTNF-RI/RII KO mice harbor greatly enhanced levels of PHF-1 staining compared with aged-matched 3xTg-AD mice (Figure 7, C and D). This was a somewhat startling observation because we previously showed that 3xTg-AD mice do not exhibit robust PHF-1 staining until approximately the age of 26 months.31 These data illustrate that, although an early tau phosphorylated epitope is not affected by TNF-α receptor expression status, staining for an advanced hyperphosphorylation epitope associated with later-stage disease is significantly enhanced in mice devoid of cognate TNF-RI/RII expression.
Figure 7.
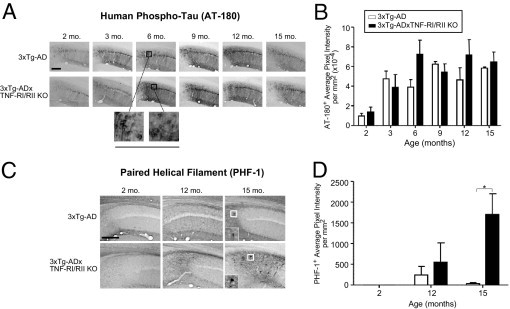
3xTg-ADxTNF-RI/RII KO mice display exacerbated PHF immunostaining at the age of 15 months. Coronal brain sections from 2-, 3-, 6-, 9-, 12-, and 15-month-old 3xTg-AD and 3xTg-ADxTNF-RI/RII KO mice were subjected to DAB IHC for phospho-tau using the AT-180 antibody (A) and PHF tau (Ser396 or Ser404) using the PHF-1 antibody (C). Representative ×10 images are depicted. Underlined panels and insets are digitally enhanced images six times the designated immunostained CA1 layer to better depict cellular morphological features. The staining intensities for AT-180+ (B) and PHF-1+ (D) cells were determined for stained 3xTg-AD and 3xTg-ADxTNF-RI/RII KO brain sections. Statistical analyses were performed using a two-way analysis of variance with a Bonferroni's posttest. *P < 0.05. Error bars represent SEM. N = 3 to 7. Scale bars: 500 μm (A and C).
Discussion
Chronic neuroinflammation is a prominent feature of AD pathogenesis, and evidence supports TNF-α as a key pro-inflammatory mediator contributing to the inflammatory milieu.2,22 3xTg-AD mice globally devoid of cognate TNF-RI and TNF-RII were generated to study the effects of prolonged absence of TNF-α signaling in relation to the progression of AD-associated pathological features. Our results indicate that, by Nissl IHC, 3xTg-ADxTNF-RI/RII KO mice exhibit no major cytoarchitectural or gross structural changes relative to 3xTg-AD animals (Figure 1, B–G). In conjunction with these findings, it appears that these transgenic mice exhibit a similar degree of propensity for LTP induction in CA1 apical dendrites and comparable levels of basal synaptic transmission (Figure 2, A and B). The deficits in hippocampal LTP induction in the 3xTg-AD mouse characterized herein coincide with previous findings that have shown similar levels of LTP impairment in the hippocampal slice preparation of 3xTg-AD mice.15 Interestingly, the absence of pronounced LTP induction observed in the 3xTg-ADxTNF-RI/RII KO mice differs from previous evidence demonstrating a critical role of TNF-α in the Aβ-induced inhibition of LTP at hippocampal synapses. Previous work46 has shown that Aβ-induced suppression of hippocampal LTP is absent in mutant mice null for TNF-RI and is prevented by inhibitors of TNF-α, TNF-α peptide antagonists, and TNF-α production. These interesting findings were observed in hippocampal slice preparations in the presence of short-term administration of oligomeric Aβ before the onset of LTP induction in mice aged 1 month. The impairments in LTP induction expressed by 6-month-old 3xTg-ADxTNF-RI/RII KO in our studies may be mediated by long-term levels of Aβ exerting deficits at the synapse that are not preventable even in the absence of TNF-α–mediated influence in vivo. Our understanding of TNF-α in Aβ-induced inhibition of hippocampal LTP heavily stems from work performed using in vitro models, whereas its role in the intact AD brain in the presence of prolonged exposure to Aβ is not well established. A relatively longer period of elevated Aβ oligomers is known to impair synaptic facilitation by partial N-methyl-D-aspartate receptor (NMDAR) blockade, by either minimizing NMDAR activity, subsequently leading to reduced NMDAR-dependent Ca2+ influx, or enhancing NMDAR-dependent activation of calcineurin, intracellular mechanisms known to mediate the induction of long-term depression.47–49 Whether the impairments in LTP induction in the current AD transgenic mouse lines are due to overlapping synaptic mechanisms, such as Aβ-induced down-regulation of NMDARs critical for LTP induction, or whether there is a shift toward the activation of NMDAR-dependent intracellular cascades promoting long-term depression (LTD) is unknown.50 However, we illustrate that global ablation of TNF receptors in 3xTg-ADxTNF-RI/RII KO mice does not improve deficits in hippocampal LTP induction, as assessed at the age of 6 to 7 months (Figure 2, A and B). Future in-depth experiments are required to examine the mechanisms by which Aβ may be exerting its effects at the synapse in the 3xTg-ADxTNF-RI/RII KO mouse model.
Despite the fact that they demonstrate greater levels of hippocampal Aβ oligomers, 3xTg-ADxTNF-RI/RII KO mice do not exhibit a significantly greater deficit in Aβ-induced LTP at CA3-CA1 synapses relative to 3xTg-AD animals. Our current work shows reduced Aβ phagocytic marker expression and phagocytosis activity in primary microglia, indicating that intact TNF-α receptor signaling is critical for microglial-mediated uptake of extracellular Aβ peptides. These observations suggest that 3xTg-ADxTNF-RI/RII KO mice may also exhibit decreased levels of pro-inflammatory cytokine production, such as IL-6 and IL-1β, that are partially reliant on microglial activation and are known to inhibit hippocampal synaptic facilitation and attenuate hippocampal-dependent learning and memory.51–53 Consequently, the lack of additional deficits in LTP induction observed in 3xTg-ADxTNF-RI/RII KO mice in the presence of elevated Aβ oligomers may be the result of a dampened effect of glial-mediated activation of cytokines known to exert detrimental influences at the synapse.51 Evidently, the mechanisms by which Aβ oligomers are shown to impair synaptic potentiation are multifaceted and appear to differ based on Aβ exposure, electrophysiological preparations, and stage of AD pathogenesis. To further understand the complex effects of Aβ on synaptic function, future studies require an integrative approach using intact in vivo preparations, allowing the inclusion of behavioral assessments to establish more direct links between AD-affiliated pathological features, synaptic plasticity, and learning and memory function. In this regard, freely moving rodent models will serve as a critical bridge between in vitro work and the literature on Aβ-induced synaptic deficits observed in the intact AD brain.
Although this approach to ablate TNF-α receptor expression has provided useful insights, there are possible caveats related to the strategy that should be addressed. Although IHC and electrophysiological analyses suggest that 3xTg-ADxTNF-RI/RII KO mice exhibit no major cytoarchitectural changes or differences in LTP elicitation relative to 3xTg-AD animals, respectively, TNF-α signaling has played a vital role in apoptosis and synaptogenesis during central nervous system development. Barker et al54 have demonstrated that TNF-α contributes to apoptosis of developing neurons that depend on a neurotrophin, nerve growth factor. Furthermore, TNF-α knockout mice have altered hippocampal morphogenesis, as evidenced by accelerated DG maturation, smaller dendritic tree arborization in the CA1 and CA2 regions, improved spatial memory, and an increase in nerve growth factor.55 Reports also support distinct roles for the respective TNF-α receptors. TNF-RI is associated with neuronal damage and contains an intracellular death domain, allowing for the recruitment of the TRADD and Fas-Associated protein with Death Domain (FADD) adaptor proteins that eventually activate pro-caspase 8.56 TNF-RII, which does not have a death domain, promotes neuroprotective processes.57,58 Iosif et al59 reported that TNF-RI, but not TNF-RII, is a negative regulator of neural progenitor proliferation. They further substantiated the role of TNF-α in neurogenesis by demonstrating that mice lacking both TNF-RI and TNF-RII or only TNF-RI lead to an increase of mature hippocampal neurons and enhanced cell proliferation in the dentate subgranular zone, thereby indicating unique roles for each of the individual receptors.59
However, in contrast to double TNF receptor or TNF-RI KO mice, our 3xTg-ADxTNF-RI/RII KO mouse model has extensive AD-associated pathological features and it is likely that neurogenesis is greatly decreased given that in mouse models expressing human APP or PS1 mutations adult hippocampal neurogenesis is reduced.60–65 Furthermore, 3xTg-AD mice demonstrate impaired neurogenesis in the DG of the hippocampus that is directly associated with Aβ plaques, the number of hippocampal neurons containing Aβ peptide, age, and cognitive decline.66 Newly born neurons are integrated into existing circuitry and may have functional implications in the adult brain. Our previously mentioned findings describe electrophysiological data depicting LTP deficits of 3xTg-ADxTNF-RI/RII KO mice; if neurogenesis was unaltered, it is unlikely that the differentiation and maturation of those neurons would develop into functional cells because multiple extrinsic and intrinsic factors affect this process. Some of these essential factors are perturbed in the setting of AD. For example, Wnt signaling is highly involved in adult neurogenesis, whereby β-catenin is required for neuroprogenitor proliferation and glycogen synthase kinase-3β inhibition drives neuronal differentiation.67 However, in AD, this pathway is compromised because of the significantly elevated levels of glycogen synthase kinase-3β activity, resulting in β-catenin depletion.68 In addition, GABAergic transmission, which is also dysfunctional in AD, can negatively affect neuronal morphological features and function.69
Glial-derived factors are fundamental for the developmental refinement of synapses. Synaptogenesis is highly dependent on glial cell participation70,71; more specifically, astrocytes promote the formation and stability of synapses by releasing extracellular soluble factors, including thrombospondins72 and cholesterol.73 Microglial-secreted TNF-α may modulate hippocampal synaptic efficacy and strength through the up-regulation of glutamate-driven 2-amino-3-(5-methyl-3-oxo-1,2-oxazol-4-yl) propanoic acid (AMPA) receptors that are important in rapid synaptic transmission, and blocking TNF-α signaling consequently decreases AMPA receptor surface expression and synaptic strength.74 TNF-α–mediated regulation of AMPA receptor surface expression is finely tuned in an integrin-dependent manner. Cingolani et al75 have demonstrated that β3 integrin controls the strength of excitatory synapses by interacting with AMPA receptors and that TNF-α increases β3 integrin surface expression in hippocampal pyramidal neurons. TNF-α may also contribute to a phenomenon called synaptic scaling during development, a regulatory form of plasticity. Homeostatic synaptic scaling occurs to stabilize neural networks by adjusting the strength of all synapses in a uniform manner. Glial cells are able to detect changes in neuronal network activity levels. Moreover, in response to activity deprivation, glial-derived TNF-α modulates the excitation of neurons and results in scaling up, and mice lacking TNF-α exhibit deficient synaptic scaling in response to blocking neural activity over an extended period.76 In addition, neuronal TNF receptor signaling may afford neuroprotective benefits at the synapse. Albensi and Mattson77 reported that TNF receptor knockout mice have impaired hippocampal CA1 LTD after low-frequency stimulation of the Schaffer collateral axons, and this process may depend on NF-κβ signaling activity because κβ decoy DNA attenuated induction of LTP and LTD. One possible mechanism by which TNF-α may promote synaptic plasticity is by regulating calcium and glutamate responses; in the setting of AD, TNF-α pretreatment prevented Aβ-induced neuronal toxicity in vitro by suppressing intracellular calcium responses to glutamate.78,79 Furthermore, TNF receptor–deficient mice exhibit increased neuronal vulnerability and oxidative stress and reduced antioxidant enzyme levels during brain injury induced by cerebral ischemia and epileptic seizures, suggesting that TNF-α protects neurons from injury-induced excitotoxicity and ischemia by up-regulating antioxidant signaling.80 Similarly, TNF-α stimulates manganese superoxide dismutase activity, resulting in reduced superoxide levels and increased stabilization of the mitochondrial transmembrane potential, ultimately allowing for more injury-resistant neurons.81 In aggregate, these findings indicate that global ablation of TNF-α receptor expression may have developmental and functional consequences that alter neural network function/activity, which would go undetected by gross quantitative analyses of Nissl-stained brain tissue, as performed in our current study.
Cytokines perform regulatory functions in hematopoietic differentiation and proliferation by evoking stimulatory and inhibitory effects.82,83 TNF-α exhibits bifunctional roles in hematopoietic development by harboring both negative and positive regulatory capacities.84,85 Direct inhibition is exerted by TNF-α to effect hematopoietic bone marrow progenitors, whereby TNF-α down-regulates high-affinity receptor expression to a potent growth factor involved in the development of blood cells called colony-stimulating factors.86 Furthermore, TNF-α has inhibited stem cell factor, another important hematopoietic regulator of cell proliferation and differentiation of myeloid progenitors.87 In concert with other cytokines, TNF-α is able to potentiate to a high degree the proliferation of primitive adult hematopoietic progenitors and block the inhibitory functions of transforming growth factor-β, suggesting that under stressful conditions during hematopoietic development, TNF-α prevents transforming growth factor-β inhibition and thereby allows for the maturation of early progenitor cells in response to the need for additional adult blood cells.88 Following a similar concept, TNF-α precipitates stimulatory effects indirectly by inducing the production of hematopoietic growth factors, including IL-689 and IL-1,90 that, in turn, promote colony-stimulating factor receptor expression86 and hematopoietic cell proliferation. We have demonstrated that at the age of 2 months, there are no statistically discernible differences in the numbers of microglia between 3xTg-AD and 3xTg-ADxTNF-RI/RII KO mice and that 6-month-old 3xTg-AD mice harbor elevated numbers of Iba1-positive microglia (Figure 4B). However, microglia are of myeloid origin, being derived from hematopoietic stem cell progenitors; because of the involvement of TNF-α in hematopoietic development, there is a possibility that microglial cell population compositions are shifted in 3xTg-ADxTNF-RI/RII KO mice compared with TNF-RI/RII–expressing 3xTg-AD counterparts. Hence, 3xTg-ADxTNF-RI/RII KO mice may be born with altered numbers or phenotypically distinct microglia compared with 3xTg-AD mice. Because we did not detect any changes in the total number of microglia at early ages, it may be that compensatory mechanisms are engaged to reconcile for the lack of TNF-α receptors, resulting in comparable microglial numbers at the age of 2 months between the two genotypes.
In addition to the up-regulation of TNF-α in AD, other pro-inflammatory cytokines have been associated with AD pathophysiological features, including IL-1β, IL-6, and IL-8.1 Although much research has focused on the detrimental contributions of these inflammatory molecules to AD, pro-inflammatory cytokines may play protective roles during certain stages of the disease. For example, IL-1β is a regulatory cytokine that is up-regulated in the cerebral cortex of the AD brain.91 In a human APP and PS1 mouse model of AD, IL-1β was overexpressed in a regional and time-dependent manner, resulting in an increase of GFAP- and Iba1-positive cells, with a concurrent reduction in plaque deposition and insoluble Aβ levels.92 These data imply that early IL-1β overexpression results in a beneficial and protective effect and that IL-1β may be required at certain stages of AD to reduce amyloid deposition. Similarly, early overexpression of IL-6, another pleiotropic pro-inflammatory cytokine elevated in patients with AD, in APP transgenic TgCRND8 and Tg2576 mice induces enhanced gliosis and decreased Aβ pathological features.93 Furthermore, the same group demonstrated increased microglial phagocytosis and elevated phagocytic marker expression, concluding that IL-6 promotes Aβ clearance mediated by microglial phagocytosis. Our results indicate that abrogation of TNF-α receptor signaling over a protracted period intensifies extracellular Aβ deposition, whereby 3xTg-ADxTNF-RI/RII KO mice have elevated soluble Aβ42, insoluble Aβ40, and insoluble Aβ42 protein levels (Figure 6, E–G). Further examination of the soluble Aβ42 fraction demonstrated that 6-month-old 3xTg-ADxTNF-RI/RII KO mice harbor an increase in Aβ oligomers (Figure 6H), which are the more toxic Aβ species associated with neurodegeneration and dementia and correlate with synaptic loss and cognitive decline.94–96 Moreover, 3xTg-ADxTNF-RI/RII KO mice at the age of 15 months also developed an increase in congophilic Aβ fibrils indicative of more dense cored plaques compared with 3xTg-AD mice (Figure 6, I–K). These results suggest that, at earlier stages of AD progression, intact TNF-α signaling, at least in one or more cell types, may be beneficial in postponing the development of overt Aβ-related pathological features.
NFTs containing PHFs represent the second cardinal lesion found in the AD brain. PHFs assemble from aberrantly hyperphosphorylated tau, a microtubule-associated protein involved in stabilizing the axonal transport tracks during normal physiological processes.44,97,98 Upon hyperphosphorylation, tau is less able to bind and stabilize microtubules, leading to self-aggregation of tau into PHFs, cellular transport defects, synapse dysfunction, cognitive decline, and neuronal death.99,100 Mounting evidence indicates that abnormal tau phosphorylation is a key contributor to AD pathogenesis. In fact, phosphorylated tau at Ser231 and Ser235 is elevated in the cerebrospinal fluid of patients with mild cognitive impairment who eventually developed AD.101 Other studies have reported that people without cognitive impairment had reduced parahippocampal NFT and neuropil threads compared with patients exhibiting mild cognitive impairment or AD and that NFT pathological features and episodic memory deficits significantly correlated.102 Our data demonstrate that 3xTg-ADxTNF-RI/RII KO mice have accelerated PHF pathological features at the age of 15 months compared with 3xTg-AD mice, whereby considerable PHF pathological features are not reported until the age of 26 months.31 These data suggest that TNF-α signaling, via engagement of TNF-RI and/or TNF-RII, is required to delay PHF aggregation and assembly. This is relevant because neuronal death and tangle pathological features appear to be better correlates of disease severity and cognitive dysfunction than amyloid plaque deposition.103,104
Symptom-ameliorating strategies for AD have shown limited clinical benefit, and no long-term disease-modifying strategies for the treatment of this progressive and debilitating disease exist. Symptomatic pharmacological options for patients with AD include acetyl-cholinesterase inhibitors or competitive blockers to glutamatergic NMDA receptors with memantine.105,106 Unfortunately, such treatments exhibit only clinically marginal cognitive and functional improvements.107,108 Furthermore, in contrast to previous epidemiological studies,109 prospective randomized research has not demonstrated major disease-ameliorating effects for other agents, including nonsteroidal anti-inflammatory drugs, estrogen, HMG-CoA reductase inhibitors, or tocopherol. Recently, transient suppression of TNF-α signaling has attracted some attention as a potential therapeutic strategy for the treatment of AD. Efforts have included short-term phase clearing of TNF-α using specific TNF-α decoy receptors, which have shown cognitive improvements in open-label phase 1 trials.27 Our current work directly addresses the potential negative ramifications of long-term use of TNF-α antagonists to intercede in AD pathogenesis. We demonstrate that long-term suppression of TNF-α receptor signaling without cell type or stage specificity may suppress the ability of microglia to effectively clear accumulating Aβ peptides, thereby leading to an unintended increase in neurotoxic Aβ oligomers, amyloid deposition, and NFT pathological features. Taken together, these findings provide the foundation for developing therapeutic strategies that modulate TNF-related signaling processes in specific brain-resident cell populations whose selection may differ depending on the stage of disease targeted.
Acknowledgments
We thank Dr. Frank LaFerla (University of California, Irvine) for providing breeding pairs of 3xTg-AD mice, Louis Lotta, Jr. (University of Rochester), for animal husbandry and care, Dr. Linda Callahan (University of Rochester) for microscopy advice, Dr. William Klein (Northwestern University) for the Nu-4 antibody, Dr. Peter Davies (Albert Einstein College of Medicine) for the PHF-1 antibody, Dr. Takashi Matozaki (Gunma University, Gunma, Japan) for the SIRP-β1 antibody, Dr. Colin K. Combs (University of North Dakota) for phagocytosis assay protocols and advice, Rita Giuliano (University of Rochester) for her expertise and advice in primary cell culture, and Dr. Hans Dringenberg and Peter Gagolewicz (Queen's University, ON, Canada) for providing equipment and technical support for the LTP experiments.
Footnotes
Supported by grants from the NIH (F31-AG038063 to S.L.M. and R01-AG023593 and R01-AG026328 to W.J.B.).
References
- 1.Akiyama H., Barger S., Barnum S., Bradt B., Bauer J., Cole G.M. Inflammation and Alzheimer's disease. Neurobiol Aging. 2000;21:383–421. doi: 10.1016/s0197-4580(00)00124-x. [DOI] [PMC free article] [PubMed] [Google Scholar]
- 2.McGeer E.G., McGeer P.L. Inflammatory processes in Alzheimer's disease. Prog Neuropsychopharmacol Biol Psychiatry. 2003;27:741–749. doi: 10.1016/S0278-5846(03)00124-6. [DOI] [PubMed] [Google Scholar]
- 3.Meda L., Cassatella M.A., Szendrei G.I., Otvos L., Jr, Baron P., Villalba M., Ferrari D., Rossi F. Activation of microglial cells by beta-amyloid protein and interferon-gamma. Nature. 1995;374:647–650. doi: 10.1038/374647a0. [DOI] [PubMed] [Google Scholar]
- 4.Huberman M., Shalit F., Roth-Deri I., Gutman B., Brodie C., Kott E., Sredni B. Correlation of cytokine secretion by mononuclear cells of Alzheimer patients and their disease stage. J Neuroimmunol. 1994;52:147–152. doi: 10.1016/0165-5728(94)90108-2. [DOI] [PubMed] [Google Scholar]
- 5.Motta M., Imbesi R., Di Rosa M., Stivala F., Malaguarnera L. Altered plasma cytokine levels in Alzheimer's disease: correlation with the disease progression. Immunol Lett. 2007;114:46–51. doi: 10.1016/j.imlet.2007.09.002. [DOI] [PubMed] [Google Scholar]
- 6.Lee K.S., Chung J.H., Choi T.K., Suh S.Y., Oh B.H., Hong C.H. Peripheral cytokines and chemokines in Alzheimer's disease. Dement Geriatr Cogn Disord. 2009;28:281–287. doi: 10.1159/000245156. [DOI] [PubMed] [Google Scholar]
- 7.Parachikova A., Agadjanyan M.G., Cribbs D.H., Blurton-Jones M., Perreau V., Rogers J., Beach T.G., Cotman C.W. Inflammatory changes parallel the early stages of Alzheimer disease. Neurobiol Aging. 2007;28:1821–1833. doi: 10.1016/j.neurobiolaging.2006.08.014. [DOI] [PMC free article] [PubMed] [Google Scholar]
- 8.Fillit H., Ding W.H., Buee L., Kalman J., Altstiel L., Lawlor B., Wolf-Klein G. Elevated circulating tumor necrosis factor levels in Alzheimer's disease. Neurosci Lett. 1991;129:318–320. doi: 10.1016/0304-3940(91)90490-k. [DOI] [PubMed] [Google Scholar]
- 9.Dickson D.W. The pathogenesis of senile plaques. J Neuropathol Exp Neurol. 1997;56:321–339. doi: 10.1097/00005072-199704000-00001. [DOI] [PubMed] [Google Scholar]
- 10.Paganelli R., Di Iorio A., Patricelli L., Ripani F., Sparvieri E., Faricelli R., Iarlori C., Porreca E., Di Gioacchino M., Abate G. Proinflammatory cytokines in sera of elderly patients with dementia: levels in vascular injury are higher than those of mild-moderate Alzheimer's disease patients. Exp Gerontol. 2002;37:257–263. doi: 10.1016/s0531-5565(01)00191-7. [DOI] [PubMed] [Google Scholar]
- 11.Takeuchi H., Jin S., Wang J., Zhang G., Kawanokuchi J., Kuno R., Sonobe Y., Mizuno T., Suzumura A. Tumor necrosis factor-alpha induces neurotoxicity via glutamate release from hemichannels of activated microglia in an autocrine manner. J Biol Chem. 2006;281:21362–21368. doi: 10.1074/jbc.M600504200. [DOI] [PubMed] [Google Scholar]
- 12.Perini G., Della-Bianca V., Politi V., Della Valle G., Dal-Pra I., Rossi F., Armato U. Role of p75 neurotrophin receptor in the neurotoxicity by beta-amyloid peptides and synergistic effect of inflammatory cytokines. J Exp Med. 2002;195:907–918. doi: 10.1084/jem.20011797. [DOI] [PMC free article] [PubMed] [Google Scholar]
- 13.Medeiros R., Prediger R.D., Passos G.F., Pandolfo P., Duarte F.S., Franco J.L., Dafre A.L., Di Giunta G., Figueiredo C.P., Takahashi R.N., Campos M.M., Calixto J.B. Connecting TNF-alpha signaling pathways to iNOS expression in a mouse model of Alzheimer's disease: relevance for the behavioral and synaptic deficits induced by amyloid beta protein. J Neurosci. 2007;27:5394–5404. doi: 10.1523/JNEUROSCI.5047-06.2007. [DOI] [PMC free article] [PubMed] [Google Scholar]
- 14.Alkam T., Nitta A., Mizoguchi H., Saito K., Seshima M., Itoh A., Yamada K., Nabeshima T. Restraining tumor necrosis factor-alpha by thalidomide prevents the amyloid beta-induced impairment of recognition memory in mice. Behav Brain Res. 2008;189:100–106. doi: 10.1016/j.bbr.2007.12.014. [DOI] [PubMed] [Google Scholar]
- 15.Oddo S., Caccamo A., Kitazawa M., Tseng B.P., LaFerla F.M. Amyloid deposition precedes tangle formation in a triple transgenic model of Alzheimer's disease. Neurobiol Aging. 2003;24:1063–1070. doi: 10.1016/j.neurobiolaging.2003.08.012. [DOI] [PubMed] [Google Scholar]
- 16.Janelsins M.C., Mastrangelo M.A., Oddo S., LaFerla F.M., Federoff H.J., Bowers W.J. Early correlation of microglial activation with enhanced tumor necrosis factor-alpha and monocyte chemoattractant protein-1 expression specifically within the entorhinal cortex of triple transgenic Alzheimer's disease mice. J Neuroinflammation. 2005;2:23. doi: 10.1186/1742-2094-2-23. [DOI] [PMC free article] [PubMed] [Google Scholar]
- 17.McAlpine F.E., Lee J.K., Harms A.S., Ruhn K.A., Blurton-Jones M., Hong J., Das P., Golde T.E., LaFerla F.M., Oddo S., Blesch A., Tansey M.G. Inhibition of soluble TNF signaling in a mouse model of Alzheimer's disease prevents pre-plaque amyloid-associated neuropathology. Neurobiol Dis. 2009;34:163–177. doi: 10.1016/j.nbd.2009.01.006. [DOI] [PMC free article] [PubMed] [Google Scholar]
- 18.Janelsins M.C., Mastrangelo M.A., Park K.M., Sudol K.L., Narrow W.C., Oddo S., LaFerla F.M., Callahan L.M., Federoff H.J., Bowers W.J. Chronic neuron-specific tumor necrosis factor-alpha expression enhances the local inflammatory environment ultimately leading to neuronal death in 3xTg-AD mice. Am J Pathol. 2008;173:1768–1782. doi: 10.2353/ajpath.2008.080528. [DOI] [PMC free article] [PubMed] [Google Scholar]
- 19.Strohmeyer R., Rogers J. Molecular and cellular mediators of Alzheimer's disease inflammation. J Alzheimers Dis. 2001;3:131–157. doi: 10.3233/jad-2001-3118. [DOI] [PubMed] [Google Scholar]
- 20.Hanisch U.K. Microglia as a source and target of cytokines. Glia. 2002;40:140–155. doi: 10.1002/glia.10161. [DOI] [PubMed] [Google Scholar]
- 21.Chung C.Y., Seo H., Sonntag K.C., Brooks A., Lin L., Isacson O. Cell type-specific gene expression of midbrain dopaminergic neurons reveals molecules involved in their vulnerability and protection. Hum Mol Genet. 2005;14:1709–1725. doi: 10.1093/hmg/ddi178. [DOI] [PMC free article] [PubMed] [Google Scholar]
- 22.McCoy M.K., Tansey M.G. TNF signaling inhibition in the CNS: implications for normal brain function and neurodegenerative disease. J Neuroinflammation. 2008;5:45. doi: 10.1186/1742-2094-5-45. [DOI] [PMC free article] [PubMed] [Google Scholar]
- 23.Adcock I.M. Transcription factors as activators of gene transcription: aP-1 and NF-kappa B. Monaldi Arch Chest Dis. 1997;52:178–186. [PubMed] [Google Scholar]
- 24.Kronke M. Involvement of sphingomyelinases in TNF signaling pathways. Chem Phys Lipids. 1999;102:157–166. doi: 10.1016/s0009-3084(99)00084-5. [DOI] [PubMed] [Google Scholar]
- 25.Baud V., Liu Z.G., Bennett B., Suzuki N., Xia Y., Karin M. Signaling by proinflammatory cytokines: oligomerization of TRAF2 and TRAF6 is sufficient for JNK and IKK activation and target gene induction via an amino-terminal effector domain. Genes Dev. 1999;13:1297–1308. doi: 10.1101/gad.13.10.1297. [DOI] [PMC free article] [PubMed] [Google Scholar]
- 26.Tweedie D., Sambamurti K., Greig N.H. TNF-alpha inhibition as a treatment strategy for neurodegenerative disorders: new drug candidates and targets. Curr Alzheimer Res. 2007;4:378–385. doi: 10.2174/156720507781788873. [DOI] [PubMed] [Google Scholar]
- 27.Tobinick E., Gross H., Weinberger A., Cohen H. TNF-alpha modulation for treatment of Alzheimer's disease: a 6-month pilot study. MedGenMed. 2006;8:25. [PMC free article] [PubMed] [Google Scholar]
- 28.Oddo S., Caccamo A., Shepherd J.D., Murphy M.P., Golde T.E., Kayed R., Metherate R., Mattson M.P., Akbari Y., LaFerla F.M. Triple-transgenic model of Alzheimer's disease with plaques and tangles: intracellular Abeta and synaptic dysfunction. Neuron. 2003;39:409–421. doi: 10.1016/s0896-6273(03)00434-3. [DOI] [PubMed] [Google Scholar]
- 29.Pryhuber G.S., Huyck H.L., Bhagwat S., O'Reilly M.A., Finkelstein J.N., Gigliotti F., Wright T.W. Parenchymal cell TNF receptors contribute to inflammatory cell recruitment and respiratory failure in Pneumocystis carinii-induced pneumonia. J Immunol. 2008;181:1409–1419. doi: 10.4049/jimmunol.181.2.1409. [DOI] [PMC free article] [PubMed] [Google Scholar]
- 30.Paxinos G., Franklin K.B.J. 2nd ed. Academic Press; San Diego: 2001. The Mouse Brain Stereotaxic Coordinates; p. 296. [Google Scholar]
- 31.Mastrangelo M.A., Bowers W.J. Detailed immunohistochemical characterization of temporal and spatial progression of Alzheimer's disease-related pathologies in male triple-transgenic mice. BMC Neurosci. 2008;9:81. doi: 10.1186/1471-2202-9-81. [DOI] [PMC free article] [PubMed] [Google Scholar]
- 32.Ryan D.A., Mastrangelo M.A., Narrow W.C., Sullivan M.A., Federoff H.J., Bowers W.J. Abeta-directed single-chain antibody delivery via a serotype-1 AAV vector improves learning behavior and pathology in Alzheimer's disease mice. Mol Ther. 2010;18:1471–1481. doi: 10.1038/mt.2010.111. [DOI] [PMC free article] [PubMed] [Google Scholar]
- 33.Lambert M.P., Velasco P.T., Chang L., Viola K.L., Fernandez S., Lacor P.N., Khuon D., Gong Y., Bigio E.H., Shaw P., De Felice F.G., Krafft G.A., Klein W.L. Monoclonal antibodies that target pathological assemblies of Abeta. J Neurochem. 2007;100:23–35. doi: 10.1111/j.1471-4159.2006.04157.x. [DOI] [PubMed] [Google Scholar]
- 34.Bliss T.V., Lomo T. Long-lasting potentiation of synaptic transmission in the dentate area of the anaesthetized rabbit following stimulation of the perforant path. J Physiol. 1973;232:331–356. doi: 10.1113/jphysiol.1973.sp010273. [DOI] [PMC free article] [PubMed] [Google Scholar]
- 35.Koenigsknecht-Talboo J., Landreth G.E. Microglial phagocytosis induced by fibrillar beta-amyloid and IgGs are differentially regulated by proinflammatory cytokines. J Neurosci. 2005;25:8240–8249. doi: 10.1523/JNEUROSCI.1808-05.2005. [DOI] [PMC free article] [PubMed] [Google Scholar]
- 36.Liu Y., Walter S., Stagi M., Cherny D., Letiembre M., Schulz-Schaeffer W., Heine H., Penke B., Neumann H., Fassbender K. LPS receptor (CD14): a receptor for phagocytosis of Alzheimer's amyloid peptide. Brain. 2005;128:1778–1789. doi: 10.1093/brain/awh531. [DOI] [PubMed] [Google Scholar]
- 37.Gaikwad S., Larionov S., Wang Y., Dannenberg H., Matozaki T., Monsonego A., Thal D.R., Neumann H. Signal regulatory protein-beta1: a microglial modulator of phagocytosis in Alzheimer's disease. Am J Pathol. 2009;175:2528–2539. doi: 10.2353/ajpath.2009.090147. [DOI] [PMC free article] [PubMed] [Google Scholar]
- 38.Fiala M., Lin J., Ringman J., Kermani-Arab V., Tsao G., Patel A., Lossinsky A.S., Graves M.C., Gustavson A., Sayre J., Sofroni E., Suarez T., Chiappelli F., Bernard G. Ineffective phagocytosis of amyloid-beta by macrophages of Alzheimer's disease patients. J Alzheimers Dis. 2005;7:221–232. doi: 10.3233/jad-2005-7304. discussion 255–262. [DOI] [PubMed] [Google Scholar]
- 39.Simard A.R., Soulet D., Gowing G., Julien J.P., Rivest S. Bone marrow-derived microglia play a critical role in restricting senile plaque formation in Alzheimer's disease. Neuron. 2006;49:489–502. doi: 10.1016/j.neuron.2006.01.022. [DOI] [PubMed] [Google Scholar]
- 40.Wilkinson B., Koenigsknecht-Talboo J., Grommes C., Lee C.Y., Landreth G. Fibrillar beta-amyloid-stimulated intracellular signaling cascades require Vav for induction of respiratory burst and phagocytosis in monocytes and microglia. J Biol Chem. 2006;281:20842–20850. doi: 10.1074/jbc.M600627200. [DOI] [PubMed] [Google Scholar]
- 41.Koenigsknecht J., Landreth G. Microglial phagocytosis of fibrillar beta-amyloid through a beta1 integrin-dependent mechanism. J Neurosci. 2004;24:9838–9846. doi: 10.1523/JNEUROSCI.2557-04.2004. [DOI] [PMC free article] [PubMed] [Google Scholar]
- 42.Cameron B., Landreth G.E. Inflammation, microglia, and Alzheimer's disease. Neurobiol Dis. 2010;37:503–509. doi: 10.1016/j.nbd.2009.10.006. [DOI] [PMC free article] [PubMed] [Google Scholar]
- 43.Weingarten M.D., Lockwood A.H., Hwo S.Y., Kirschner M.W. A protein factor essential for microtubule assembly. Proc Natl Acad Sci U S A. 1975;72:1858–1862. doi: 10.1073/pnas.72.5.1858. [DOI] [PMC free article] [PubMed] [Google Scholar]
- 44.Grundke-Iqbal I., Iqbal K., Tung Y.C., Quinlan M., Wisniewski H.M., Binder L.I. Abnormal phosphorylation of the microtubule-associated protein tau (tau) in Alzheimer cytoskeletal pathology. Proc Natl Acad Sci U S A. 1986;83:4913–4917. doi: 10.1073/pnas.83.13.4913. [DOI] [PMC free article] [PubMed] [Google Scholar]
- 45.Alonso A.C., Zaidi T., Grundke-Iqbal I., Iqbal K. Role of abnormally phosphorylated tau in the breakdown of microtubules in Alzheimer disease. Proc Natl Acad Sci U S A. 1994;91:5562–5566. doi: 10.1073/pnas.91.12.5562. [DOI] [PMC free article] [PubMed] [Google Scholar]
- 46.Wang Q., Wu J., Rowan M.J., Anwyl R. Beta-amyloid inhibition of long-term potentiation is mediated via tumor necrosis factor. Eur J Neurosci. 2005;22:2827–2832. doi: 10.1111/j.1460-9568.2005.04457.x. [DOI] [PubMed] [Google Scholar]
- 47.Cummings J.A., Mulkey R.M., Nicoll R.A., Malenka R.C. Ca2+ signaling requirements for long-term depression in the hippocampus. Neuron. 1996;16:825–833. doi: 10.1016/s0896-6273(00)80102-6. [DOI] [PubMed] [Google Scholar]
- 48.Mulkey R.M., Endo S., Shenolikar S., Malenka R.C. Involvement of a calcineurin/inhibitor-1 phosphatase cascade in hippocampal long-term depression. Nature. 1994;369:486–488. doi: 10.1038/369486a0. [DOI] [PubMed] [Google Scholar]
- 49.Selkoe D.J. Soluble oligomers of the amyloid beta-protein impair synaptic plasticity and behavior. Behav Brain Res. 2008;192:106–113. doi: 10.1016/j.bbr.2008.02.016. [DOI] [PMC free article] [PubMed] [Google Scholar]
- 50.Yamin G. NMDA receptor-dependent signaling pathways that underlie amyloid beta-protein disruption of LTP in the hippocampus. J Neurosci Res. 2009;87:1729–1736. doi: 10.1002/jnr.21998. [DOI] [PubMed] [Google Scholar]
- 51.Griffin R., Nally R., Nolan Y., McCartney Y., Linden J., Lynch M.A. The age-related attenuation in long-term potentiation is associated with microglial activation. J Neurochem. 2006;99:1263–1272. doi: 10.1111/j.1471-4159.2006.04165.x. [DOI] [PubMed] [Google Scholar]
- 52.Rachal Pugh C., Fleshner M., Watkins L.R., Maier S.F., Rudy J.W. The immune system and memory consolidation: a role for the cytokine IL-1beta. Neurosci Biobehav Rev. 2001;25:29–41. doi: 10.1016/s0149-7634(00)00048-8. [DOI] [PubMed] [Google Scholar]
- 53.Murray C.A., Lynch M.A. Evidence that increased hippocampal expression of the cytokine interleukin-1 beta is a common trigger for age- and stress-induced impairments in long-term potentiation. J Neurosci. 1998;18:2974–2981. doi: 10.1523/JNEUROSCI.18-08-02974.1998. [DOI] [PMC free article] [PubMed] [Google Scholar]
- 54.Barker V., Middleton G., Davey F., Davies A.M. TNFalpha contributes to the death of NGF-dependent neurons during development. Nat Neurosci. 2001;4:1194–1198. doi: 10.1038/nn755. [DOI] [PubMed] [Google Scholar]
- 55.Golan H., Levav T., Mendelsohn A., Huleihel M. Involvement of tumor necrosis factor alpha in hippocampal development and function. Cereb Cortex. 2004;14:97–105. doi: 10.1093/cercor/bhg108. [DOI] [PubMed] [Google Scholar]
- 56.Ashkenazi A., Dixit V.M. Death receptors: signaling and modulation. Science. 1998;281:1305–1308. doi: 10.1126/science.281.5381.1305. [DOI] [PubMed] [Google Scholar]
- 57.Fontaine V., Mohand-Said S., Hanoteau N., Fuchs C., Pfizenmaier K., Eisel U. Neurodegenerative and neuroprotective effects of tumor necrosis factor (TNF) in retinal ischemia: opposite roles of TNF receptor 1 and TNF receptor 2. J Neurosci. 2002;22:RC216. doi: 10.1523/JNEUROSCI.22-07-j0001.2002. [DOI] [PMC free article] [PubMed] [Google Scholar]
- 58.Marchetti L., Klein M., Schlett K., Pfizenmaier K., Eisel U.L. Tumor necrosis factor (TNF)-mediated neuroprotection against glutamate-induced excitotoxicity is enhanced by N-methyl-D-aspartate receptor activation: essential role of a TNF receptor 2-mediated phosphatidylinositol 3-kinase-dependent NF-kappa B pathway. J Biol Chem. 2004;279:32869–32881. doi: 10.1074/jbc.M311766200. [DOI] [PubMed] [Google Scholar]
- 59.Iosif R.E., Ekdahl C.T., Ahlenius H., Pronk C.J., Bonde S., Kokaia Z., Jacobsen S.E., Lindvall O. Tumor necrosis factor receptor 1 is a negative regulator of progenitor proliferation in adult hippocampal neurogenesis. J Neurosci. 2006;26:9703–9712. doi: 10.1523/JNEUROSCI.2723-06.2006. [DOI] [PMC free article] [PubMed] [Google Scholar]
- 60.Dong H., Goico B., Martin M., Csernansky C.A., Bertchume A., Csernansky J.G. Modulation of hippocampal cell proliferation, memory, and amyloid plaque deposition in APPsw (Tg2576) mutant mice by isolation stress. Neuroscience. 2004;127:601–609. doi: 10.1016/j.neuroscience.2004.05.040. [DOI] [PubMed] [Google Scholar]
- 61.Donovan M.H., Yazdani U., Norris R.D., Games D., German D.C., Eisch A.J. Decreased adult hippocampal neurogenesis in the PDAPP mouse model of Alzheimer's disease. J Comp Neurol. 2006;495:70–83. doi: 10.1002/cne.20840. [DOI] [PubMed] [Google Scholar]
- 62.Haughey N.J., Nath A., Chan S.L., Borchard A.C., Rao M.S., Mattson M.P. Disruption of neurogenesis by amyloid beta-peptide, and perturbed neural progenitor cell homeostasis, in models of Alzheimer's disease. J Neurochem. 2002;83:1509–1524. doi: 10.1046/j.1471-4159.2002.01267.x. [DOI] [PubMed] [Google Scholar]
- 63.Feng R., Rampon C., Tang Y.P., Shrom D., Jin J., Kyin M., Sopher B., Miller M.W., Ware C.B., Martin G.M., Kim S.H., Langdon R.B., Sisodia S.S., Tsien J.Z. Deficient neurogenesis in forebrain-specific presenilin-1 knockout mice is associated with reduced clearance of hippocampal memory traces. Neuron. 2001;32:911–926. doi: 10.1016/s0896-6273(01)00523-2. [DOI] [PubMed] [Google Scholar]
- 64.Wen P.H., Shao X., Shao Z., Hof P.R., Wisniewski T., Kelley K., Friedrich V.L., Jr, Ho L., Pasinetti G.M., Shioi J., Robakis N.K., Elder G.A. Overexpression of wild type but not an FAD mutant presenilin-1 promotes neurogenesis in the hippocampus of adult mice. Neurobiol Dis. 2002;10:8–19. doi: 10.1006/nbdi.2002.0490. [DOI] [PubMed] [Google Scholar]
- 65.Wang R., Dineley K.T., Sweatt J.D., Zheng H. Presenilin 1 familial Alzheimer's disease mutation leads to defective associative learning and impaired adult neurogenesis. Neuroscience. 2004;126:305–312. doi: 10.1016/j.neuroscience.2004.03.048. [DOI] [PubMed] [Google Scholar]
- 66.Rodriguez J.J., Jones V.C., Tabuchi M., Allan S.M., Knight E.M., LaFerla F.M., Oddo S., Verkhratsky A. Impaired adult neurogenesis in the dentate gyrus of a triple transgenic mouse model of Alzheimer's disease. PLoS One. 2008;3:e2935. doi: 10.1371/journal.pone.0002935. [DOI] [PMC free article] [PubMed] [Google Scholar]
- 67.Inestrosa N.C., Arenas E. Emerging roles of Wnts in the adult nervous system. Nat Rev Neurosci. 2010;11:77–86. doi: 10.1038/nrn2755. [DOI] [PubMed] [Google Scholar]
- 68.He P., Shen Y. Interruption of beta-catenin signaling reduces neurogenesis in Alzheimer's disease. J Neurosci. 2009;29:6545–6557. doi: 10.1523/JNEUROSCI.0421-09.2009. [DOI] [PMC free article] [PubMed] [Google Scholar]
- 69.Li G., Bien-Ly N., Andrews-Zwilling Y., Xu Q., Bernardo A., Ring K., Halabisky B., Deng C., Mahley R.W., Huang Y. GABAergic interneuron dysfunction impairs hippocampal neurogenesis in adult apolipoprotein E4 knockin mice. Cell Stem Cell. 2009;5:634–645. doi: 10.1016/j.stem.2009.10.015. [DOI] [PMC free article] [PubMed] [Google Scholar]
- 70.Haydon P.G. GLIA: listening and talking to the synapse. Nat Rev Neurosci. 2001;2:185–193. doi: 10.1038/35058528. [DOI] [PubMed] [Google Scholar]
- 71.Bezzi P., Domercq M., Brambilla L., Galli R., Schols D., De Clercq E., Vescovi A., Bagetta G., Kollias G., Meldolesi J., Volterra A. CXCR4-activated astrocyte glutamate release via TNFalpha: amplification by microglia triggers neurotoxicity. Nat Neurosci. 2001;4:702–710. doi: 10.1038/89490. [DOI] [PubMed] [Google Scholar]
- 72.Xu J., Xiao N., Xia J. Thrombospondin 1 accelerates synaptogenesis in hippocampal neurons through neuroligin 1. Nat Neurosci. 2010;13:22–24. doi: 10.1038/nn.2459. [DOI] [PubMed] [Google Scholar]
- 73.Mauch D.H., Nagler K., Schumacher S., Goritz C., Muller E.C., Otto A., Pfrieger F.W. CNS synaptogenesis promoted by glia-derived cholesterol. Science. 2001;294:1354–1357. doi: 10.1126/science.294.5545.1354. [DOI] [PubMed] [Google Scholar]
- 74.Beattie E.C., Stellwagen D., Morishita W., Bresnahan J.C., Ha B.K., Von Zastrow M., Beattie M.S., Malenka R.C. Control of synaptic strength by glial TNFalpha. Science. 2002;295:2282–2285. doi: 10.1126/science.1067859. [DOI] [PubMed] [Google Scholar]
- 75.Cingolani L.A., Thalhammer A., Yu L.M., Catalano M., Ramos T., Colicos M.A., Goda Y. Activity-dependent regulation of synaptic AMPA receptor composition and abundance by beta3 integrins. Neuron. 2008;58:749–762. doi: 10.1016/j.neuron.2008.04.011. [DOI] [PMC free article] [PubMed] [Google Scholar]
- 76.Stellwagen D., Malenka R.C. Synaptic scaling mediated by glial TNF-alpha. Nature. 2006;440:1054–1059. doi: 10.1038/nature04671. [DOI] [PubMed] [Google Scholar]
- 77.Albensi B.C., Mattson M.P. Evidence for the involvement of TNF and NF-kappaB in hippocampal synaptic plasticity. Synapse. 2000;35:151–159. doi: 10.1002/(SICI)1098-2396(200002)35:2<151::AID-SYN8>3.0.CO;2-P. [DOI] [PubMed] [Google Scholar]
- 78.Cheng B., Christakos S., Mattson M.P. Tumor necrosis factors protect neurons against metabolic-excitotoxic insults and promote maintenance of calcium homeostasis. Neuron. 1994;12:139–153. doi: 10.1016/0896-6273(94)90159-7. [DOI] [PubMed] [Google Scholar]
- 79.Barger S.W., Horster D., Furukawa K., Goodman Y., Krieglstein J., Mattson M.P. Tumor necrosis factors alpha and beta protect neurons against amyloid beta-peptide toxicity: evidence for involvement of a kappa B-binding factor and attenuation of peroxide and Ca2+ accumulation. Proc Natl Acad Sci U S A. 1995;92:9328–9332. doi: 10.1073/pnas.92.20.9328. [DOI] [PMC free article] [PubMed] [Google Scholar]
- 80.Bruce A.J., Boling W., Kindy M.S., Peschon J., Kraemer P.J., Carpenter M.K., Holtsberg F.W., Mattson M.P. Altered neuronal and microglial responses to excitotoxic and ischemic brain injury in mice lacking TNF receptors. Nat Med. 1996;2:788–794. doi: 10.1038/nm0796-788. [DOI] [PubMed] [Google Scholar]
- 81.Bruce-Keller A.J., Geddes J.W., Knapp P.E., McFall R.W., Keller J.N., Holtsberg F.W., Parthasarathy S., Steiner S.M., Mattson M.P. Anti-death properties of TNF against metabolic poisoning: mitochondrial stabilization by MnSOD. J Neuroimmunol. 1999;93:53–71. doi: 10.1016/s0165-5728(98)00190-8. [DOI] [PubMed] [Google Scholar]
- 82.Metcalf D. The molecular control of cell division, differentiation commitment and maturation in haemopoietic cells. Nature. 1989;339:27–30. doi: 10.1038/339027a0. [DOI] [PubMed] [Google Scholar]
- 83.Ogawa M. Differentiation and proliferation of hematopoietic stem cells. Blood. 1993;81:2844–2853. [PubMed] [Google Scholar]
- 84.Broxmeyer H.E., Williams D.E., Lu L., Cooper S., Anderson S.L., Beyer G.S., Hoffman R., Rubin B.Y. The suppressive influences of human tumor necrosis factors on bone marrow hematopoietic progenitor cells from normal donors and patients with leukemia: synergism of tumor necrosis factor and interferon-gamma. J Immunol. 1986;136:4487–4495. [PubMed] [Google Scholar]
- 85.Rusten L.S., Jacobsen F.W., Lesslauer W., Loetscher H., Smeland E.B., Jacobsen S.E. Bifunctional effects of tumor necrosis factor alpha (TNF alpha) on the growth of mature and primitive human hematopoietic progenitor cells: involvement of p55 and p75 TNF receptors. Blood. 1994;83:3152–3159. [PubMed] [Google Scholar]
- 86.Jacobsen S.E., Ruscetti F.W., Dubois C.M., Keller J.R. Tumor necrosis factor alpha directly and indirectly regulates hematopoietic progenitor cell proliferation: role of colony-stimulating factor receptor modulation. J Exp Med. 1992;175:1759–1772. doi: 10.1084/jem.175.6.1759. [DOI] [PMC free article] [PubMed] [Google Scholar]
- 87.Rusten L.S., Smeland E.B., Jacobsen F.W., Lien E., Lesslauer W., Loetscher H., Dubois C.M., Jacobsen S.E. Tumor necrosis factor-alpha inhibits stem cell factor-induced proliferation of human bone marrow progenitor cells in vitro: role of p55 and p75 tumor necrosis factor receptors. J Clin Invest. 1994;94:165–172. doi: 10.1172/JCI117303. [DOI] [PMC free article] [PubMed] [Google Scholar]
- 88.Snoeck H.W., Weekx S., Moulijn A., Lardon F., Lenjou M., Nys G., Van Ranst P.C., Van Bockstaele D.R., Berneman Z.N. Tumor necrosis factor alpha is a potent synergistic factor for the proliferation of primitive human hematopoietic progenitor cells and induces resistance to transforming growth factor beta but not to interferon gamma. J Exp Med. 1996;183:705–710. doi: 10.1084/jem.183.2.705. [DOI] [PMC free article] [PubMed] [Google Scholar]
- 89.Brouckaert P., Spriggs D.R., Demetri G., Kufe D.W., Fiers W. Circulating interleukin 6 during a continuous infusion of tumor necrosis factor and interferon gamma. J Exp Med. 1989;169:2257–2262. doi: 10.1084/jem.169.6.2257. [DOI] [PMC free article] [PubMed] [Google Scholar]
- 90.Nawroth P.P., Bank I., Handley D., Cassimeris J., Chess L., Stern D. Tumor necrosis factor/cachectin interacts with endothelial cell receptors to induce release of interleukin 1. J Exp Med. 1986;163:1363–1375. doi: 10.1084/jem.163.6.1363. [DOI] [PMC free article] [PubMed] [Google Scholar]
- 91.Casamenti F., Prosperi C., Scali C., Giovannelli L., Colivicchi M.A., Faussone-Pellegrini M.S., Pepeu G. Interleukin-1beta activates forebrain glial cells and increases nitric oxide production and cortical glutamate and GABA release in vivo: implications for Alzheimer's disease. Neuroscience. 1999;91:831–842. doi: 10.1016/s0306-4522(98)00680-0. [DOI] [PubMed] [Google Scholar]
- 92.Shaftel S.S., Kyrkanides S., Olschowka J.A., Miller J.N., Johnson R.E., O'Banion M.K. Sustained hippocampal IL-1 beta overexpression mediates chronic neuroinflammation and ameliorates Alzheimer plaque pathology. J Clin Invest. 2007;117:1595–1604. doi: 10.1172/JCI31450. [DOI] [PMC free article] [PubMed] [Google Scholar]
- 93.Chakrabarty P., Jansen-West K., Beccard A., Ceballos-Diaz C., Levites Y., Verbeeck C., Zubair A.C., Dickson D., Golde T.E., Das P. Massive gliosis induced by interleukin-6 suppresses Abeta deposition in vivo: evidence against inflammation as a driving force for amyloid deposition. FASEB J. 2010;24:548–559. doi: 10.1096/fj.09-141754. [DOI] [PMC free article] [PubMed] [Google Scholar]
- 94.Lesne S., Koh M.T., Kotilinek L., Kayed R., Glabe C.G., Yang A., Gallagher M., Ashe K.H. A specific amyloid-beta protein assembly in the brain impairs memory. Nature. 2006;440:352–357. doi: 10.1038/nature04533. [DOI] [PubMed] [Google Scholar]
- 95.Caughey B., Lansbury P.T. Protofibrils, pores, fibrils, and neurodegeneration: separating the responsible protein aggregates from the innocent bystanders. Annu Rev Neurosci. 2003;26:267–298. doi: 10.1146/annurev.neuro.26.010302.081142. [DOI] [PubMed] [Google Scholar]
- 96.Haasnoot W., du Pre J.G. Luminex-based triplex immunoassay for the simultaneous detection of soy, pea, and soluble wheat proteins in milk powder. J Agric Food Chem. 2007;55:3771–3777. doi: 10.1021/jf063281o. [DOI] [PubMed] [Google Scholar]
- 97.Kosik K.S., Joachim C.L., Selkoe D.J. Microtubule-associated protein tau (tau) is a major antigenic component of paired helical filaments in Alzheimer disease. Proc Natl Acad Sci U S A. 1986;83:4044–4048. doi: 10.1073/pnas.83.11.4044. [DOI] [PMC free article] [PubMed] [Google Scholar]
- 98.Grundke-Iqbal I., Iqbal K., Quinlan M., Tung Y.C., Zaidi M.S., Wisniewski H.M. Microtubule-associated protein tau: a component of Alzheimer paired helical filaments. J Biol Chem. 1986;261:6084–6089. [PubMed] [Google Scholar]
- 99.Mudher A., Shepherd D., Newman T.A., Mildren P., Jukes J.P., Squire A., Mears A., Drummond J.A., Berg S., MacKay D., Asuni A.A., Bhat R., Lovestone S. GSK-3beta inhibition reverses axonal transport defects and behavioural phenotypes in Drosophila. Mol Psychiatry. 2004;9:522–530. doi: 10.1038/sj.mp.4001483. [DOI] [PubMed] [Google Scholar]
- 100.Chee F.C., Mudher A., Cuttle M.F., Newman T.A., MacKay D., Lovestone S., Shepherd D. Over-expression of tau results in defective synaptic transmission in Drosophila neuromuscular junctions. Neurobiol Dis. 2005;20:918–928. doi: 10.1016/j.nbd.2005.05.029. [DOI] [PubMed] [Google Scholar]
- 101.Arai H., Ishiguro K., Ohno H., Moriyama M., Itoh N., Okamura N., Matsui T., Morikawa Y., Horikawa E., Kohno H., Sasaki H., Imahori K. CSF phosphorylated tau protein and mild cognitive impairment: a prospective study. Exp Neurol. 2000;166:201–203. doi: 10.1006/exnr.2000.7501. [DOI] [PubMed] [Google Scholar]
- 102.Mitchell T.W., Mufson E.J., Schneider J.A., Cochran E.J., Nissanov J., Han L.Y., Bienias J.L., Lee V.M., Trojanowski J.Q., Bennett D.A., Arnold S.E. Parahippocampal tau pathology in healthy aging, mild cognitive impairment, and early Alzheimer's disease. Ann Neurol. 2002;51:182–189. doi: 10.1002/ana.10086. [DOI] [PubMed] [Google Scholar]
- 103.Arriagada P.V., Growdon J.H., Hedley-Whyte E.T., Hyman B.T. Neurofibrillary tangles but not senile plaques parallel duration and severity of Alzheimer's disease. Neurology. 1992;42:631–639. doi: 10.1212/wnl.42.3.631. [DOI] [PubMed] [Google Scholar]
- 104.Gomez-Isla T., Hollister R., West H., Mui S., Growdon J.H., Petersen R.C., Parisi J.E., Hyman B.T. Neuronal loss correlates with but exceeds neurofibrillary tangles in Alzheimer's disease. Ann Neurol. 1997;41:17–24. doi: 10.1002/ana.410410106. [DOI] [PubMed] [Google Scholar]
- 105.Areosa S.A., Sherriff F., McShane R. Memantine for dementia. Cochrane Database Syst Rev. 2005;(3) doi: 10.1002/14651858.CD003154.pub3. CD003154. [DOI] [PubMed] [Google Scholar]
- 106.Birks J., Harvey R.J. Donepezil for dementia due to Alzheimer's disease. Cochrane Database Syst Rev. 2006;(1) doi: 10.1002/14651858.CD001190.pub2. CD001190. [DOI] [PubMed] [Google Scholar]
- 107.Trinh N.H., Hoblyn J., Mohanty S., Yaffe K. Efficacy of cholinesterase inhibitors in the treatment of neuropsychiatric symptoms and functional impairment in Alzheimer disease: a meta-analysis. JAMA. 2003;289:210–216. doi: 10.1001/jama.289.2.210. [DOI] [PubMed] [Google Scholar]
- 108.Lanctôt K.L., Herrmann N., Yau K.K., Khan L.R., Liu B.A., LouLou M.M., Einarson T.R. Efficacy and safety of cholinesterase inhibitors in Alzheimer's disease: a meta-analysis. CMAJ. 2003;169:557–564. [PMC free article] [PubMed] [Google Scholar]
- 109.Hull M., Berger M., Heneka M. Disease-modifying therapies in Alzheimer's disease: how far have we come? Drugs. 2006;66:2075–2093. doi: 10.2165/00003495-200666160-00004. [DOI] [PubMed] [Google Scholar]