

Abstract
In the present study, we hypothesized that HIV-1–induced occult HIV-associated nephropathy (HIVAN) would become apparent in the presence of adverse host factors. To test our hypothesis, Vpr mice (which display doxycycline-dependent Vpr expression in podocytes) with two, three, and four copies of the angiotensinogen (Agt) gene (Vpr-Agt-2, Vpr-Agt-3, and Vpr-Agt-4) were administered doxycycline for 3 weeks (to develop clinically occult HIVAN) followed by doxycycline-free water during the next 3 weeks. Subsequently, renal biomarkers were measured, and kidneys were harvested for renal histology. Vpr-Agt-2 developed neither proteinuria nor elevated blood pressure, and displayed minimal glomerular and tubular lesions only, without any microcyst formation. Vpr-Agt-3 showed mild glomerular and tubular lesions and microcyst formation, whereas Vpr-Agt-4 showed moderate proteinuria, hypertension, glomerular sclerosis, tubular dilation, microcysts, and expression of epithelial mesenchymal transition markers. Vpr-Agt-4 not only displayed enhanced renal tissue expression of Agt, renin, and angiotensin-converting enzyme, but also had higher renal tissue concentrations of angiotensin II. Moreover, renal cells in Vpr-Agt-4 showed enhanced expression of transforming growth factor-β, connective tissue growth factor, and vascular endothelial growth factor. These findings indicate that adverse host factors, such as the activation of the renin-angiotensin system, promote the progression of occult HIVAN to apparent HIVAN.
HIV-associated nephropathy (HIVAN) is an important complication of HIV-1 infection in patients of African-American background.1–3 It is characterized by focal glomerulosclerosis and microcystic dilation of tubules.4 Renal biopsy data suggested that HIV-1 infection of glomerular and tubular cells contributed to HIVAN phenotype.5 Since the advent of highly active anti-retroviral therapy (HAART), many patients with HIV-1 infection are able to achieve undetectable viral load and, even those that do not, live a normal life span; on that account, we hypothesized that patients with HIV-1 infection might acquire renal cell HIV-1 expression during the period of higher viral load, and these patients might develop apparent kidney lesions in the later time period, during the presence of adverse host factors, such as the activation of the renin-angiotensin system (RAS).6–8 In addition, patients with HIV-1 infection are increasingly prone to develop hypertension, diabetes, and obesity as they age.9–12 Because diabetes and hypertension are the commonest causes of glomerulosclerosis in patients of African-American background, these patients would be prone to display glomerulosclerosis if they developed HIV infection, too.13–15 In the absence of kidney biopsy, at times it may be difficult to differentiate clinically the exact etiology of proteinuria in these patients.
Podocyte injury has been considered to be a key event in the development of both classical and collapsing variant of focal glomerular sclerosis.16 Podocyte HIV-1 infection has been reported in patients with HIVAN.17 Several investigators have demonstrated that podocyte expression of an individual protein is sufficient to initiate the development of focal glomerulosclerosis.18 In a scenario where HIV-1 had invoked podocyte HIV-1 protein expression (before the administration of HAART), podocytes will continue to express HIV-1 proteins (being a terminally differentiated cell) despite undetectable viral load (as a consequence of HAART), because current antiviral therapy inhibits viral replication only, but does not attenuate the expression of pre-existing cellular proteins. Since occurrence of HIVAN requires presence of specific genetic, environmental, and host factors, mere podocyte expression of HIV-1 protein (environmental factor) and genetic background (African ancestry) may not be sufficient to invoke the HIVAN phenotype.17 We hypothesized that manifestation of HIVAN phenotype, in this scenario, will also requires specific host factors, such as activation of the RAS, along with genetic and environmental factors.19 To test our hypothesis, we have used the Vpr mouse model of HIVAN (having the murine strain FVB/N as its genetic background), in which podocyte expression of Vpr (environmental factor) is evaluated for the progression of occult HIVAN to apparent HIVAN phenotype in the presence or absence of the specific host factors. To promote endogenous activation of the RAS in Vpr mice, we have used Vpr mice with variable (two, three, and four) copies of angiotensinogen. Since epithelial mesenchymal transition (EMT) has been demonstrated to play an important role in the progression of kidney fibrosis, we studied renal tissue molecular markers of EMT in Vpr mice.
Materials and Methods
Vpr Mice
Breeding pairs of FVB/N were obtained from Jackson Laboratories (Bar Harbor, ME). Breeding pairs to develop Vpr colonies were kindly provided by Prof. Jeffery B. Kopp, National Institutes of Health, Bethesda, MD. We have generated Vpr transgenic animals by crossing podocin/rtTA (constitutively expresses the rtTA, which is a fusion protein comprised of the TetR repressor and the VP16 transactivation domain expressed under control of the podocin promoter) mice with tetop/Vpr mice (TRE-regulated Vpr gene). These animals were fed doxycycline in their drinking water to induce the expression of the podocyte-specific Vpr gene. These animals develop apparent HIVAN phenotype only after 6 weeks of doxycycline administration. We have used two descriptive terms to describe the presence (apparent) or absence (occult) of proteinuria and high blood pressure to identify HIVAN, with the presumption that if Vpr mice developed any renal disease, it was going to be HIVAN. We observed that after 3 weeks of doxycycline administration, Vpr mice developed either no or minimal renal lesions with absence of abnormal proteinuria and blood pressure levels. We called these renal lesions occult HIVAN; on the other hand, when Vpr mice developed abnormal proteinuria and blood pressure, we called it apparent HIVAN. The Ethics Review Committee for Animal Experimentation of the Feinstein Institute for Medical Research approved the experimental protocol.
Experimental Approach
Unlike the pharmacological modulation of angiotensin II (Ang II) carried out in previous studies, we have genetically modulated the levels of Ang II, which helps to obviate the additional, unwanted effects of the pharmacological agents other than their effect on the RAS. In the present study, we have used a genetically engineered mouse model (Vpr mice) to study the role of the RAS activation in the progression of occult HIVAN to apparent HIVAN. To develop apparent HIVAN phenotype, Vpr mice required 6 weeks of doxycycline treatment. Since Vpr mice developed occult HIVAN (only minimal renal lesions, no proteinuria and blood pressure) only after 3 weeks of doxycycline therapy, we have stopped doxycycline therapy after 3 weeks in all of the groups (protocol C). Blood pressure remained the same.
Agt Transgenic Mice
We obtained Agtdup/Agtdup mice from the Jackson Laboratories. Since these mice were not on an FVB/N background, we have bred them with FVB/N for eight generations. Homozygous Agt mice (Agtdup/Agtdup) are viable and fertile. They show blood pressure levels ∼16 mm Hg higher than their normal wild-type siblings (Agt+/Agt+). Heterozygous mice (Agt+/Agtdup) show blood pressure levels ∼8 mm Hg higher than their normal wild-type siblings. This transgenic mouse model demonstrates the causality between genotype at the angiotensinogen locus and blood pressures. Blood pressures of one-copy (Agttm1Unc/+) through four-copy (Agtdup/Agtdup) animals show significant and almost linear increases of approximately 8 mm Hg per gene copy despite their normal compensatory mechanisms being intact.20
To generate Vpr mice with variable Agt copies, Vpr mice were bred with Agtdup/Agtdup mice (Figure 1). Genotyping assays to distinguish between the different allele of the Agt gene (Agt+ and Agtdup) have been established at the Jackson Laboratory. The tail DNA of the progeny was analyzed by PCR. The Agtdup allele produced a 190-bp fragment when amplified with the D8Mit56 marker, whereas Agt+ gave a 160-bp fragment. The sequences of the two primers that were used are as follows: 5′-ACACTCAGAGACCATGAGTACACC-3′ SSLP primer D11Mit 258 and 5′-GAGTTCACTACCCACAAGTCTCC-3′ SSLP primer D11Mit258. The inheritance of the other transgenes (tetop/vpr and podocin/rtta) was determined by PCR, using the following primers: forward 5′-CGCCTGGAGACGCCATCC-3′ and reverse 5′-CCACACCTCCCCCTGAAC-3′.
Figure 1.
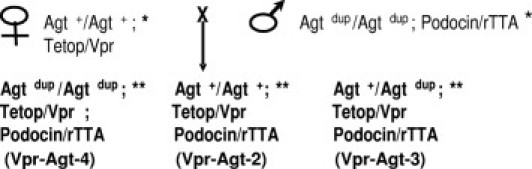
Generation of Vpr animals that have two (Agt+/Agt+), three (Agtdup/Agt+), or four (Agtdup/Agtdup) functional copies of the angiotensinogen (Agt) gene at its normal chromosomal location. Since Tetop/Vpr and Podocin/rTTA mice were on the FVBN background, we have used the Agtdup FVBN congenic strains. *Animals were generated such that the animals used for the breeding were homozygous for the Tetop/Vpr or Podocin/rTTA transgene. **Animals were generated such that the animals used for the breeding were hemizygous for the Tetop/Vpr or Podocin/rTTA transgene.
Experimental Protocols
Protocol A
To determine the development of clinically apparent HIVAN phenotype in Vpr mice, 6-week-old age- and sex-matched Vpr-Agt-2 mice, were fed either doxycycline (Doxy-Vpr) or normal saline (C-Vpr) in their drinking water for 6 weeks (n = 6 for each group). At the end of the experimental period, renal disease biomarkers were collected, and kidneys were harvested for renal histology.
Protocol B
To determine the effect of the RAS on the progression of HIVAN in Vpr mice, 6-week-old, age- and sex-matched Vpr-Agt-2, Vpr-Agt-3, and Vpr Agt-4 mice (n = 6) were fed drinking water containing doxycycline for 6 weeks. At the end of the experimental period, biomarkers were collected, and kidneys were harvested for renal histology.
Protocol C
To evaluate the effect of the activation of the RAS on clinically occult HIVAN, 6-week-old, age- and sex-matched Vpr-Agt-2, Vpr-Agt-3, and Vpr Agt-4 mice (n = 6) were fed drinking water containing doxycycline for 3 weeks (to develop occult HIVAN) followed by drinking water without doxycycline for 3 weeks. At the end of experimental periods, renal biomarkers were collected, and kidneys were harvested for renal histology.
Renal Disease Biomarkers
Five primary biomarkers related to renal disease were included: blood pressure, renal histology, proteinuria (urinary protein/creatinine ratio mg/g creatinine), and biochemical parameters (blood urea nitrogen and serum albumin). Blood pressure (systolic and diastolic) was measured by CODA system (Kent Scientific, Torrington, CT) at 2-week interval. Proteinuria was measured by automated analyzer, which quantified the levels as low as 1.0 μg/mL; blood was obtained at the end of the experimental protocol by cardiac puncture (under anesthesia) at the time of sacrifice.
Renal Histology
Renal cortical sections were stained with hematoxylin and eosin, and PAS. Renal histology was scored for both tubular and glomerular injury. Renal cortical sections were coded and examined under light microscopy. Twenty random fields (×20)/mouse were examined to score percentage of the involved glomeruli and tubules. Glomerular lesions were classified as focal segmental glomerulosclerosis, global glomerulosclerosis, and collapsing glomerulosclerosis. A semiquantitative scale—0 = no tubular dilation, 1+ = minimal tubular dilation, 2+ = mild tubular dilation, and 3+ = moderate tubular dilation—were used for scoring. In addition, total number of microcysts was counted and percentage was calculated.
Immunohistochemical Staining
The immunohistochemistry protocol used in the present study has been described previously.21 Briefly, the sections were de-paraffinized, and antigen retrieval was accomplished by microwave heating for 10 minutes at the maximum output in 10 mmol/L citrate buffer (pH 6.0). The endogenous peroxidase activity was blocked with 0.3% hydrogen peroxide in methanol for 30 minutes at room temperature. Sections were washed in phosphate buffered saline (PBS) thrice and incubated in blocking serum solution according to the primary antibody for 1 hour at room temperature. The primary antibody was applied in different dilutions: transforming growth factor-β (TGF-β) (rabbit polyclonal, dilution 1:200; Santa Cruz Biotechnology, Santa Cruz, CA), connective tissue growth factor (CTGF) (goat polyclonal, dilution, 1:200; Santa Cruz Biotechnology), angiotensinogen (rabbit monoclonal, 1:600; Epitomics, Burlingame, CA), renin (rabbit polyclonal, dilution 1: 400; Santa Cruz Biotechnology), and vascular endothelial growth factor (VEGF) (mouse monoclonal, 1:1000; Santa Cruz Biotechnology) and then incubated overnight at 4°C in a humidifying chamber. Each of the sections were washed thrice with PBS and incubated in the appropriate secondary antibody at 1:250 dilutions at room temperature for 1 hour. After washing with PBS three times, sections were incubated in ABC reagent (Vector Laboratories, Burlingame, CA) for 30 minutes. Sections were washed thrice in PBS and placed in VECTOR Nova RED substrate kit SK-4800 (Vector Laboratories), followed by counterstaining with methyl green. The sections were then dehydrated and mounted with a xylene-free mounting media (Permount; Fisher Scientific, Fair Lawn, NJ). In all of the batches of immunoassaying, appropriate positive and negative controls were used. All of the immune-stained slides were coded and blindly studied by two pathologists by a semiquantitative grading score.
Reverse-Transcription PCR Analysis
Control and experimental renal tissues were used to quantify mRNA expression of molecules pertaining to the RAS and EMT. RNA was extracted using TRIZOL (Invitrogen, Carlsbad, CA). For cDNA synthesis, 2 μg of the total RNA was preincubated with 2 nmol of random hexamer (Invitrogen) at 65°C for 5 minutes. Subsequently, 8 μL of the reverse transcriptase reaction mixture containing Cloned AMV reverse transcriptase, 0.5 mmol each of the mixed nucleotides, 0.01 mol dithiothreitol, and 1000 U/mL RNAsin (Invitrogen) was incubated at 42°C for 50 minutes. For a negative control, a reaction mixture without RNA or reverse transcriptase was used. Samples were subsequently incubated at 85°C for 5 minutes to inactivate the reverse transcriptase. Quantitative PCR was carried out in an ABI Prism 7900HT sequence detection system (Applied Biosystems, Life Technologies Corporation. Carlsbad, CA using the primer sequences as shown below: Agt (forward, 5′-ACACTCAGAGACCATGAGTACACC-3′; reverse 5′-GAGTTCACTACCCACAAGTCTCC-3′); α-smooth muscle actin (α-SMA) (forward 5′-CTGACAGAGGCACCACTGAA-3′; reverse 5′-CATCTCCAGAGTCCAGCACA-3′); fibroblast-specific protein 1 (FSP1) (forward 5′-GATGAGCAACTTGGACAGCA-3′; reverse 5′-ATGTGCGAAGAAGCCAGAGT-3′); proliferating cell nuclear antigen (PCNA) (forward 5′-GGGTTGGTAGTTGTCGCTGT-3′; reverse 5′-AGCACCTTCTTCAGGATGGA-3′); SNAIL (forward 5′-ATTCTCCTGCTCCCACTGC-3′; reverse 5′-GACTCTTGGTGCTTGTGGAG-3′); zinc finger E-box-binding homeobox 1 (ZEB1) (forward 5′-TGCACTGAGTGTGGAAAAGC-3′; reverse 5′-TGGTGATGCTGAAAGAGACG-3′); ZEB2 (forward 5′-AGGCATATGGTGACGCACAA-3′; reverse 5′-CTTGAACTTGCGGTTACCTGC-3′).
SYBR Green was Used as the Detector and ROX as the Passive Reference Gene
Results (means ± SD) represent three animals as described in the legend. The data were analyzed using the Comparative CT method (ΔΔCT method). Differences in CT are used to quantify relative amount of PCR target contained within each well. The data were expressed as relative mRNA expression in reference to control, normalized to quantity of RNA input by performing measurements on an endogenous reference gene, GAPDH.
Ang II ELISA
Ang II levels were determined in the renal tissue and plasma samples from the protocol C using commercial ELISA kits (Peninsula Laboratories, Belmont, CA) as described by the manufacturer. Briefly, Ang II was extracted with 20 mmol/L Tris buffer (pH 7.4) and partially purified and concentrated after filtering through Centricon Filters (molecular weight cutoff 10,000 Da; Millipore, Billerica, MA).
Statistical Analysis
For comparison of mean values between two groups, the unpaired t-test was used. To compare values between multiple groups, analysis of variance and a Bonferroni multiple range test was used to calculate a P value. Statistical significance was defined as P < 0.05.
Results
There was no difference in clinical biomarkers (proteinuria and blood pressure) between control Vpr (C-Vpr) and Vpr-Agt-2-receiving doxycycline for 3 weeks only.
Doxycycline-Treated Vpr Mice Displayed Apparent HIVAN
Renal cortical sections from protocol A were evaluated to confirm the development of apparent HIVAN phenotype in Vpr mice. Doxy-Vpr showed mean elevated levels of urinary protein/creatinine ratio (Doxy-Vpr, 780 and C-Vpr, 210 mg/g creatinine) and blood pressure (Doxy-Vpr, 131.2/91.5 vs. C-Vpr, 126.8/87.2 mm Hg) when compared with control mice (C-Vpr). Doxy-Vpr also showed development of HIVAN phenotype in the form of focal segmental glomerulosclerosis and microcyst formation (Figure 2).
Figure 2.
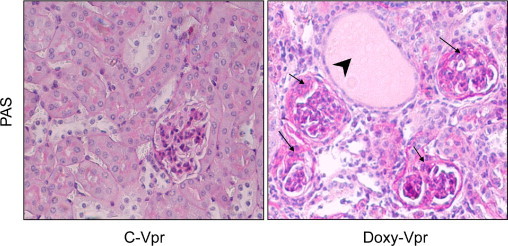
Doxy-Vpr manifest the HIVAN phenotype. Renal cortical sections from the protocol A were stained with PAS and graded for severity of renal lesions. Representative microphotographs of renal cortical sections Doxy-Vpr and C-Vpr are shown. C-Vpr did not reveal any glomerular or tubular abnormalities; whereas, Doxy-Vpr showed both segmental glomerular lesions and microcyst formation. Segmental lesions are shown by black arrows; whereas microcyst formation is indicated by a black arrowhead.
Doxy-Vpr Show Enhanced Renal Tissue Expression of EMT Markers
EMT has been demonstrated to play an important role in the progression of both human and animal experimental models of kidney diseases.21 Since Ang II contributes to the initiation of EMT, we also evaluated renal tissue expression of angiotensinogen (Agt) in Doxy-Vpr and C-Vpr. To determine the role of EMT in the development of HIVAN, total RNA was extracted from renal tissues of Doxy-Vpr and C-Vpr (n = 3). Doxy-Vpr showed enhanced renal tissue mRNA expression of PCNA, α-SMA, and FSP1 when compared with C-Vpr (Figure 3). In addition, renal tissues of Doxy-Vpr showed enhanced mRNA expression of SNAIL, ZEB1, and ZEB2 (repressors of transcriptors of E-cadherin, Figure 3).21 Since renal tissue is composed of multiple cell types, including mesenchymal cells, an increase in PCNA and α-SMA may be reflecting events occurring in mesenchymal cells rather than in epithelial cells; nonetheless, increased renal tissue expression of transcription repressors of E-cadherin (eg, SNAIL, ZEB1, and ZEB2) indicated down-regulation of epithelial cell phenotype. These findings indicate that manifestation of the HIVAN phenotype is associated with the expression of molecular markers of EMT.
Figure 3.
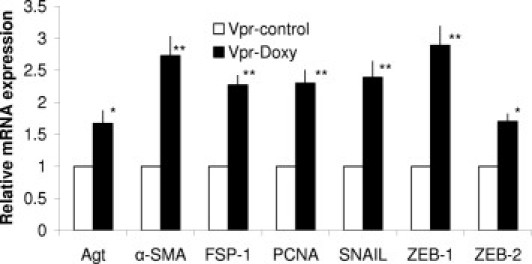
Renal tissue expression of EMT markers in Doxy-Vpr. Total RNA was extracted from renal tissues of Doxy-Vpr and C-Vpr (n = 3). RNA was probed for PCNA, α-SMA, FSP1, SNAIL, ZEB2, and ZEB1. *P < 0.01 compared with respective C-Vpr; **P < 0.001 compared with respective C-Vpr. Error bars indicate SD.
Activation of the RAS Is Associated with the Advanced Renal Lesions
To determine the role of the RAS in the progression of renal lesions in HIVAN, we genetically engineered Vpr mice with two, three, and four copies of Agt. These mice were fed doxycycline for 6 weeks to display the development of the HIVAN phenotype. Representative microphotographs (protocol B) of Vpr-Agt-2, Vpr-Agt-3, and Vpr-Agt-4 are shown in Figure 4. Vpr-Agt-4 showed advanced glomerular lesions when compared with Vpr-Agt-2 (Figure 5A). Similarly, Vpr-Agt-4 mice showed enhanced number of dilated tubules when compared with Vpr-Agt-2 (Figure 5B). In addition, Vpr-Agt-4 showed elevated levels of blood pressure and increased amount of proteinuria when compared with Vpr-Agt-2 (Table 1).
Figure 4.
Vpr with higher Agt copies developed advanced renal lesions. Representative microphotographs from Vpr with two, three, and four copies of Agt (protocol B). Vpr-Agt-4 showed enhanced number of glomerular sclerotic lesions and microcyst formation. Segmental glomerular lesions are indicated by black arrows; whereas microcyst formation is indicated by arrowheads.
Figure 5.
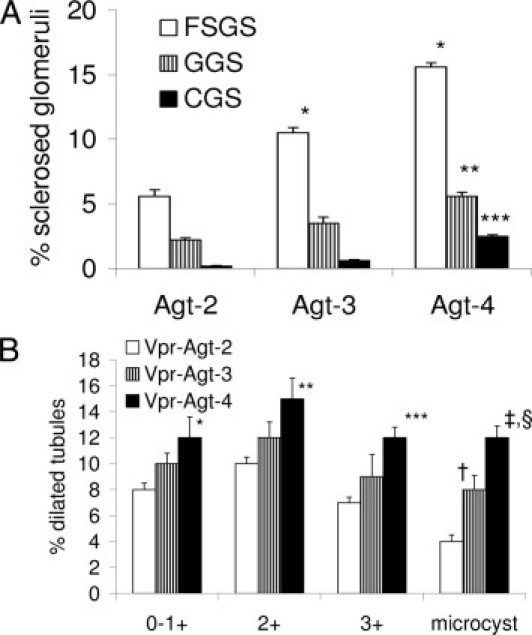
Severity of renal lesions correlated with number of Agt copies (protocol B). A: Renal cortical sections were scored for the severity of glomerular lesions. Vpr-Agt-4 showed advanced sclerotic glomerular lesions when compared with Vpr-Agt-2. *P < 0.01 compare with respective focal segmental glomerulosclerosis (FSGS) of Vpr-Agt-2; **P < 0.05 compared with respective global glomerulosclerosis (GGS) of Vpr-Agt-2 and Vpr-Agt-3; ***P < 0.05 compared with respective collapsing glomerulosclerosis (CGS) of Vpr-Agt-2. B: Renal cortical sections were scored for the severity of tubular lesions. Vpr-Agt-4 showed advanced tubular lesions when compared with Vpr-Agt-2. *P < 0.05 compared with respective Vpr-Agt-2; **P < 0.05 compared with respective Vpt-Agt-2; ***P < 0.01 compared with respective Vpr-Agt-2; †P < 0.05 with respective Vpr-Agt-2; ‡P < 0.05 with respective Vpr-Agt-3; §P < 0.001 compared with respective Vpr-Agt-2.
Table 1.
Mean Blood Pressure and UP/CR in Vpr Mice with Variable Agt Copies (Protocol B)
| Blood pressure |
UP/CR(mg/g creatinine) | ||
|---|---|---|---|
| (mm Hg) |
|||
| Systolic | Diastolic | ||
| Vpr-Agt-2 | 130.1 ± 2.1 | 89.2 ± 1.5 | 850 ± 150 |
| Vpr-Agt-3 | 135.3 ± 3.2⁎ | 93.8 ± 2.2† | 980 ± 230 |
| Vpt-Agt-4 | 140.2 ± 4.3‡ | 98.5 ± 3.1§ | 1090 ± 350 |
UP/CR, urinary protein/creatinine.
P < 0.05 compared with respective Vpr-Ag2.
P < 0.05 compared with respective Vpr-Agt-2 and Vpr-Agt-2.
P < 0.001 compared with respective Vpr-Agt-2 and Vpr-Agt-3.
P < 0.001 compared with respective Vpr-Agt-2.
Vpr-Agt-4 Display Worsening of Proteinuria, Blood Pressure, and Renal Lesions (Protocol C)
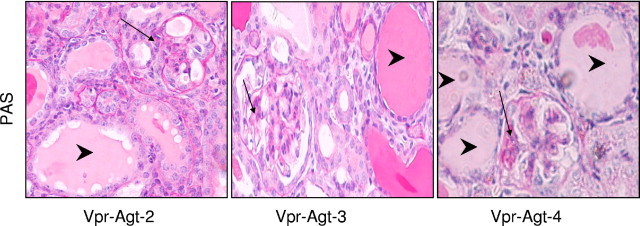
In protocol C, Vpr mice with clinically occult HIVAN (with only 3 weeks of doxycycline therapy) were exposed to the graded degree of the RAS activation (by having two, three, and four copies of Agt). Vpr-Agt-4 showed enhanced glomerular (Figure 6A) and tubular lesions (Figure 6B) when compared with Vpr-Agt-2 (protocol C). Vpr-Agt-2 mice did not show any microcyst formation (Figure 6B); whereas both Vpr-Agt-3 and Vpr-Agt-4 showed microcyst formation (Figure 6B). Vpr-Agt-4 also showed increased mean levels of blood pressure and urinary protein/creatinine ratio when compared with Vpr-Agt-2 (Table 2).
Figure 6.
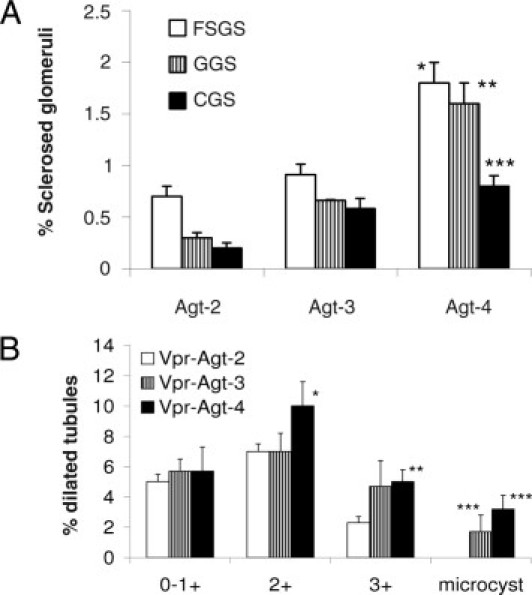
Vpr-Agt-4 displayed progressive renal lesions despite being off doxycycline (protocol C). A: Renal cortical sections of Vpr-Agt-4, Vpr-Agt-3, and Vpr-Agt-2 were scored for the severity of glomerular lesions. Vpr-Agt-4 showed advanced glomerular lesions when compared with Vpr-Agt-2 and Vpr-Agt-3. *P < 0.01 compared with respective focal segmental glomerulosclerosis (FSGS) of Vpr-Agt-2 and Vpr-Agt-3; **P < 0.01 compared with respective global glomerulosclerosis (GGS) of Vpr-Agt-2 and Vpr-Agt-3; ***P < 0.05 compared with respective collapsing glomerulosclerosis (CGS) of Vpr-Agt-2. B: Renal cortical sections of Vpr-Agt-4, Vpr-Agt-3, and Vpr-Agt-2 were scored for the severity of tubular lesions. Vpr-Agt-4 showed advanced tubular lesions when compared with Vpr-Agt-2. *P < 0.05 compared with Vpr-Agt-2, 2+; **P < 0.05 compared with Vpt-Agt-2, 3+; ***P < 0.05 compared with Vpr-Agt-2, microcyst.
Table 2.
Blood Pressure and UP/CR in Vpr-Agt-2 and Vpr-Agt-4 Mice (Protocol C)
| Blood pressure |
UP/CR ratio(mg/g creatinine) | ||
|---|---|---|---|
| (mm Hg) |
|||
| Systolic | Diastolic | ||
| Vpr-Agt-2 | 125.2 ± 3.8 | 81.5 ± 2.9 | 150 ± 80 |
| Vpr-Agt-4 | 138.3 ± 4.1⁎ | 96.8 ± 3.1⁎ | 780 ± 120⁎ |
UP/CR, urinary protein/creatinine.
P < 0.001 compared with respective Vpr-Agt-2.
Vpr-Agt-4 Display Enhanced Renal Tissue Expression of Agt, Renin, and Angiotensin-Converting Enzyme
To determine whether Vpr mice with higher Agt copies had activation of the RAS, total RNA was extracted from renal cortical tissues of Vpr-Agt-2 and Vpr-Agt-4 mice from protocol C, and real-time PCR studies were performed to measure Agt, renin, and ACE expression. As shown in Figure 7, renal tissues of Vpr-Agt-4 mice showed a three- to fourfold increase in renin and ACE mRNA expression when compared to renal tissue expression of renin and ACE of Vpr-Agt-2. Similarly, Vpr-Agt-4 showed twofold increase in renal tissue Agt expression. These findings indicate that Vpr-Agt-4 had activation of the RAS.
Figure 7.
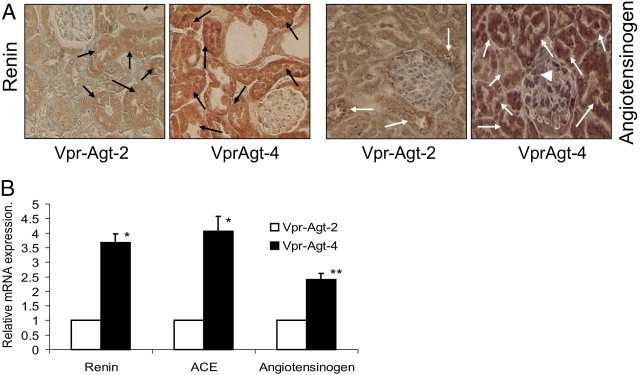
Vpr-Agt-4 showed the activation of the RAS. A: Renal cortical sections of Vpr-Agt-2 and Vpr-Agt-4 mice were immunolabeled for renin and angiotensinogen. Representative microphotographs from a Vpr-Agt-2 and a Vpr-Agt-4 mouse are shown. Both glomerular and tubular cells from Vpr-Agt-4 mice displayed greater expression of renin as well as angiotensinogen (indicated by brown staining). Tubular cell expression of renin and angiotensinogen is indicated by black and white arrows, respectively. Glomerular cell expression of angiotensinogen is indicated by a white arrowhead. B: Total RNA was extracted from renal cortical tissues of Vpr-Agt-2 and Vpr-Agt-4 mice from the protocol C, and real-time PCR studies were carried to measure Agt, renin, and ACE expression. *P < 0.001 compared with the respective Vpr-Agt-2; **P < 0.01 compared with respective Vpr-Agt-2.
Vpr-Agt-4 Show Higher Renal Tissue Concentration of Ang II
To determine renal tissue and plasma concentration of Ang II in Vpr-Agt-2 and Vpr-Agt-4, tissue lysates and plasma were partially purified for Ang II (from renal cortical tissue of Vpr-Agt-2 and Vpr Agt-4 from protocol C). Ang II contents were measured by an ELISA kit as per manufacturer's protocol. As shown in Figure 8A, Vpr-Agt-4 showed an 80% increase in renal tissue concentration of Ang II when compared with renal tissue concentration of Vpr-Agt-2 (P < 0.04). However, there was no difference in plasma concentration of Ang II between Vpr-Agt-2 and Vpr-Agt-4 (Figure 8B).
Figure 8.
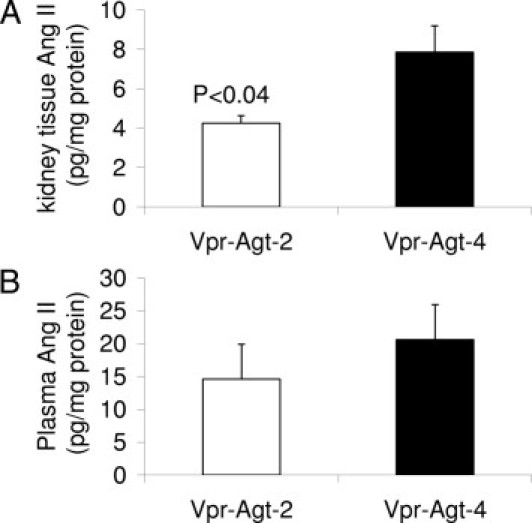
Vpr-Agt-4 showed elevated renal tissue concentration of Ang II. A: Renal tissue lysates from Vpr-Agt-2 and Vpr-Agt-2 (protocol C, n = 5) were concentrated and Ang II assay was carried out by ELISA. Renal tissues of Vpr-Agt-4 showed higher renal tissue concentration of Ang II. B: Plasma samples of Vpr-Agt-4 and Vpr-Agt-2 were concentrated and Ang II concentration was measured by ELISA.
Renal Cell Expression of TGF-β and CTGF in Vpr-Agt-4
Renal cortical sections of Vpr-Agt-2 and Vpr-Agt-4 from protocol C, were immunolabeled for TGF-β and CTGF. Representative microphotographs of renal cortical sections of a Vpr-Agt-2 (Figure 9A) and a Vpr-Agt-4 (Figure 9B) showing renal cell expression of CTGF are shown in Figure 9. Renal tubular cells in Vpr-Agt-4 mice displayed enhanced expression of CTGF. Representative immunoblots of renal tissue expression of CTGF in Vpr-Agt-2 and Vpr-Agt-4 are shown in Figure 9C. Renal tissue in Vpr-Agt-4 mice showed enhanced (P < 0.05) expression of CTGF when compared to Vpr-Agt-2. These findings indicate that enhanced renal cell production of CTGF in Vpr-Agt-4.
Figure 9.
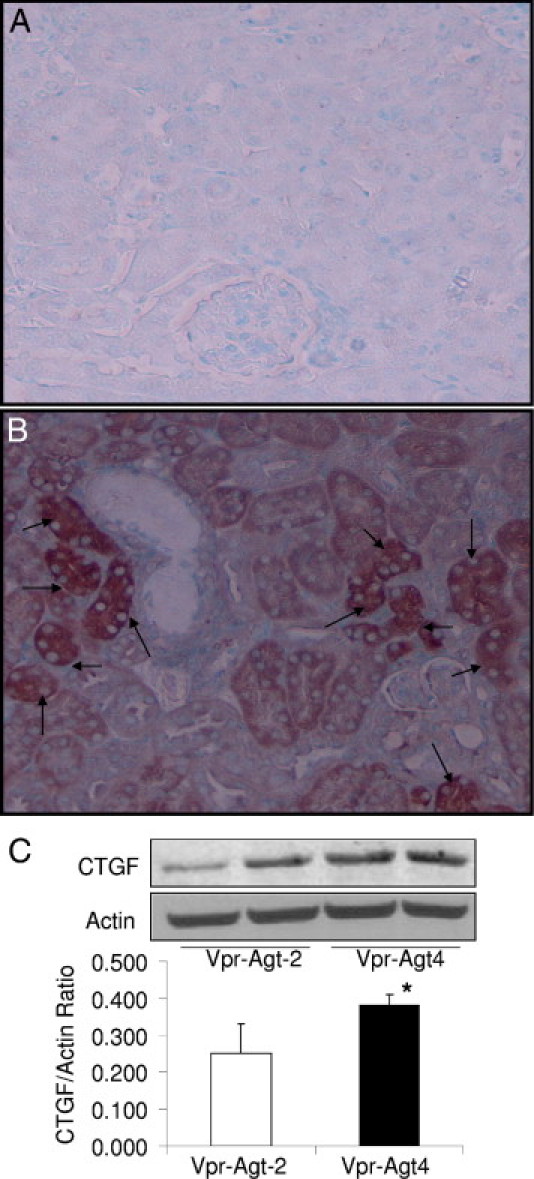
Renal cell expression of CTGF in Vpr-Agt-4 and Vpr-Agt-2 (protocol C). A and B: Renal cortical sections of Vpr-Agt-2 (A) and Vpr-Agt-4 (B) were immunolabeled for CTGF. Tubular cells displayed enhanced expression of CTGF (indicated by arrows) in Vpr-Agt-4. C: Protein was extracted from renal tissues of Vpr-Agt-2 (n = 3) and Vpr-Agt-4 (n = 3); Western blots were prepared and probed for CTGF and actin. Cumulative data in the form of bar diagrams and representative gels are shown. *P < 0.05.
Representative microphotographs showing renal cortical expression of TGF-β in Vpr-Agt-2 and Vpr-Agt-4 are shown in Figure 10, A and B, respectively. Both glomerular and tubular cells showed enhanced expression of TGF-β in Vpr-Agt-4 when compared to Vpr-Agt-2. Since TGF-β has been known to induce its profibrotic effects through the generation of CTGF in other disease models of kidney diseases,22 we wondered whether CTGF and TGF-β expression was displayed by the same cells. To determine a spatial relationship between renal cell CTGF and TGF-β expression, we immunolabeled serial renal cortical sections of Vpr-Agt-4 for CTGF and TGF-β. As shown in Figure 10, C and D, not all cells displaying expression of TGF-β showed enhanced expression of CTGF.
Figure 10.
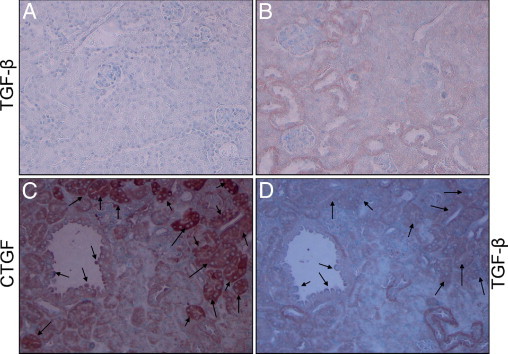
Renal tubular cells show enhanced expression of TGF-β and spatial relationship with CTGF in Vpr-Agt-4. Renal cortical sections of Vpr mice from the protocol C were immunolabeled for TGF-β. Representative microphotographs from Vpr-Agt-2 (A) and Vpr-Agt-4 (B) are shown. Tubular cells of Vpr-Agt-4 showed enhanced expression of TGF-β (indicated by brown staining). C and D: Serial sections from Vpr-Agt-4 were immunolabeled for CTGF and TGF-β. Representative micrographs showing renal cell labeling for CTGF (C) and TGF-β (D) are shown. Only a limited number of cells displayed labeling for both CTGF and TGF-β (indicated by arrows).
Renal Cell and Tissue Expression of VEGF
Since renal cell VEGF expression has been demonstrated to contribute to HIVAN pathogenesis,23 renal cortical sections from protocol C were immunolabeled for VEGF. Representative microphotographs are shown in Figure 11, A and B. Tubular cells in Vpr-Agt-4 displayed enhanced expression of VEGF. Representative gels from renal tissues of Vpr-Agt-2 and Vpr-Agt-4 are shown in Figure 11C; whereas cumulative data renal tissue VEGF expression is shown in Figure 11D. Renal tissues of Vpr-Agt-4 displayed enhanced expression of VEGF (P < 0.01) when compared with Vpr-Agt-2.
Figure 11.

Vpr-Agt-4 display enhanced renal cell/tissue VEGF expression. Renal cortical sections from protocol C were immunolabeled for VEGF. A and B: Representative microphotographs from a Vpr-Agt-2 (A) and a Vpr-Agt-4 (B). Tubular cells in Vpr-Agt-4 displayed enhanced expression of VEGF. C: Representative gels displaying renal tissue expression of VEGF and actin from Vpr-Agt-2 and Vpr-Agt-4. D: A bar diagram showing cumulative data of renal tissue VEGF/actin ratio from four Vpr-Agt-2 and four Vpr-Agt-4 mice. *P < 0.01
Vpr-Agt-4 Showed Enhanced Renal Tissue Expression of EMT Markers
To determine whether EMT is contributing to the progression to apparent HIVAN in Vpr-Agt-4, total RNA was extracted from renal tissues of Vpr-Agt-4 and Vpr-Agt-2 (protocol C). Vpr-Agt-4 showed enhanced renal tissue expression of α-SMA (Figure 12A). Moreover, renal tissues of Vpr-Agt-4 mice showed enhanced expression of ZEB2 (Figure 12A), a repressor of the transcriptor of E-cadherin.21 These findings indicated that manifestation of clinically apparent HIVAN was associated with the activation of the transcriptor factors, which promote the loss of epithelial cell phenotype.
Figure 12.
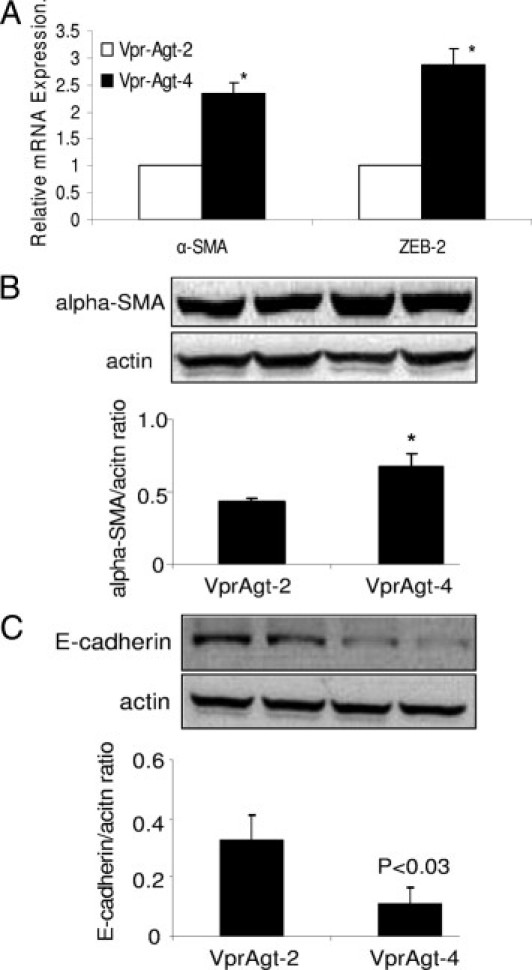
Enhanced renal tissue expression of EMT markers by Vpr-Agt-4. A: Total RNA was extracted from renal tissues of Vpr-Agt-4 and Vpr-Agt-2 (protocol C). RNA was probed for α-SMA and ZEB2 by real-time PCR studies. Vpr-Agt-4 showed enhanced renal tissue expression of α-SMA and ZEB2. *P < 0.01 compared with respective Vpr-Agt-2. B: Protein was extracted from renal tissue of Vpr-Agt-2 (n = 3) and Vpr-Agt-4), Western blots were prepared and probed for α-SMA. Cumulative data are shown in the form of a bar diagram. Representative gels showing expression of α-SMA and actin are also shown. *P < 0.01. C: Protein was extracted from renal tissue of Vpr-Agt-2 (n = 3) and Vpr-Agt-4 (n = 3), Western blots were prepared and probed for E-cadherin. Cumulative data are shown in the form of a bar diagram. Representative gels showing expression of E-cadherin and actin are also shown.
To confirm whether enhanced renal tissue transcription of α-SMA also results in increased α-SMA protein production, renal tissue Western blots from Vpr-Agt-2 and Vpr-Agt-4 were probed for α-SMA. Representative gels and cumulative data displaying renal tissue expression of α-SMA are shown in Figure 12B. Renal tissues from Vpr-Agt-4 displayed enhanced (P < 0.01) expression of α-SMA.
To determine whether enhanced renal tissue transcription in Vpr-Agt-4 also repress renal tissue expression of E-cadherin in Vpr-Agt-4, Western blots from renal tissues from Vpr-Agt-2 and Vpr-Agt-4 were probed for E-cadherin. Representative gels and cumulative data displaying renal tissue expression of E-cadherin are shown in Figure 12C. Renal tissues from Vpr-Agt-4 displayed diminished (P < 0.03) expression of E-cadherin.
Since VEGF is a growth promoting factor and α-SMA is a marker of proliferating myofibroblasts, we wondered whether VEGF and α-SMA expression was displayed by the same cells. To determine a spatial relationship between VEGF and α-SMA expression, we immunolabeled serial renal cortical sections of Vpr-Agt-4 for VEGF and α-SMA. As shown in Figure 13, not all cells showing expression of VEGF displayed expression of α-SMA.
Figure 13.
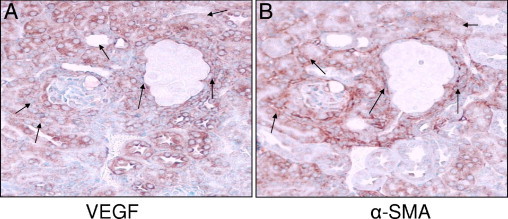
Spatial relationship between renal cell expression of VEGF and α-SMA in Vpr-Agt-4. A and B: Serial sections from Vpr-Agt-4 were immunolabeled for VEGF and α-SMA (protocol C). Representative micrographs showing renal cell labeling for VEGF (A) and α-SMA (B) are shown. Only a limited number of cells displayed labeling for both VEGF and TGF-β (indicated by arrows).
Discussion
The present study demonstrates that Vpr mice after 6 weeks of doxycycline treatment (protocol A) developed apparent HIVAN. In protocol B, tubular dilation and the number of sclerosed glomeruli correlated with the number of Agt copies. In protocol C, Vpr-Agt-2 mice developed minimal glomerular lesions and only mild tubular dilation and no microcyst formation; whereas Vpr-Agt-4 mice showed glomerular sclerosis, mild-to-moderate tubular dilation and microcyst formation. Vpr-Agt-4 mice not only showed enhanced mRNA expression of Agt, renin, and ACE, but also showed an 80% increase in renal tissue levels of Ang II when compared to Vpr-Agt-2. These findings indicate that mice with four Agt copies had renal tissue RAS activation. Degree of proteinuria and level of blood pressure in Vpr-Agt-2 (protocol C) were comparable to the proteinuria and blood pressure levels of the control Vpr animals (C-Vpr, protocol A); On the other hand, Vpr-Agt-4 displayed an increased amount of proteinuria and elevated levels of blood pressure when compared with Vpr-Agt-2 (protocol C) and C-Vpr (protocol A). These findings suggest that the RAS activation in Vpr-Agt-4 (protocol C) was associated with the progression of occult HIVAN to apparent HIVAN.
Manifestation of HIVAN requires the presence of specific genetic, environmental, and host factors.17,19 Recently, the MYH9 and Apol1 genes have been linked to the development of focal glomerulosclerosis in Blacks.24,25 It has been suggested that the same genes may be contributing to the occurrence of focal glomerulosclerosis in patients with HIV-1 infection.19 In addition, manifestation of HIVAN requires infection of kidney cells and the presence of specific host factors.17 Activation of the RAS has been considered to contribute to the pathogenesis of chronic kidney diseases, including HIVAN.26–29 On that account, blockade of Ang II type I receptors or inhibition of the production of Ang II, are commonly used therapeutic modalities to slow down the progression of HIVAN.28,29 Conversely, infusion of Ang II has been demonstrated to accelerate the progression of HIVAN in Vpr mice.30 However, in these studies, the status of the RAS activation was not determined. In the present study, we have used mice with higher Agt copies, which not only manifested with high renal tissue Ang II levels, but also developed increased renal tissue expression of renin and ACE. Thus, the findings in the present study indicated that occult HIVAN could progress to apparent HIVAN in the presence of the RAS activation.
In the present study, there was no difference in plasma concentrations of Ang II between Vpr-Agt-2 and Vpr-Agt-4 mice. It has been reported in several models of Ang II–mediated hypertension that serum Ang II levels are elevated during the initiation of the disease; however, Ang II levels normalized during the later time periods. Nevertheless, Ang II–mediated injury continued to be displayed in these models.31 Our findings in the present study are consistent with the findings of these investigators.
During the last decade, the role of tissue production of Ang II has been demonstrated to contribute to tissue injury.32 Since kidney cells, including podocytes, mesangial and tubular cells carry machinery to generate Ang II, the local production of Ang II has been demonstrated to correlate with renal tissue injury in several models of kidney injury.33,34 In the present study, renal tissue of Vpr-Agt-4 displayed enhanced expression of renin, angiotensinogen, and ACE. In addition, renal tissues of Vpr-Agt-4 mice showed an 80% increase in Ang II production when compared to Ang II production by renal tissues of Vpr-Agt-2 mice.
In several models of kidney diseases, including HIVAN, the RAS activation has been demonstrated to mediate many of its profibrotic effect by stimulating renal cell TGF-β production.35 TGF-β has been reported to stimulate renal fibrosis by stimulating renal cell CTGF in a diabetic rat model of glomerulosclerosis.36 In the present study, renal cells showed enhanced expression, not only of TGF-β, but also of CTGF. In the present study, all renal cells expressing TGF-β did not display CTGF expression. It is possible that TGF-β may have both autocrine and paracrine effects.
Increased VEGF expression by kidney cells has been reported to contribute to the proliferative phenotype in a mouse model of HIVAN.23 On the other hand, inhibition of renal cell VEGF receptor 1 (VEGFR1) and VEGFR2 was associated with a reduction in cyst size in a mouse model of polycystic kidney disease.37 In the present study, kidney cells showed enhanced expression of VEGF Vpr-Agt-4 when compared to Vpr-Agt-2. Several renal cells not only showed expression of VEGF, but also displayed expression of α-SMA. It appears that VEGF may also be contributing to the proliferation of cells undergoing EMT.
In C57B6 mice, blood pressures of one-copy (Agttm1Unc/+) through four-copy (Agtdup/Agtdup) animals showed a linear increases of approximately 8 mm Hg per gene copy20; however, in the present study, Vpr mice displayed an increment of 5 mm Hg per Agt copy. This discrepancy in the rate of increase in blood pressure per gene copy may be related to their altered genetic background- from C57B6 to FVB/N. However, the modulating effect of proteinuric disease on the blood pressure also needs to be taken into account.
Since Vpr-Agt-4 mice showed higher levels of blood pressure when compared with Vpr-Agt-2 mice, it is possible that higher levels of Ang II may have contributed directly as well as indirectly though the development of hypertension in the progression of renal lesions in Vpr-Agt-4 mice. However, hypertension-mediated injury has not been reported to display microcyst formation in any other human and animal experimental animal models. Therefore, the presence of microcyst formation in Vpr-Agt-3 and Vpr-Agt-4 mice seems to be the manifestation of HIV-1 gene (Vpr) expression in the presence of specific host factors, such as the activation of the RAS.
Although the role of EMT in the development and progression of fibrosis in kidney disease has been increasingly recognized, it is still being debated.38 An inflammatory milieu has been reported to invoke EMT in adult tubular epithelial cells in the majority of the studies.38,39 Occurrence of mesenchymal phenotype was identified by cellular expression of αSMA and FSP1.38–40 Since both α-SMA and FSP1 lack cell specificity and constancy of expression, they are not considered to be unequivocal markers of specific lineage; moreover, FSP1 expression in several tissues, including injured kidneys, was detected in macrophages and not in myofibroblasts.39–41 Several transcription factors (Snail, Twist, Slug, and Id), which regulate migration, activation, and differentiation (functional characteristics of mesenchymal cells), are also displayed by injured epithelial cells, myofibroblasts, and macrophages.40,42 Although the data in in vitro studies are robust, in vivo studies lack absolute proof of transition from epithelial to mesenchymal phenotype.38 In the present study, Vpr Agt-4 mice displayed enhanced renal tissue expression of so-called EMT markers. It is likely that Ang II might have contributed indirectly to the progression of renal lesions through the induction of EMT. However, both podocytes and tubular cells transduced with HIV-1 have been reported to show expression of EMT markers.21 Thus, it is possible that both the activation of the RAS and HIV-1 expression might have contributed to the expression of EMT markers in Vpr mice with four Agt copies. Since, we have not determined the lineage of cells displaying mesenchymal phenotype, it will be difficult to identify their source of origin. Thus, it will be important to investigate this aspect in future studies.
What is the relevance of the present occult HIVAN model in real-life situations? A large number of HIV patients belong to African American background.1 There is a variable lag period between the development of infection and its diagnosis. We speculate that during that lag period, if kidney cells such as podocytes were infected with HIV-1 and developed HIV-1 protein expression; they are likely to display HIVAN phenotype in the presence of adverse host factors during the later time periods. Since podocytes are terminally differentiated cells, HIV-1 expression in these cells (occult HIVAN) may persist despite eradication of viral infection. Moreover, the present study demonstrated that expression of a single HIV-1 protein—Vpr—was capable of promoting HIVAN phenotype in the presence of adverse host factor: the activation of the RAS.
The present study indicates that patients with occult HIVAN carry a risk of developing apparent HIVAN in a scenario of the activation of the RAS in the latter time period as a consequence of loss of critical nephron mass in commonly encountered conditions such as ingestion of nephrotoxic medications, hypertension, diabetes, and obesity.15,26
We conclude that host factors such as the activation of the RAS have a potential to promote the progression of clinically occult HIVAN into apparent HIVAN.
Acknowledgments
We are grateful to Prof. Jeffery B. Kopp (National Institutes of Health) for providing us with a breeding pair of Vpr mice.
Footnotes
Supported by National Institutes of Health grants RO1DK084910 and RO1 DK083931.
References
- 1.Szczech L.A., Gupta S.K., Habash R., Guasch A., Kalayjian R., Appel R., Fields T.A., Svetkey L.P., Flanagan K.H., Klotman P.E., Winston J.A. The clinical epidemiology and course of the spectrum of renal diseases associated with HIV infection. Kidney Int. 2004;66:1145–1152. doi: 10.1111/j.1523-1755.2004.00865.x. [DOI] [PubMed] [Google Scholar]
- 2.Cantor E.S., Kimmel P.L., Bosch J.P. Effect of race on expression of acquired immunodeficiency syndrome-associated nephropathy. Arch. 1991;151:125–128. [PubMed] [Google Scholar]
- 3.Berliner A.R., Fine D.M., Lucas G.M., Rahman M.H., Racusen L.C., Scheel P.J., Atta M.G. Observations on a cohort of HIV-infected patients undergoing native renal biopsy. Am J Nephrol. 2004;28:478–486. doi: 10.1159/000112851. [DOI] [PubMed] [Google Scholar]
- 4.Rao T.K., Friedman E.A., Nicastri A.D. The types of renal disease in the acquired immunodeficiency syndrome. N Engl J Med. 1987;316:1062–1068. doi: 10.1056/NEJM198704233161705. [DOI] [PubMed] [Google Scholar]
- 5.Marras D., Bruggeman L.A., Gao F., Tanji N., Mansukhani M.M., Cara A., Ross M.D., Gusella G.L., Benson G., D'Agati V.D., Hahn B.H., Klotman M.E., Klotman P.E. Replication and compartmentalization of HIV-1 in kidney epithelium of patients with HIV-associated nephropathy. Nat Med. 2002;8:522–526. doi: 10.1038/nm0502-522. [DOI] [PubMed] [Google Scholar]
- 6.Atta M.G., Gallant J.E., Rahman M.H., Nagajothi N., Racusen L.C., Scheel P.J., Fine D.M. Antiretroviral therapy in the treatment of HIV-associated nephropathy. Nephrol Dial Transplant. 2006;21:2809–2813. doi: 10.1093/ndt/gfl337. [DOI] [PubMed] [Google Scholar]
- 7.Scialla J.J., Atta M.G., Fine D.M. Relapse of HIV-associated nephropathy after discontinuing highly active antiretroviral therapy. AIDS. 2007;21:263–264. doi: 10.1097/QAD.0b013e3280119592. [DOI] [PubMed] [Google Scholar]
- 8.Khan S., Haragsim L., Laszik Z.G. HIV-associated nephropathy. Adv Chronic Kidney Dis. 2006;13:307–313. doi: 10.1053/j.ackd.2006.04.013. [DOI] [PubMed] [Google Scholar]
- 9.Lekakis J., Ikonomidis I. Cardiovascular complications of AIDS. Curr Opin Crit Care. 2010;16:408–412. doi: 10.1097/MCC.0b013e32833e10a9. [DOI] [PubMed] [Google Scholar]
- 10.Martínez E., Larrousse M., Gatell J.M. Cardiovascular disease and HIV infection: host, virus, or drugs? Curr Opin Infect Dis. 2009;22:28–34. doi: 10.1097/QCO.0b013e328320a849. [DOI] [PubMed] [Google Scholar]
- 11.Mondy K., Overton E.T., Grubb J., Tong S., Seyfried W., Powderly W., Yarasheski K. Metabolic syndrome in HIV-infected patients from an urban, midwestern US outpatient population. Clin Infect Dis. 2007;44:726–734. doi: 10.1086/511679. [DOI] [PMC free article] [PubMed] [Google Scholar]
- 12.Dau B., Holodniy M. The relationship between HIV infection and cardiovascular disease. Curr Cardiol Rev. 2008;4:203–218. doi: 10.2174/157340308785160589. [DOI] [PMC free article] [PubMed] [Google Scholar]
- 13.Marcantoni C., Ma L.J., Federspiel C., Fogo A.B. Hypertensive nephrosclerosis in African Americans versus Caucasians. Kidney Int. 2002;6:172–180. doi: 10.1046/j.1523-1755.2002.00420.x. [DOI] [PubMed] [Google Scholar]
- 14.Bomback A.S., Kshirsagar A.V., Whaley-Connell A.T., Chen S.C., Li S., Klemmer P.J., McCullough P.A., Bakris G.L. Racial differences in kidney function among individuals with obesity and metabolic syndrome: results from the Kidney Early Evaluation Program (KEEP) Am J Kidney Dis. 2010;55(3 Suppl 2):S4–S14. doi: 10.1053/j.ajkd.2009.10.045. [DOI] [PubMed] [Google Scholar]
- 15.Lea J., Cheek D., Thornley-Brown D., Appel L., Agodoa L., Contreras G., Gassman J., Lash J., Miller E.R., 3rd, Randall O., Wang X., McClellan W., AASK Study Investigators Metabolic syndrome, proteinuria, and the risk of progressive CKD in hypertensive African Americans. Am J Kidney Dis. 2008;51:732–740. doi: 10.1053/j.ajkd.2008.01.013. [DOI] [PubMed] [Google Scholar]
- 16.Barisoni L., Kopp J.B. Modulation of podocyte phenotype in collapsing glomerulopathies. Microsc Res Tech. 2002;57:254–262. doi: 10.1002/jemt.10084. [DOI] [PubMed] [Google Scholar]
- 17.Bruggeman L.A., Nelson P.J. Controversies in the pathogenesis of HIV-associated renal diseases. Nat Rev Nephrol. 2009;5:574–581. doi: 10.1038/nrneph.2009.139. [DOI] [PMC free article] [PubMed] [Google Scholar]
- 18.Zhong J., Zuo Y., Ma J., Fogo A.B., Jolicoeur P., Ichikawa I., Matsusaka T. Expression of HIV-1 genes in podocytes alone can lead to the full spectrum of HIV-1-associated nephropathy. Kidney Int. 2005;68:1048–1060. doi: 10.1111/j.1523-1755.2005.00497.x. [DOI] [PubMed] [Google Scholar]
- 19.Mikulak J., Singhal P.C. HIV-1 and kidney cells: better understanding of viral interaction. Nephron Exp Nephrol. 2010;115:e15–e21. doi: 10.1159/000312882. [DOI] [PMC free article] [PubMed] [Google Scholar]
- 20.Smithies O., Kim H.S. Targeted gene duplication and disruption for analyzing quantitative genetic traits in mice. Proc Natl Acad Sci U S A. 1994;91:3612–3615. doi: 10.1073/pnas.91.9.3612. [DOI] [PMC free article] [PubMed] [Google Scholar]
- 21.Yadav A., Vallabu S., Kumar D., Ding G., Charney D.N., Chander P.N., Singhal P.C. HIVAN phenotype: consequence of epithelial mesenchymal transdifferentiation. Am J Physiol Renal Physiol. 2010;298:F734–F744. doi: 10.1152/ajprenal.00415.2009. [DOI] [PMC free article] [PubMed] [Google Scholar]
- 22.Yang F., Chung A.C., Huang X.R., Lan H.Y. Angiotensin II induces connective tissue growth factor and collagen I expression via transforming growth factor-beta-dependent and -independent Smad pathways: the role of Smad3. Hypertension. 2009;54:877–884. doi: 10.1161/HYPERTENSIONAHA.109.136531. [DOI] [PubMed] [Google Scholar]
- 23.Korgaonkar S.N., Feng X., Ross M.D., Lu T.C., D'Agati V., Iyengar R., Klotman P.E., He J.C. HIV-1 upregulates VEGF in podocytes. J Am Soc Nephrol. 2008;19:877–883. doi: 10.1681/ASN.2007050629. [DOI] [PMC free article] [PubMed] [Google Scholar]
- 24.Genovese G., Tonna S.J., Knob A.U., Appel G.B., Katz A., Bernhardy A.J., Needham A.W., Lazarus R., Pollak M.R. A risk allele for focal segmental glomerulosclerosis in African Americans is located within a region containing APOL1 and MYH9. Kidney Int. 2010;78:698–704. doi: 10.1038/ki.2010.251. [DOI] [PMC free article] [PubMed] [Google Scholar]
- 25.Genovese G., Friedman D.J., Ross M.D., Lecordier L., Uzureau P., Freedman B.I., Bowden D.W., Langefeld C.D., Oleksyk T.K., Uscinski Knob A.L., Bernhardy A.J., Hicks P.J., Nelson G.W., Vanhollebeke B., Winkler C.A., Kopp J.B., Pays E., Pollak M.R. Association of trypanolytic ApoL1 variants with kidney disease in African Americans. Science. 2010;329:841–845. doi: 10.1126/science.1193032. [DOI] [PMC free article] [PubMed] [Google Scholar]
- 26.Remuzzi G., Benigni A., Remuzzi A. Mechanisms of progression and regression of renal lesions of chronic nephropathies and diabetes. J Clin Invest. 2006;116:288–296. doi: 10.1172/JCI27699. [DOI] [PMC free article] [PubMed] [Google Scholar]
- 27.Wolf G., Ritz E. Combination therapy with ACE inhibitors and angiotensin II receptor blockers to halt progression of chronic renal disease: pathophysiology and indications. Kidney Int. 2005;67:799–812. doi: 10.1111/j.1523-1755.2005.00145.x. [DOI] [PubMed] [Google Scholar]
- 28.Burns G.C., Paul S.K., Toth I.R., Sivak S.L. Effect of angiotensin-converting enzyme inhibition in HIV-associated nephropathy. J Am Soc Nephrol. 1997;8:1140–1146. doi: 10.1681/ASN.V871140. [DOI] [PubMed] [Google Scholar]
- 29.Bird J.E., Durham S.K., Giancarli, Gitliz P.H., Pandya D.G., Dambach D.M., Mozes M.M., Kopp J.B. Captopril prevents nephropathy in HIV-transgenic mice. J Am Soc Nephrol. 1998;9:1441–1447. doi: 10.1681/ASN.V981441. [DOI] [PubMed] [Google Scholar]
- 30.Ideura H., Hiromura K., Hiramatsu N., Shigehara T., Takeuchi S., Tomioka M., Sakairi T., Yamashita S., Maeshima A., Kaneko Y., Kuroiwa T., Kopp J.B., Nojima Y. Angiotensin II provokes podocyte injury in murine model of HIV-associated nephropathy. Am J Physiol Renal Physiol. 2007;293:F1214–F1221. doi: 10.1152/ajprenal.00162.2007. [DOI] [PubMed] [Google Scholar]
- 31.Atkinson A.B., Brown J.J., Fraser R., Lever A.F., Morton J.J., Riegger A.J., Robertson J.I. Angiotensin II and renal hypertension in dog, rat and man: effect of converting enzyme inhibition. Clin Exp Hypertens. 1980;2:499–524. doi: 10.3109/10641968009037127. [DOI] [PubMed] [Google Scholar]
- 32.Ma J., Matsusaka T., Yang H., Kawachi H., Shimizu F., Isaka Y., Imai E., Kon V., Ichikawa I. Local actions of endogenous angiotensin II in injured glomeruli. J Am Soc Nephrol. 2004;15:1268–1276. doi: 10.1097/01.asn.0000125675.70674.0f. [DOI] [PubMed] [Google Scholar]
- 33.Lin L., Phillips W.E., Manning R.D. Intrarenal Angiotensin ii is associated with inflammation, renal damage and dysfunction in dahl salt-sensitive hypertension. J Am Soc Hypertens. 2009;3:306–314. doi: 10.1016/j.jash.2009.08.002. [DOI] [PMC free article] [PubMed] [Google Scholar]
- 34.Kobori H., Nangaku M., Navar L.G., Nishiyama A. The intrarenal renin-angiotensin system: from physiology to the pathobiology of hypertension and kidney disease. Pharmacol Rev. 2007;59:251–287. doi: 10.1124/pr.59.3.3. [DOI] [PubMed] [Google Scholar]
- 35.Wynn T.A. Cellular and molecular mechanisms of fibrosis. J Pathol. 2008;214:199–210. doi: 10.1002/path.2277. [DOI] [PMC free article] [PubMed] [Google Scholar]
- 36.Umezono T., Toyoda M., Kato M., Miyauchi M., Kimura M., Maruyama M., Honma M., Yagame M., Suzuki D. Glomerular expression of CTGF: TGF-beta 1 and type IV collagen in diabetic nephropathy. J Nephrol. 2006;19:751–757. [PubMed] [Google Scholar]
- 37.Tao Y., Kim J., Yin Y., Zafar I., Falk S., He Z., Faubel S., Schrier R.W., Edelstein C.L. VEGF receptor inhibition slows the progression of polycystic kidney disease. Kidney Int. 2007;72:1358–1366. doi: 10.1038/sj.ki.5002550. [DOI] [PubMed] [Google Scholar]
- 38.Zeisberg M., Duffield J.S. Resolved: EMT produces fibroblasts in the kidney. J Am Soc Nephrol. 2010;21:1247–1253. doi: 10.1681/ASN.2010060616. [DOI] [PubMed] [Google Scholar]
- 39.Zeisberg M., Neilson E.G. Biomarkers for epithelial-mesenchymal transitions. J Clin Invest. 2009;119:1429–1437. doi: 10.1172/JCI36183. [DOI] [PMC free article] [PubMed] [Google Scholar]
- 40.Kalluri R., Weinberg R.A. The basics of epithelial-mesenchymal transition. J Clin Invest. 2009;119:1420–1428. doi: 10.1172/JCI39104. [DOI] [PMC free article] [PubMed] [Google Scholar]
- 41.Acloque H., Adams M.S., Fishwick K., Bronner-Fraser M., Nieto M.A. Epithelial-mesenchymal transitions: the importance of changing cell state in development and disease. J Clin Invest. 2009;119:1438–1449. doi: 10.1172/JCI38019. [DOI] [PMC free article] [PubMed] [Google Scholar]
- 42.Xue C., Plieth D., Venkov C., Xu C., Neilson E.G. The gatekeeper effect of epithelial-mesenchymal transition regulates the frequency of breast cancer metastasis. Cancer Res. 2003;63:3386–3394. [PubMed] [Google Scholar]