Abstract
Neuroimaging in the early differential diagnosis of dementia has gained considerable interest over the last decade. From being used for exclusive purposes only, neuroimaging is now in the forefront of aiding in the diagnosis of Alzheimer's disease (AD), frontotemporal dementia, vascular dementia, and and dementia with Lewy bodies (DLB). With the exception of dopamine transporter single photon-emission computed tomography imaging in DLB, imaging has not yet been incorporated into the diagnostic criteria for the various dementia syndromes, but that will soon change. The recently formulated research criteria for early AD recently formulated by Dubois et al explicitly mention magnetic resonance imaging and positron emission tomography for AD, and are an example of a new diagnostic process developing. In this review, the various imaging techniques will be highlighted, with an emphasis on their ability to diagnose Alzheimer's disease and separate it from other entities.
Keywords: MRI, CT, SPECT, PET, Alzheimer's disease, degenerative dementia
Abstract
En la última década, las neuroimágenes han ganado considerable interés para el diagnóstico diferencial precoz de la demencia. Las neuroimágenes, que inicialmente se utilizaron sólo con propósitos exclusivos, actualmente están en primer plano como ayuda para el diagnóstico de la Enfermedad de Alzheimer (EA), la demencia frontotemporal, la demencia vascular y la demencia por cuerpos de Lewy (DCL). Con exceptión de la tomografía computada por emisión de fotón único (SPECT) que permite identificar el transportador de dopamina en la DCL, las neuroimágenes aun no han sido incorporadas entre los criterios diagnósticos de los diversos síndromes de demencia, pero esto cambiará pronto. Los criterios de investigación para la EA precoz, recientemente formulados por Dubois et al mencionan explícitamente las imágenes de resonancia magnética y de la tomografía por emisión de positrones para la EA, y constituyen un ejemplo de un nuevo proceso diagnóstico en desarrollo. En esta revisión se destacarán las diversas técnicas de imágenes, con un énfasis en su capacidad para diagnosticar Enfermedad de Alzheimer y separarla de otras entidades.
Abstract
Ces 10 dernières années, le diagnostic différentiel précoce de la démence par neuro-imagerie a acquis ses lettres de noblesse. Utilisée auparavant à des fins très spécifiques, la neuro-imagerie se place maintenant à la pointe des technologies pour le diagnostic de la maladie d'Alzheimer (MA), de la démence frontotemporale, de la démence vasculaire et de la démence à corps de Lewy (DCL). Mis à part le marquage par transporteur de dopamine en tomographie par émission monophotonique (TEMP) dans la DCL, l'imagerie n'est pas encore entrée dans les critères diagnostiques des différents syndromes démentiels, ce qui va bientôt changer. Les critères de recherche récemment formulés pour le diagnostic précoce de la MA recommandent de façon explicite l'imagerie par résonance magnétique et la tomographie par émission de positrons et sont un exemple du développement des nouvelles techniques diagnostiques. Nous présenterons dans cet article les différentes techniques d'imagerie, en insistant sur leur aptitude à diagnostiquer la MA et à la distinguer des autres pathologies.
Alzheimer's Disease (AD) is the epidemic of this century. All research efforts should be combined to find a cure for this devastating disease. Even postponing the onset of the disease by 5 years will halve its prevalence. Delay of institutional care will greatly diminish costs for society.
One of the key elements in finding a new cure is being able to diagnose AD in its earliest form, ideally before symptoms occur. For this, neuroimaging already plays an important role, and this role will only increase in the coming years.
Clinical findings
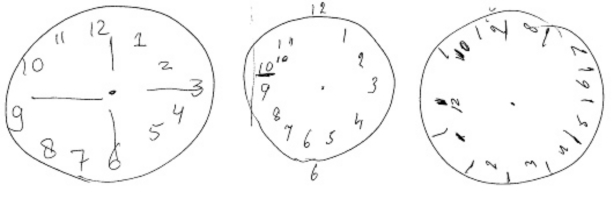
Typically, AD is characterized by an insidious onset of cognitive decline, starting with deficits in episodic memory. Patients and their families complain, for example, of forgetting recent personal and family events, losing items around the house, and repetitive questioning. As the disease progresses, other deficits, such as aphasia, apraxia, agnosia, visuospatial difficulties, and executive dysfunction, arise gradually. A simple test that relies on visuospatial and executive abilities is the clock-drawing test, of which a few examples are given in Figure 1, an image of AD, avant la lettre.
Figure 1. Alternative image of AD: clock drawings by patients with AD. In the clock-drawing test, the patient is asked to draw a clock and set the time for 10 past 11.
Psychological and behavioral problems such as mood disorders, psychosis, agitation, and sleep disorders occur more frequently as the disease progresses. The patient becomes increasingly dependent on others. Clinical diagnosis is made using criteria, of which the McKhann criteria published in 19841 are the most widely validated and used. The criteria discern three categories of certainty: definite AD (established by postmortem or biopsy), probable AD (Table I) , and possible AD (when there are other explanations for the cognitive syndrome that are as likely). The average survival in AD is typically about 8 to 13 years from the onset of symptoms.
Table I. National Institute of Neurological and Communicative Disorders and Stroke - Alzheimer's Disease and Related Disorders Association (now Alzheimer's Association) - NINCDS-ADRDA - criteria for probable Alzheimer's disease.
| 1. Dementia established by clinical examination and confirmed by neuropsychological tests |
| 2. Deficits in two or more areas of cognition, including memory impairment |
| 3. Progressive worsening of memory and other cognitive functions |
| 4. No disturbances ages 40 and 90 |
| 6. Absence of systemic disorders or other brain disease that in and of themselves could account for the progressive deficits in memory and cognition |
Since the publication of the NINCDS-ADRDA criteria in 1984, the elucidation of the biological basis of AD has advanced inexorably, allowing a better understanding of the disease process. The clinical phenotype of AD is no longer described in exclusive terms, but can be characterized more definitively on a phenotypic basis. Distinctive markers of the disease are now recognized, including structural brain changes on magnetic resonance imaging (MRI) with early and extensive involvement of the medial temporal lobe, molecular neuroimaging changes on positron emission tomography (PET) with hypometabolism or hypoperfusion in temporoparietal areas, and changes in cerebrospinal fluid (CSF) biomarkers. A driving force behind this emerging identity of AD has been the intense research interest in characterizing the earliest stages of AD that predate the crossing of the dementia threshold, defined by functional disability. From this, a need was felt to identify prodromal AD that must be distinguished within the broad and heterogeneous state of cognitive functioning that falls outside normal aging described by a wide range of nosological terms, including Age-Associated Memory Impairment, Age-Related Cognitive Decline, Age-Associated Cognitive Decline, Mild Cognitive Disorder, Mild Neurocognitive Disorder, Cognitively Impaired Not Demented, and Mild Cognitive Impairment (MCI). This latter designation of MCI has been the most widely used diagnostic label referring to individuals who have subjective memory and/or cognitive symptoms, objective memory and/or cognitive impairment, and whose activities of daily living are considered to be generally normal. Progression to clinically diagnosable dementia occurs at a higher rate from MCI than from normal, but is clearly not the invariable clinical outcome at follow-up. A more refined definition of AD is then required, to reliably identify individuals with the disease at its earliest stages. A large group of European and US investigators has formulated new criteria for this earliest stage of AD, starting from the presentation with a memory complaint in typical AD and adding biomarker information from MRI, PET, or CSF or genetic confirmation.2 The proposed criteria are detailed elsewhere in this issue (p 135).
Besides the typical neuropsychological profile of AD presenting with early memory deficits as mentioned above, there is evidence from clinico-neuropathological studies that AD patients may present with different neuropsychological profiles. These atypical variants of AD suggest that the distribution of neuropathological changes rather than the nature of the disease are reflected in the clinical syndrome, and that in clinical practice, the diagnosis of AD should be considered as a diagnosis in a broad range of focal cognitive syndromes. Of note, these atypical presentations are not captured in the new research criteria,2 which is acknowledged in the article, but could mean that a substantial number of patients will not be included in research projects. In Table II some of the most striking atypical presentations are mentioned.
Table II. Atypical presentations of Alzheimer's disease.
| • Balint's like syndrome (optic ataxia, simultanagnosia, optic apraxia) |
| • Aperceptive visual agnosia |
| • Fluent or nonfluent aphasia |
| • Limb apraxia |
| • Visual disorientation and navigation problems |
| • Behavioral disturbances resembling frontotemporal dementia |
Differential diagnosis
Even when a patient fulfils clinical criteria as mentioned in the previous paragraph, there is still a chance that the patient has in fact a different underlying pathological substrate. Some clinical features may hint at a different neuropathological substrate and render the clinical diagnosis of AD less likely. In Table III these clinical features, or “red flags,” are listed, with the other diagnostic considerations listed alongside.
Table III. Clinical red flags and alternative diagnostic considerations. (See list of abbreviations at the beginning of this article) Modified from ref 3: Kawas CH. Clinical practice. Early Alzheimer's disease. N Engl J Med. 2003;349:1056-1063. Copyright © Massachusetts Medical Society 2003 .
| Red flag | Alternative diagonosis |
| Abrupt onset | VaD |
| Stepwise deterioration | VaD |
| Prominent behavioral changes | TFD, VaD |
| Profound apathy | TFD, VaD |
| Prominent aphasia | SD, PA, VaD |
| Progressive gait disorder | VaD, NPH |
| Prominent fluctuations in level | |
| -of consciousness | Delirium due to infection, medications, or other causes |
| -or cognitive abilities | DLB, Temporal lobe epilepsy, OSAS, metabolic disturbances |
| Hallucinations or delusions | Delirium due to infection, medications, or other causes, DLB |
| Frequent falls | DLB |
| Extrapyramidal sings or gait problems | PSP, DLB, Parkinsonian syndromes, VaD |
| Rapid decline | CJD, DLB |
| Asymmetry in clinical sings | CBD |
| Eye-movement abnormalities | PSP, Wernicke's encephalopathy |
Neuroimaging
Computed tomography and and magnetic resonance imaging
The microscopic histological changes in the neurodegenerative diseases are inevitably associated with progressive regional and global brain atrophy, which may be assessed in vivo using MRI. In AD, focal atrophy in the medial temporal lobe region, including the hippocampus, has been the focus of extensive study. It reflects the typical pattern of progression of neuropathology, spreading from the entorhinal cortex and hippocampus to the association cortices, as described by Braak and Braak.4 Neuropathological studies have shown that hippocampal volumes, as measured using MRI, correlate well with the neuropathological burden at postmortem. Many studies initially using computed tomography (CT) and later MRI and more recently again using multislice CT have assessed the diagnostic value of hippocampal atrophy for AD. In a meta-analysis of studies using visual and linear measurements of medial temporal lobe atrophy (MTA) on MRI, the overall sensitivity and specificity for detection of AD compared with controls was estimated to be 85% and 88%, respectively.5 In clinical practice simple visual rating scales estimating hippocampal atrophy have proven to be useful. Many authors have designed these scales, and as long as volumetry lacks standardization and operationalization between laboratories and clinics, these scales will be around for some time.
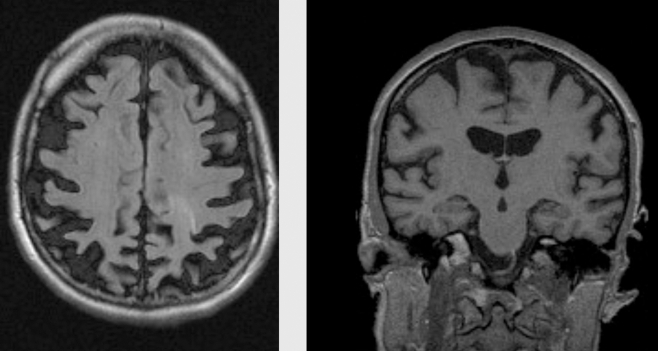
A striking example of medial temporal lobe atrophy is shown in Figure 2 .
Figure 2. Coronal T1 -weighted MRI scans of control (left) and patient with AD (right). Both subjects are 75 years old. The patient with AD shows clear atrophy of the hippocampus.
In clinical practice evaluation of the pattern of atrophy of the entire brain should be taken into account, rather than an isolated evaluation of the medial temporal lobe.
Usually, AD is characterized by global atrophy with prominent atrophy of the medial temporal lobe. However, atypical forms of AD have been described with prominent posterior atrophy, especially prevalent among younger AD patients (Figure 3). This entity has also been designated as posterior cortical atrophy, but many studies have shown that AD pathology is most often present. This absence of hippocampal atrophy is one of the conspicuous findings in AD one can encounter. Other findings and their associated proposed alternative diagnoses are listed in Table IV.
Figure 3. AD patient with early onset (age 51). On the left pronounced parietal and posterior cingulate atrophy is seen, while in the right panel a coronal cut of the same patient shows an intact medial temporal lobe.
Table IV. Conspicuous MRI/CT findings in patients suspected of having AD. (See list of abbreviations at the beginning of this article) .
| Findings | Consider alternative diagnoses |
| No hippocampal atrophy | Normal aging; MCI, FTD, PSP, CBD |
| Unilateral hippocampal atrophy | SD |
| Extreme hippocampal atrophy | SD; argyrophilic grain disease |
| Abundant small-vessel disease | VaD; CAA; amyloid angiopathy |
| Unilateral cerebral atrophy | CBD |
| No abnormalities | Normal aging; early stage AD |
| Striking asymmetry temporal region | SD, PA |
Serial ME imaging
Besides the existence of regional atrophy, the most important structural imaging feature of AD is progression of atrophy. A yearly decline in hippocampal volume approximately 2.5 times greater in patients with AD than in normal aged subjects is reported, and a relationship exists between memory loss and hippocampal damage across the spectrum from normal aging to dementia. Neuroanatomical changes over time may be too mild, diffuse, or topographically complex to be detected by simple visual inspection, or even with manually traced measurements of regions of interest. New serial volumetric imaging techniques developed in the last few years represent an added value to identify subtle structural brain changes, which have brought extensive neocortical changes to the fore, extending well beyond the medial temporal lobe.6
Vascular changes
Besides atrophy, cerebrovascular pathology has been associated with AD, especially in the late onset form. As such, overlap with vascular dementia (VaD) may occur and patients may actually fulfil criteria for both AD and VaD. Unfortunately, no operational criteria for so-called mixed dementia exist, so it is left to the judgement of the clinician, which label fits best with the clinical picture of the patient. Further, use of PET or CSF may help to tease out the relevant pathologies.
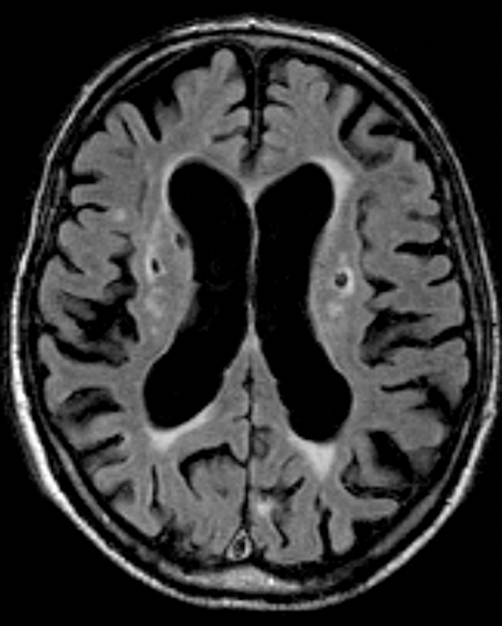
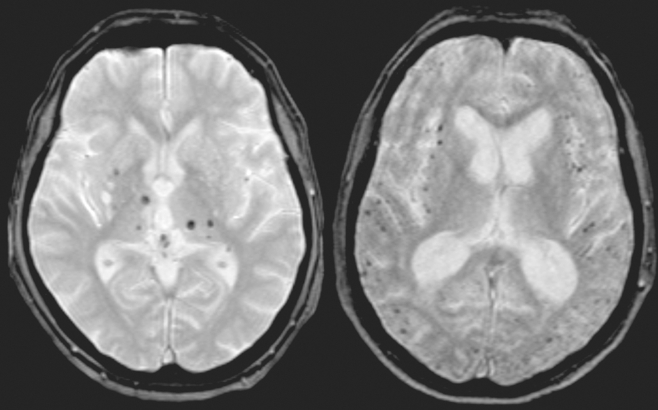
In AD most often signs of small-vessel disease are present on MRI in the form of white matter hyperintensities (WMFI), lacunar infarcts (lacunes) (Figure 2,Figure 5) and microbleeds (Figure 6) . Microbleeds have been associated with amyloid angiopathy, but their clinical relevance is still uncertain.
Figure 4. Cerebrovascular pathology on axial fluid attenuated inversion recovery (FLAIR) MRI scans. Confluent white matter changes (Fazekas scale 3).
Figure 5. Cerebrovascular pathology on axial fluid attenuated inversion recovery (FLAIR) MRI scans. Lacunar infarcts in basal ganglia on both sides.
Figure 6. Microbleeds on Flash/T2*/2D axial MRI scan. On the left, predominantly in the basal ganglia; on the right, predominantly located cortically.
Functional (molecular) imaging
Positron emission tomography
Brain metabolism can be studied using PET. Changes in brain metabolism may precede structural brain changes.
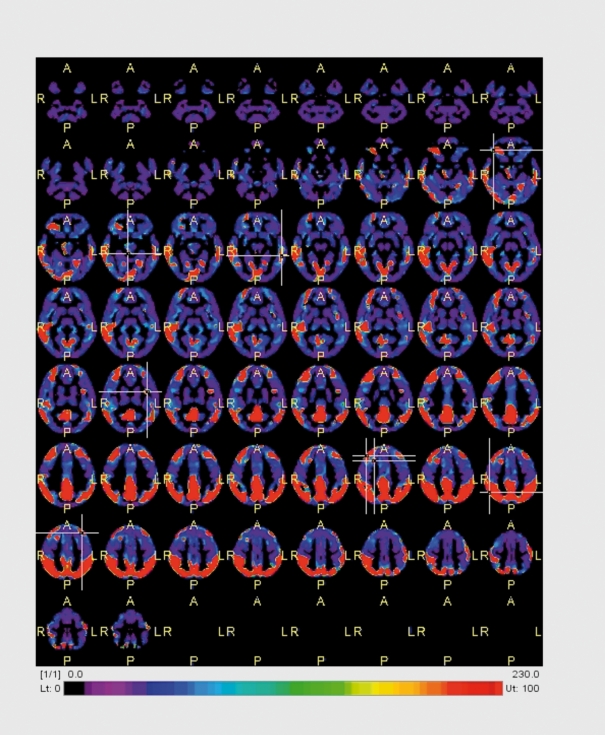
Glucose metabolism can be visualized using the metabolic tracer [18F]fluorodeoxyglucose (FDG). In AD, temporal, parietal and most notably posterior cingular hypometabolism is found, discriminating AD patients from controls with good discriminatory power (sensitivity and specificity in the range of 85% to 90%, (Figure 7) . In current clinical guidelines routine PET is not advised, since the added value over clinical diagnosis and structural imaging has not been demonstrated extensively.
Figure 7. Voxel-based analysis of FDG-PET of an AD patient compared with normal controls. In red are the areas that are showing a lower metabolism in the patient: posterior cingulate cortex and bilateral parietal lobes as well as the temporal lobes. Courtesy Dr Bart van Berckel, VUMC.
Detecting amyloid in vivo using PET
An exciting novel application of PET is the in-vivo imaging of amyloid. The amyloid β protein is considered essential to the pathogenesis of AD, as it is the main constituent of neuritic plaques - one of the neuropathological hallmarks of AD.
After years of preclinical research, several amyloid-imaging tracers have been introduced recently.17,18 2-(1-{6-[(2-F-fluoroethyl)(melhyl)amino]-2-naphtyl}ethylidene)malo nitrile) (18F-FDDNP) and N-methyl-11C-2-(4'-methylaminophenyl)-6-hydroxy benzothiazole (11C-PIB) have been studied most extensively. Both tracers bind with nanomolar affinity to amyloid: KD of 18F-FDDNP and 11C-PIB are 0.75 and 1-2 nM, respectively.7-9 Both tracers enter the brain in amounts sufficient for imaging with PET (Figure 8) . Indeed, the first proof of concept studies of 11C-PIB and 18F-FFDNP indicated that AD patients showed increased retention of these tracers compared with controls in areas known to contain large amounts of amyloid deposits. 7-9 However, the specific binding component of 11C-PIB is almost ninefold higher than that of 18F-FFDNP and the latter has substantial overlap with binding in controls. As such, identification of pathological amyloid load on an individual basis is possible with 11C-PIB but will prove to be difficult with 18F-FFDNP, limiting its clinical applicability.10
Figure 8. 11C-PIB BPND images in the same AD patientas in Figure 3. Note the massive amyloid binding in red in almost the entire cortex. Courtesy of Dr. B.VanBerckel.VUMC .
Although the specific binding of 11C-PIB has an excellent effect size in AD patients, the clinical use of 11C-PIB is hampered by the short half-life of the radionuclide nC. As an alternative, 18F-PIB is currently undergoing clinical trials, and first results look promising. The longer halflife of 18F-PIB (110 minutes) compared with 11C-PIB (20 minutes) enables studies at PET centers without an onsite cyclotron, greatly increasing its clinical value. In addition, new 18F-labeled ligands for amyloid imaging have been published, such as 18F-BAY94-917211, which also have a good effect size and may become available for clinical use within the coming years.
In vivo amyloid imaging may considerably add to our understanding of the underlying pathophysiological mechanisms of AD. Furthermore, imaging of amyloid may prove to be a sensitive diagnostic marker, and enable prognoses in the earliest stages of formation of neuropathology.12-13 It should be noted, however, that amyloid deposition is not exclusively confined to AD, and also occurs in dementia with Lewy bodies (DLB) and congophylic amyloid angiopathy (CAA).14
Single photon emission tomography
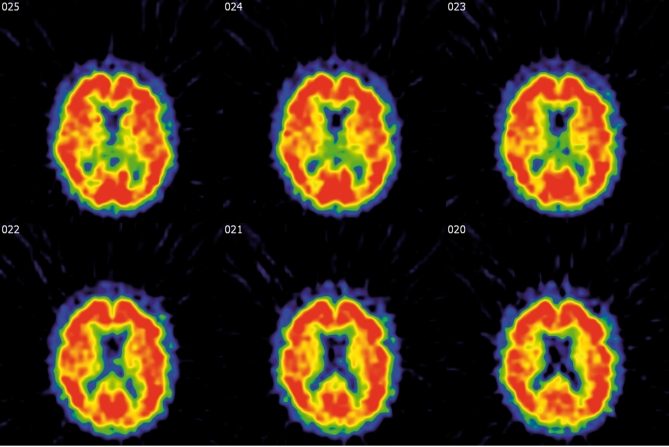
Using single-photon emission computed tomography (SPECT) one is able to get an impression of the regional cerebral blood flow. The most widely used tracer is “TcHMPAO. In typical AD cases a pattern resembling the one seen on PET is seen: bilateral temporoparietal hypoperfusion. The application of SPECT in clinical routine has been hampered by false-positive findings and insufficient added value over MRI. More promising and partly included in the routine clinical setting are neuroreceptor studies using 123ioflupane(IFP)-CIT (DAT-scan) which allows visualization of the degeneration of the nigrostriatal dopaminergic neurons. Scintigraphically it allows the distinction between patients with essential tremor and patients with Parkinson's disease or PSP and MSA. In dementia the distinction between AD and DLB may be relevant, especially when there are no extrapyramidal features. For this, the use of DAT is extremely helpful, showing abnormal findings in DLB and normal findings in AD,15,16 being superior to blood flow imaging with HMPAO-SPECT. A 123IIBZM-SPECT shows the integrity of the postsynaptic dopamine receptor. It mayhelp in the distinction between idiopathic Parkinson's disease and diseases with parkinsonism like PSP and MSA, although with low accuracy.17
Conclusion
Neuroimaging is no longer optional in diagnosing the underlying disease in dementia. Structural and functional imaging techniques have evolved over time in terms of resolution, availability, and costs. Imaging should always be used in conjunction with the clinical findings and never on its own. Some images are, however, diagnostically so evident that they often “make the case,” for instance in SD and CBD. By far, the evidence for hippocampal atrophy in AD exceeds that of the other imaging modalities, probably closely followed by DAT scanning for Parkinonistic disorders like DLB. Clinical imaging findings are shown in Table V. The developments in molecular imaging are moving at such a high speed that amyloid imaging will not take long before entering the clinical arena. C-PIB, but maybe even earlier a fluoride version of PIB or 18F-BAY94-9172, are the most likely candidates lor this. Using all these techniques, we are slowly entering the phase in which it will be possible to diagnose AD before dementia occurs.
Table V. Neuroimaging in AD: modalities and typical findings.=, modalities equally effective; >, one superior over the other. (See list of abbreviations at the beginning of this article) .
| Option | Modality | Result |
| Rule out structural lesion | CT+MRI | Tumor, hydrocephalus, subdural hematoma |
| Hippocampa atraphy | MRI>CT | Symmetric atrophy; slight asymmetry sometimes |
| Cerebral atrophy | MRI>CT | Biparietal atrophy; precuneus atrophy |
| White matter changes | MRI>CT | None to moderate changes, symmetric, frontal>parietal |
| Microbleeds | MRI | None to many, usually lobar |
| Lacunes | MRI>CT | None to a few, most often in subcortical white matter or basal ganglia |
| Hypometabolism | FDG-PET | Temporal, parietal, postcingular |
| Hypoperfusion | SPECT=PET | Biparietotemporal |
| Amyloid plaques | PIB-PET>FDDNP PET | Binding in frontal, temporal, and parietal lobes |
| Presynaptic dopaminergic neurons | DAT-SPECT | Less signal in striatum |
| Postsynaptic dopaminergic receptor | IBZM-SPECT | Less binding in striatum |
Selected abbreviations and acronyms
- AD
Alzheimer's disease
- CAA
congophylic amyloid angiopathy
- CBD
corticobasal degeneration
- CJD
Creutzf eld- Jakob disease
- CT
computed tomography
- DLB
dementia with Lewy bodies
- FTD
frontotemporal dementia
- MCI
mild cognitive impairment
- MRI
magnetic resonance imaging
- NPH
normal-pressure hydrocephalus
- OSAS
obstructive sleep apnea syndrome
- PA
progressive aphasia
- PET
positron emission tomography
- PSP
progressive supranuclear palsy
- SD
semantic dementia
- SPECT
single proton emission computed tomography
- VaD
vascular dementia
REFERENCES
- 1.McKhann G., Drachman D., Folstein M., Katzman R., Price D., Stadlan E. Clinical diagnosis of Alzheimer's disease: report of the NINCDS- ADRDAWork Group under the auspices of Department of Health and Human Services Task Force on Alzheimer's disease. Neurology. 1984;34:939–944. doi: 10.1212/wnl.34.7.939. [DOI] [PubMed] [Google Scholar]
- 2.Dubois B., Feldman HH., Jacova C., et al. Research criteria for the diagnosis of Alzheimer's disease: revising the NINCDS-ADRDA criteria. Lancet Neurol. 2007;6:734–746. doi: 10.1016/S1474-4422(07)70178-3. [DOI] [PubMed] [Google Scholar]
- 3.Kawas CH. Clinical practice. Early Alzheimer's disease. N Engl J Med. 2003;349:1056–1063. doi: 10.1056/NEJMcp022295. [DOI] [PubMed] [Google Scholar]
- 4.Braak H., Braak E. Morphological criteria for the recognition of Alzheimer's disease and the distribution pattern of cortical changes related to this d isorder. Neurobhl Aging. 1994; 15:355–356. doi: 10.1016/0197-4580(94)90032-9. [DOI] [PubMed] [Google Scholar]
- 5.Scheltens P., Fox N., Barkhof F., De Carli C. Structural magnetic resonance imaging in the practical assessment of dementia: beyond exclusion. Lancet Neurol. 2002;1:13–21. doi: 10.1016/s1474-4422(02)00002-9. [DOI] [PubMed] [Google Scholar]
- 6.Sluimer JD., van der Flier WM., Karas GB., et al. Whole-brain atrophy rate and cognitive decline: longitudinal MR study of memory clinic patients. Radiology. 2008;248:590–598. doi: 10.1148/radiol.2482070938. [DOI] [PubMed] [Google Scholar]
- 7.Klunk WE., Engler H., Nordberg A., et al. Imaging brain amyloid in Alzheimer's disease with Pittsburgh Compound-B. Ann Neurol. 2004; 55:306–319. doi: 10.1002/ana.20009. [DOI] [PubMed] [Google Scholar]
- 8.Agdeppa ED., Kepe V., Liu J., et al. 2-Dialkylamino-6-acylmalononitrile substituted naphthalenes (DDNP analogs): novel diagnostic and therapeutic tools in Alzheimer's disease. Mol imaging Biol. 2003;5:404–417. doi: 10.1016/j.mibio.2003.09.010. [DOI] [PubMed] [Google Scholar]
- 9.Small GW., Kepe V., Ercoli LM., et al. PET of brain amyloid and tau in mild cognitive impairment. N Engl J Med. 2006; 355:2652–2663. doi: 10.1056/NEJMoa054625. [DOI] [PubMed] [Google Scholar]
- 10.Tolboom N., Yaqub M., van der Flier WM., et al. Detection of Alzheimer pathology in vivo using both 11C-PIB and 18F-FDDNP PET. J Nucl Med. 2009;50:191–197. doi: 10.2967/jnumed.108.056499. [DOI] [PubMed] [Google Scholar]
- 11.Rowe CC., Ackerman U., Browne W., et al. Imaging of amyloid beta in Alzheimer's disease with 18F-BAY94-9172, a novel PET tracer: proof of mechanism. Lancet Neurol. 2008;7:129–135. doi: 10.1016/S1474-4422(08)70001-2. [DOI] [PubMed] [Google Scholar]
- 12.Forsberg A., Engler H., Almkvist O., et al. PET imaging of amyloid deposition in patients with mild cognitive impairment. Neurobhl Aging. 2008; 29:1456–1465. doi: 10.1016/j.neurobiolaging.2007.03.029. [DOI] [PubMed] [Google Scholar]
- 13.Pike KE., Savage G., Villemagne VL., et al. Beta-amyloid imaging and memory in non-demented individuals: evidence for preclinical Alzheimer's disease. Brain. 2007; 130:2837–2844. doi: 10.1093/brain/awm238. [DOI] [PubMed] [Google Scholar]
- 14.Edison P., Rowe CC., Rinne JO., et al. Amyloid load in Parkinson's disease dementia and Lewy body dementia measured with 11CJPIB positron emission tomography. J Neurol Neurosurg Psychiatry. 2008;79:1331–1338. doi: 10.1136/jnnp.2007.127878. [DOI] [PubMed] [Google Scholar]
- 15.O'Brien JT., Colloby S., Fenwick J., et al. Dopamine transporter loss visualized with FP-CIT SPECT in the differential diagnosis of dementia with Lewy bodies. Arch Neurol. 2004;61:919–925. doi: 10.1001/archneur.61.6.919. [DOI] [PubMed] [Google Scholar]
- 16.Colloby SJ., Firbank MJ., Pakrasi S., et al. A comparison of 99mTc-exametazime and 1231-FP-CIT SPECT imaging in the differential diagnosis of Alzheimer's disease and dementia with Lewy bodies. Int Psychogeriatr. 2008;20:1124–1140. doi: 10.1017/S1041610208007709. [DOI] [PubMed] [Google Scholar]
- 17.Vlaar AM., de Nijs T., Kessels AG., et al. Diagnostic value of 1231-ioflupane and 1231-iodobenzamide SPECT scans in 248 patients with parkinsonian syndromes. Eur Neurol. 2008;59:258–266. doi: 10.1159/000115640. [DOI] [PubMed] [Google Scholar]


