Abstract
Experiments have shown that wild type P. aeruginosa swarms much faster than rhlAB mutants on 0.4% agar concentration surface. These observations imply that development of a liquid thin film is an important component of the self-organized swarming process. A multiscale model is presented in this paper for studying interplay of key hydrodynamical and biological mechanisms involved in the swarming process of P. aeruginosa. This model combines a liquid thin film equation, convection-reaction-diffusion equations and a cell-based stochastic discrete model. Simulations demonstrate how self-organized swarming process based on the microscopic individual bacterial behavior results in complicated fractal type patterns at macroscopic level. It is also shown that quorum sensing mechanism causing rhamnolipid synthesis and resulting liquid extraction from the substrate lead to the fast swarm expansion. Simulations also demonstrate formation of fingers (tendrils) at the edge of a swarm which have been earlier observed in experiments.
Keywords: Swarming motility, multiscale model, fingering pattern
1. Introduction
Several bacteria, such as Pseudomonas aeruginosa, Bacillus subtilis, Serratia liquefaciens, Escherichia coli and Vibrio parahaemolyticus exhibit swarming motility on surfaces of varying properties including hardness and nutrient availability.4,14,15 Swarming is the fastest known bacterial mode of translocation. It enables rapid colonization of surface environments including host tissues.29 Regulation of swarming is achieved by various complex multiscale events. While swarming, a bacterial community may move in a coordinated pattern depending upon the gene expression of individual cells, the sensing of chemical signals presents in a hydrating environment, and the physical characteristics of the surface influencing the attached bacterial cells.
Although some insights in swarming have been obtained (e.g, studies using a two-dimensional off-lattice model32 have shown that Myxobacteria has an optimal reversal frequency of eight minutes), how interactions between cells and cell and environment facilitate swarming is still an open question. Therefore, understanding this question in general might shed light on the self-organizing process in bacteria, when they spread as a biofilm in a tissue or develop multicellular fruiting bodies.
Several bacterial swarming models of the self-propelled bacterial systems have been described in Refs. 5, 11 and 18. Most models, such as those for Bacillus subtilis and Escherichia coli, are based on long-range cellular interactions facilitated by chemical gradient or nutrient level (chemotaxis) (See Refs. 5 and 16 and references therein for a review). However, many bacteria including Myxobacteria, show no evidence of long-range cell–cell communication guiding their collective motion. Specially, Myxobacteria have only local contact signaling and use social interactions between neighboring cells and cell alignment for swarming.19 A stochastic discrete model has been developed in Refs. 32 and 33 for studying an interplay between two different motility mechanisms and the role of reversals in swarming of Myxobacteria. For bacteria swimming in thin liquid film, it was shown that swarming can be a result of pure hydrodynamic interactions between cells.13,26,34 In Refs. 3 and 4, a continuum model was developed for studying Serratia liquefaciens swarming. The interaction between cells and the liquid film environment was described by an effective viscosity model.
The goal of this paper is to introduce a multiscale model for studying P. aeruginosa swarming which is very complex and involves sophisticated quorum sensing (QS) schemes and cell and environment interactions. During the course of swarming, cells extract extracellular “wetting” liquid from substrate. The motion of the individual flagellated P. aeruginosa as well as the swarm expansion is then aided by changes in physical properties within and on the surface of the newly developed thin liquid film. It has been observed that swarming patterns of P. aeruginosa differentiate and swarming rate increases on surfaces with a higher contact angle of liquid.20 We have recently found that higher surface hydrophobicity leads to increased rhamnolipid (rhl) production by bacteria in very close proximity to the advancing edge of swarming cells, which is sufficient to dominate the resulting swarm phenotype.
Moreover, preliminary experimental results show that swarming motility would only develop for a certain range of agar concentrations.20 Within this range of agar concentrations, it has been observed that the spreading process of P. aeruginosa is accompanied by a liquid film development.
Several models have been developed to study P. aeruginosa QS system.12,22 To the best of our knowledge, no attempts have been made to model P. aeruginosa swarming combining QS molecular processes and cell–cell and cell–environment interactions.
The multiscale model described in this paper combines continuum submodels and a discrete stochastic submodel into a multiscale modeling environment for studying P. aeruginosa swarming. At the continuum level, thin liquid film submodel is used to describe the hydrodynamics of mixture of the liquid and the bacteria moving using flagella. Convection-diffusion equations describe evolution of QS signals and nutrient. A cell-based stochastic discrete submodel is used to describe the motion of individual P. aeruginosa at the microscopic level. Continuum and discrete submodels are coupled in space and time.
Using this model wild type and rhlAB mutant P. aeruginosa swarming has been simulated. Simulation results confirm experimental observations that the ability of rhl synthesis to produce liquid is critical to colony expansion (see Fig. 1). Rhamnolipid also functions as a bio-surfactant. Simulations demonstrate that the gradient of rhamnolipid in the liquid and on the surface of the liquid create surface tension gradient that drives liquid spreading. This greatly extends bacterial swarming and results in formation of fractal shaped structures at the edge of the swarm with “fingers” protruding outwards. Also, simulations demonstrate the presence of high concentrations of bacteria at the swarm edge.
Fig. 1.
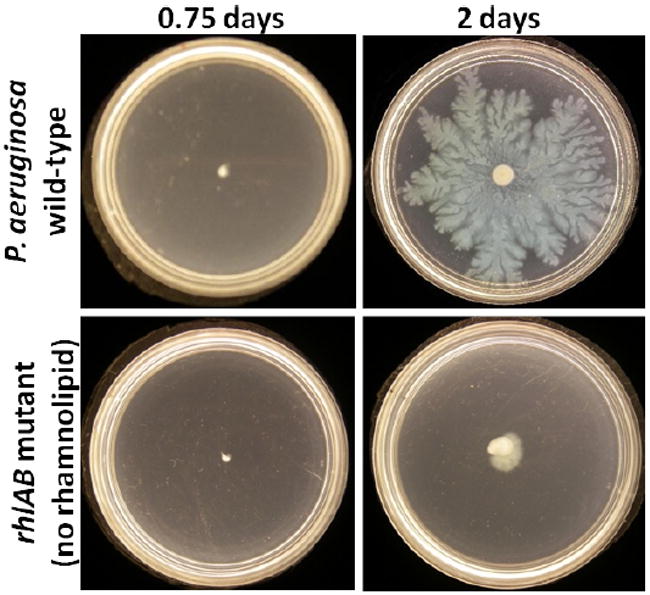
Swarming plate motility assays for wild-type and rhlAB strains of P. aeruginosa.
The paper is organized as follows. Section 1 presents an overview of bacteria swarming. Section 2 describes biological background of P. aeruginosa swarming. The multiscale model is described in Sec. 3. Simulation results are discussed in Sec. 4. Conclusions are presented in Sec. 5.
2. Biological Background
Pseudomonas aeruginosa is a common gram-negative bacterium. It is one of many bacteria that utilize a cell–cell signaling mechanism, called quorum sensing, to coordinate gene expression. Quorum sensing bacteria use diffusible or excreted chemical signals as cues to coordinate gene expression among bacterial communities for a variety of different activities including: luminescence, DNA uptake, sporulation, antibiotic production, and in the case of P. aeruginosa, virulence. Swarming motility of P. aeruginosa has also been shown to be greatly influenced by quorum sensing via the production of rhamnolipid (rhl) — a bio-surfactant at high cell density as a quorum sensing response.21 The rhlI and rhlR quorum sensing genes regulate transcription of rhlA and production of P. aeruginosa rhamnolipid that acts to lower the surface tension effectively to allow increased flagellar surface motility.6 However, the influence of quorum sensing upon swarming motility has been shown to be conditional; changes to the growth medium (e.g. chemical composition) can significantly impact both P. aeruginosa surface motility and the importance of cell–cell signaling as bacteria attach to surfaces.25
P. aeruginosa uses its single polar flagellum that operates as a rear propulsion engine when swarming. Propulsion forces could also be generated by the many type IV pili of P. aeruginosa. However, most studies suggest that swarming requires only the flagellum and swarming is sometimes increased in the absence of type IV pili.7,23,25
3. Mathematical Model
3.1. Cell-based stochastic off-lattice submodel for individual cells
We use a simplified version of the off-lattice model, as introduced in Refs. 32 and 33, to describe the elastic properties of the P. aeruginosa cell body. Individual cell is represented by N (N = 3) nodes connected by N − 1 segments moving on a substrate (see Fig. 2). Each segment is of width d = 2R and length li. There are N − 2 angles θi between neighboring segments.
Fig. 2.
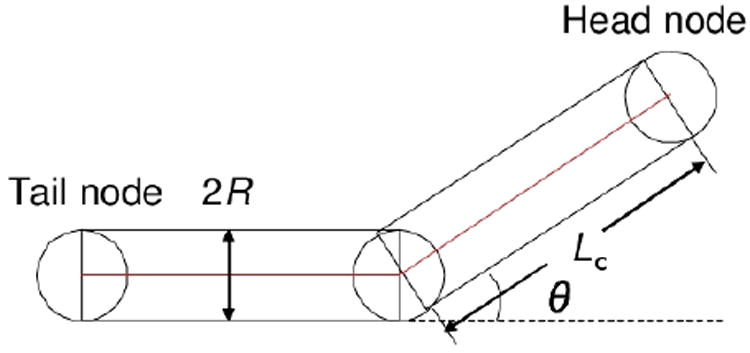
Example of a cell representation with three nodes together with basic parameters.
At each simulation step, each cell is led forward by the random motion of its head node of a velocity in a randomly selected direction. This velocity can be equal to a small random walk velocity, cell swimming velocity or a combination of them. Then, other two nodes make a number of tentative movements to move in preferred directions with small random deviations. The tail node tends to move along the direction pointing from itself to the middle node, while the middle node moves in the direction from tail to head node. Such tentative movements will be accepted in a way to minimize the body energy Hamiltonian consisting of bending and stretching terms:
| (3.1) |
where li and θi are segment lengths and angles between two segments respectively, Kb and Kθ are phenomenological stretching and bending coefficients, analogous to the spring constants in Hooke’s law. Due to the stochastic features in the above model for cell body movement, cells can keep their lengths within certain range while being able to bend flexibly. Also, cells swarm in the liquid extracted from substrate by bio-surfactant rhamnolipid, they move with liquid.
Cell consumes nutrient and stores it which is represented as nutrient level in a cell body. If nutrient level in a cell reaches a threshold, cell divides into two daughter cells.
A simple quorum sensing system is employed on each cell, with only one QS signal molecule which corresponds to autoinducers of P. aeruginosa (AHL). This signal activates the synthesis of the biosurfactant rhamnolipid, which is necessary for the cells to swarm on the surface. If the concentration of rhamnolipid is greater than a given threshold, liquid is extracted from the substrate. The cells have two stages controlled by threshold levels of QS chemical concentration: (1) the solitary or planktonic state, and (2) the activated state.
Solitary or planktonic state
At the beginning of the simulation, QS chemical concentration is set to be low and all cells are in the solitary or planktonic state. Cells move randomly within the initial thin liquid layer. Cells also produce QS signal and release it into the liquid layer. The local QS concentration increases gradually. Here we assume that nutrient is abundant for cells to move, grow and divide. So stationary or starvation state is not considered in this model.
Activated state
Once the local concentration of QS signal is greater than the given threshold, cells become activated and begin to produce rhamnolipid. The biosurfactant rhamnolipid works as a wetting agent. High level of rhamnolipid concentration will extract liquid from the substrate. So we assume that if the concentration of rhamnolipid is greater than a given threshold, wetting liquid is extracted from the substrate at constant rate.
3.2. Continuum submodels at the macroscale
To study the influence of thin liquid film on wild type bacteria swarming, we consider the spreading of fluid of initial thickness H in the layer of extent L (H ≪ L), of viscosity μ, density ρ and surface tension γ. This liquid contains soluble surfactant rhamnolipid of initially uniform surface and bulk concentrations Γm and γm resting on a horizontal solid substrate. We assume that the substrate is initially coated with a very thin layer of liquid of uniform thickness Hb (see Fig. 3 for a side view of the liquid profile). Wild type cells only exist within the liquid layer excluding the precursor.
Fig. 3.
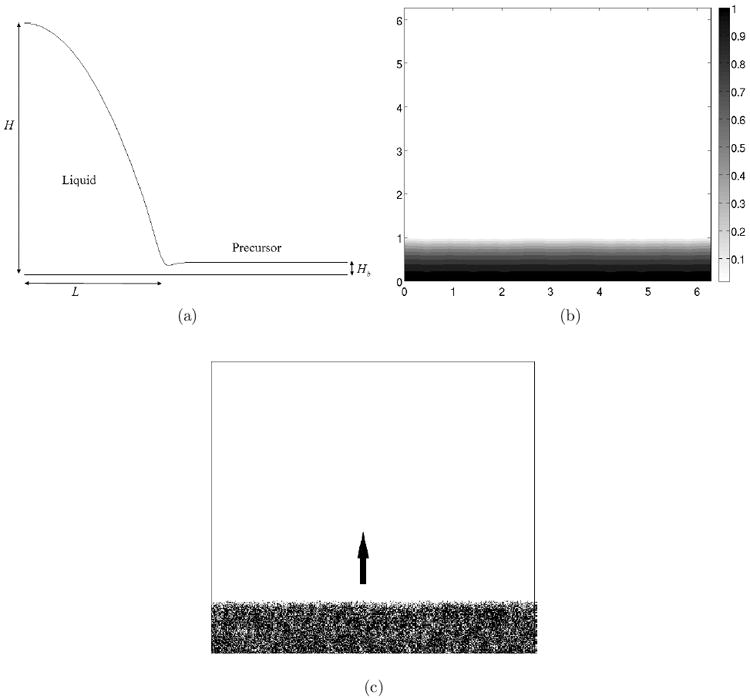
(a) Side view of the initial thin film profile; (b) Initial density of the thin film; (c) Initial cell distribution. The arrow shows direction of cell movement.
3.2.1. Liquid thin film submodel
Since a typical colony is of the order of 0.1mm in depth and may expand to be of the order of 100mm in diameter, we employ the following thin viscous fluid flow equation obtained by using a lubrication approximation of the Navier–Stokes equation4,10,24,31 to describe the liquid layer:
| (3.2) |
where h is the thickness of the liquid coating layer on a planar substrate, μ is the dynamic viscosity (μ = ρν), γm is the minimal surface tension at maximum packing and, E describes extraction of liquid by rhamnolipid produced by bacteria. The vertically averaged fluid velocity U is computed by
| (3.3) |
P. aeruginosa secretes soluble surfactant, rhamnolipid, which changes the surface tension of the liquid film. Marangoni stresses arise due to non-uniformities in the surface tension at the interface between the gaseous and aqueous phases that in turn, are induced by local differences in interfacial surfactant concentration. These stresses drive flow from areas of high surfactant concentration to less contaminated regions. Term accounts for the Marangoni-driven instability.
Marangoni force is driven by the initial difference between the surface tension of the liquid with initial surfactant concentration, γm, and the higher surface tension of the initial underlying uncontaminated film, γc. We denote the maximal difference of surface tension as S = γc − γm.
Surface tension γ depends on the surface concentration of rhamnolipid Γ. We employ the constitutive law proposed in Ref. 24 and utilized in Refs. 10 and 31 to describe the dependence of the surface tension on the rhamnolipid concentration:
| (3.4) |
where α = γm/S.
Viscosity μ is dependent on the suspension of cells. We adopt the effective Newtonian viscosity model developed by Verberg et al.28 which is also used in Refs. 3 and 4 for studying Serratia liquefaciens swarming:
| (3.5) |
where
| (3.6) |
ϕ is the sphere volume density of cells and μ0 is the pure solvent viscosity. This effective Newtonian viscosity model takes into account physical inter-particle interactions, but neglects the microscopic details of the interactions of cells with the background flow and with each other. Recently, it has been found that interactions of cells with the background flow and with each other actively decrease the effective Newtonian viscosity of the suspension.17,27 In the present work, we neglect this effect for simplicity.
3.2.2. Model of quorum sensing and nutrient uptake
All cells need nutrients to survive, grow and divide. In the current model, we make a simplification by using one QS signal, denoted as q, to represent the effects of lasI, rhlI and other signals in the complex QS system. Cellular nutrient uptake, production of QS signals and rhamnolipid concentration are modeled using reaction-advection-diffusion equations describing dynamics of various field concentrations:
| (3.7a) |
| (3.7b) |
| (3.7c) |
| (3.7d) |
where n denotes concentration of nutrient, q denotes QS chemical, Γ and c represent concentration of rhamnolipid on liquid surface and in liquid bulk, respectively. U is the fluid velocity, computed by Eq. (3.3), and Us is the surface velocity. Both U and Us are calculated at each time step from thin film evolution equation.
First terms on the right-hand side of the above equations describe field diffusion, where Dn, Dq, DΓ and Dc represent diffusion rates.
Second terms on the right-hand side of Eqs. (3.7a), (3.7b) and (3.7d) represent uptake of nutrient by cells (An being negative uptake rate) in Eq. (3.7a), secretion of QS signal in Eq. (3.7b) and rhamnolipid molecules by cells in Eq. (3.7d) (Aq or Ac being positive production rate to be measured experimentally). Notice that these terms couple the off-lattice submodel and continuum submodels. Namely, corresponding concentration field is modified locally by bacteria located within the finite difference grid cell at each time step.
Second term on the right-hand side of Eq. (3.7c) and third term on the right-hand side in Eq. (3.7d) represent solubility, where k1 and k2 are adsorption and desorption rate constants.
Last terms of the above equations represent decay of the molecule concentration, where Bn, Bq, BΓ and Bc represent decay rates.
The above model parameter values are listed in Table 1. Initial conditions and boundary conditions are the same as in Ref. 30. The nutrient field concentration determines growth/division of cells, while QS and rhamnolipid fields affect motility of cells in a threshold-dependent manner. QS threshold concentration is reached when bacteria population density is sufficiently high. In this study, we do not consider the nutrient depletion since nutrient level in laboratory experiments we are modeling is kept very high.
Table 1.
Parameter values used in the simulations.
| Parameters | Values | Reference |
|---|---|---|
| Number of nodes per cell (N) | N = 3 | |
| Cell width | 0.3–0.8 micron | |
| Cell length | 1.0–1.2 micron | |
| Individual cell velocity | 4.64 cell length min−1 | 25 |
| Viscosity of water | 0.890 cP | |
| Viscosity of liquid with cell suspension | 200 cP | 1 |
| Liquid production rate | 0.0001–0.001 | |
| Liquid density | 1.0 g cm−3 | water |
| Rate of Quorum sensing signal production | 0.05 min−1 | 4 |
| Rate of QS-induced rhamnolipid production | 0.6 min−1 | 4 |
| Height of liquid layer | 100 μm | Estimated |
| Cell reproduction rate | 0.42 hr−1 | 25 |
| Surface tension of water | 72 mN m−1 | 8 |
| Surface tension of rhamnolipid | 30.8 mN m−1 | 8 |
| Diffusion rate for nutrient (Dn) | 0.0001 | |
| Diffusion rate for rhl on liquid surface (DΓ) | 0.0001 | |
| Diffusion rate for rhl in liquid bulk (Dc) | 0.0000003 | |
| Solubility parameter (β) | 1.0 | 30 |
| Sorption of rhl (K) | 1.0 | 30 |
| Decay of chemicals (Bn, BΓ, Bc) | 0.0 |
3.2.3. Coupling of the off-lattice model and continuum submodels into a multiscale model
In our model, cells move on off-lattice grid, while equations of thin film and chemicals are solved on the partial differential equations (PDEs) grid. The off-lattice grid is superimposed on and aligned with PDE grid and can be considered as the refinement of the PDE grid. Once the sizes of two grids are specified, the coordination correspondence between two grids is established. In this work, we use 2000 × 2000 grid blocks for the off-lattice grid. An interpolation operator is used to average concentration of extracellular QS signal or rhamnolipid molecules generated by cells from the off-lattice grid and map it onto the PDE grid. Similarly, an interpolation operator is used to interpolate and map fluid velocity from the PDE grid onto the off-lattice grid.
Each simulation time step consists of a substep of cell-based off-lattice model followed by a substep for evolving PDE solutions. During the substep for the off-lattice model, cells move to a new location, consume nutrient, which modifies the local nutrient field, grow and divide. We also solve the intracellular QS model for each cell. The updated internal AHL and rhamnolipid are secreted by cells and modify the local extracellular QS signal concentration. During the PDE time step the liquid film is evolved and diffusion and convection of extracellular signals are modeled by solving convection-diffusion equations. Average cell velocity which was measured experimentally, is used to calibrate time step in the off-lattice model. These provides connection between physical time scale and time scale of the off-lattice submodel which is also used for continuum PDE submodels.
3.3. Initial distribution
P. aeruginosa swarms usually consist of many millions of cells. Considering the radial symmetry of a swarm, it is not necessary to simulate the entire colony to study the swarming dynamics of cells. Rather, we simulate a small sector of the swarming edge where most processes and interactions essential for swarming occur. We approximate it as a rectangle domain.
The typical domain size is 2π × 2π, and the typical number of cells in our simulations is 105. Hence, each cell represents ≈ 102 bacteria. To focus our simulation on studying the effect of the production of rhamnolipid, liquid extraction and cell motion during bacteria swarming, we skip the early transient phases and start simulation after some liquid has already been accumulated above the substrate, by imposing an initial height profile of the liquid. Figure 3 shows such initial rectangular swarming edge domain filled with cells. Model parameters are listed in Table 1.
3.4. Numerical methods
Simulations are performed on a two-dimensional domain of size 0 < x < 2π, 0 < y < 2π. The domain is discretized by a uniform 200 × 200 mesh with grid cell size Δx = Δy = π/100. We define grid cells Ii,j = [xi−1/2, xi+1/2] × [yj−1/2, yj+1/2]. Here i = 1, …, 200; j = 1, …, 200. xi−1/2 = (i − 1)Δx, yj−1/2 = (j − 1) Δy. The centers of the cells are xi = 1/2(xi−1/2 + xi+1/2), yj = 1/2(yj−1/2 + yj+1/2). Numerical solution is calculated at the center (xi, yj) of grid cell Ii,j. Simulations are subject to the following boundary conditions:
| (3.8) |
where b is the typical thinkness of the initially undisturbed film. Periodic boundary conditions are imposed along the edges of the grid at x = 0 and x = 2π.
There is a challenging numerical problem caused by the nonlinear high-order terms ∇ · h3∇∇2h in the thin film model equation (3.2). We use Crank–Nicholson approach to treat this high order term. The numerical algorithm used to compute solutions for thin film model is a finite difference scheme that couples a Crank–Nicolson scheme for ∇ · h3∇∇2h term with explicit scheme for other terms. The numerical scheme used to solve thin film equation at grid cell center (xi, yj) is described as
| (3.9) |
Then we compute liquid velocity Un+1 and surface velocity from the updated value of thin film height profile hn+1, which are needed to calculate advective terms U · ∇n, U · ∇q, U · ∇c and ∇ · (UsΓ) in the chemical PDEs for the next time step.
Convection-reaction-diffusion equations for nutrient, QS chemical and rhamnolipid concentrations are solved by the following schemes
| (3.10) |
| (3.11) |
| (3.12) |
| (3.13) |
where diffusion components of each chemical equation are solved by a Crank–Nicolson time discretization scheme. The convection components are discretized using explicit scheme, and the reaction components are updated by the cell movement in each finite difference grid on the last time step.
We utilize the Krylov subspace iterative method implemented in PETSC package2 to solve system of linear equations (3.7) resulted from discretizing quorum sensing and nutrient uptake governing equations, and the Newton–Krylov subspace iteration method implemented in KINSOL package9 to solve system of nonlinear equations (3.2) resulted from discritizing thin film equation. Equation (3.2) is highly nonlinear. Due to stability issues related to solving Eq. (3.2), small time steps of the order 10−5 are used.
Current simulation code has been parallelized on the MPI-based Linux cluster at the University of Notre Dame and resulting in a linear speed-up.
4. Discussion of the Simulation Results
Laboratory experiments6 have shown that rhamnolipid is important for P. aeruginosa swarming. Wild type cultures produce rhamnolipid while rhlAB mutants produce none. Significant differences in swarm diameter were observed among strains. The wild type strain swarms fast and expands to cover the whole plate in about two days while rhlAB mutant swarms poorly (Fig. 1). This difference is thought to be caused by the thin liquid film extracted by high concentration of rhamnolipid from the substrate. Colony expansion of wild type strain is accompanied with the spread of a thin liquid film, which is produced as a result of QS process. The bacteria produce rhamnolipid in response to the QS. Then rhamnolipid extracts liquid from the agar as well as decreases the surface tension of the liquid. On the other hand, there is no significant liquid extraction observed in experiments with the rhlAB-deficient strain.
We use our model to illustrate the influence of the thin film of liquid on the bacterial swarming by conducting two comparative simulations for wild type P. aeruginosa and rhlAB mutant swarming on agar substrate. We also compare cell density distribution and water height profile from simulations with the experiments. To compare expansion speed of cell colony in different cases, we define an expansion rate as in Eq. (4.1).
| (4.1) |
In the simulation of the wild type bacteria swarming, the liquid production rate from Table 1 is used. In experiments, cells usually take hours to build the liquid layer. We assume that initially in our simulations there is already a very thin liquid layer on the substrate to skip the initial phase of bacterial swarming. The initial liquid profile is as follows:
| (4.2) |
where H(x) = [1 + tanh(100x)]/2, A ∈ (10−3 − 10−2), B = 5, 1 ≤ N ≤ 4, ki ≤ 30 and Ci ~ O(1). These initial conditions mimic fluid cap covered by surfactant of essentially uniform concentration positioned on an undisturbed film of much smaller thickness. Set of cosine functions represent perturbations consisting of several transverse modes localized at the edge of the fluid cap.30 The initial distribution of cells is shown in Frame C of Fig. 3. Figure 4 shows the contour plot of the edge of the colony swarming on the wild type strain plate. Figure 5 presents expansion rate in this case.
Fig. 4.
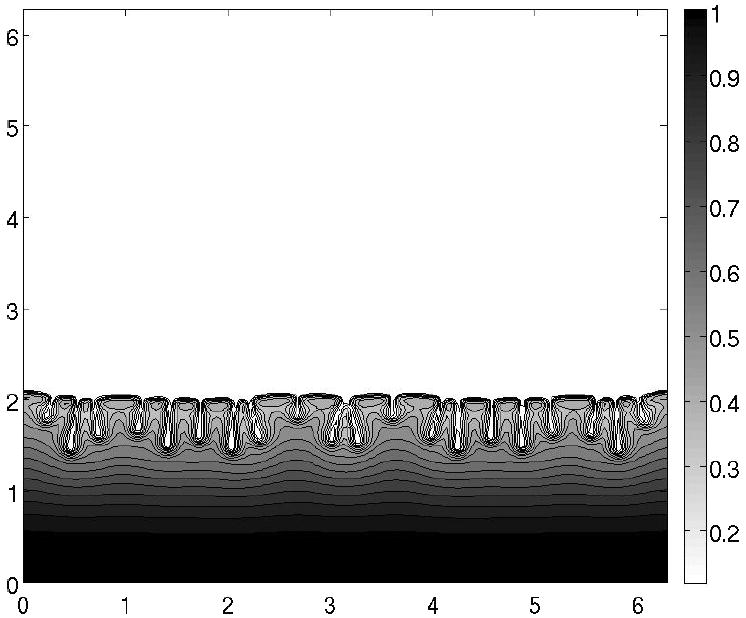
Profile of the liquid film. Wild type P. aeruginosa swarm differentiates at the edge into tendrils off cells (fingers) when high concentrations of rhamnolipid are produced.
Fig. 5.
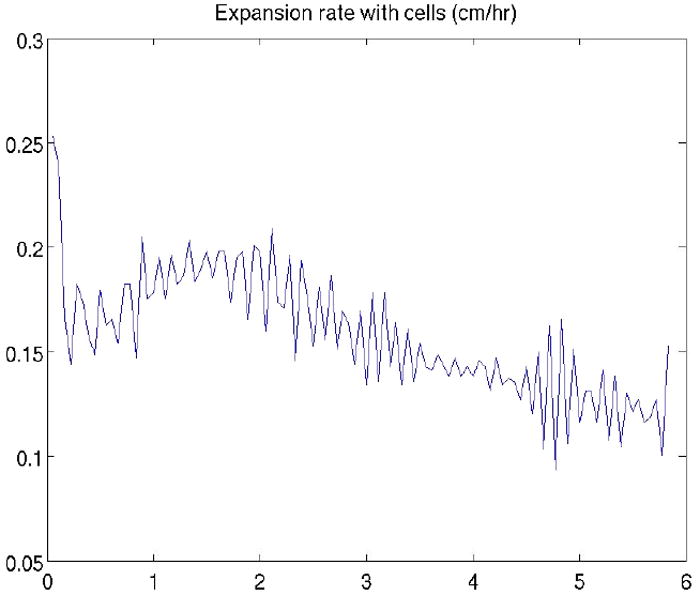
Wild type P. aeruginosa swarm expansion rate in simulations.
Water production rate was set to zero in the simulations of the rhlAB mutant swarming. No liquid is extracted from the substrate. Therefore, we do not use an initial liquid layer in the simulations and cells move without the help of a spreading thin liquid film. Figures 5 and 6 show expansion rates for the wild type strain and rhlAB mutant cases, respectively. Comparison of two sets of data follows that, without water extraction, the expansion rate of cell colony is extremely low and cells are compactly assembled together. With water extraction, swarm grows fast and fingering instability at the edge gets amplified. These simulation results are consistent with the experimental observations (Fig. 1). Swarming of the wild type P. aeruginosa is much faster than that of the rhlAB mutant. The experimental and simulation results show that rhamnolipid is crutial for P. aeruginosa swarming.
Fig. 6.
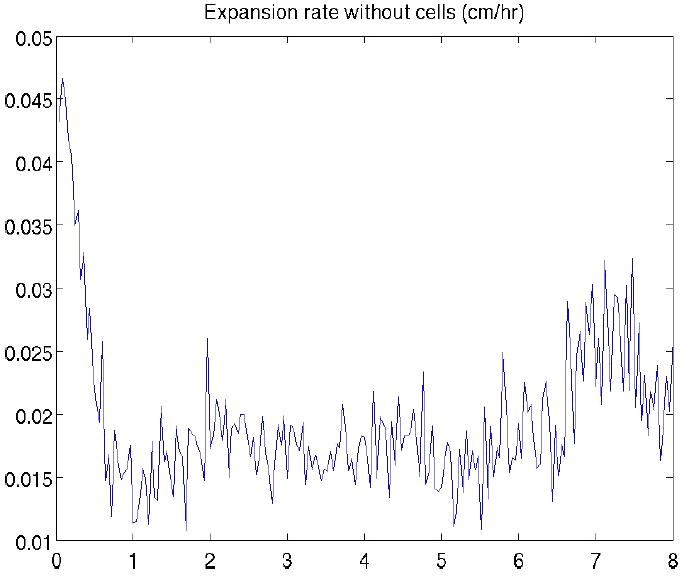
RhlAB mutant P. aeruginosa swarm expansion rate in simulations.
5. Conclusions
In this paper we presented a multiscale model for the study of P. aeruginosa swarming. Simulations of wild type and rhlAB mutant bacrerial swarming have been conducted and compared with each other. Simulation results qualitatively agree to the experimental observations. Both have shown that wild type P. aeruginosa, which produces rhamnolipid and releases it into environment, swarms much faster than rhlAB mutant which produces no rhamnolipid. Simulation results suggest that rhamnolipid plays an important role in bacteria swarming in two ways. On one hand, high level of rhamnolipid concentration results in extraction of liquid from substrate followed by spreading of thin liquid film which helps P. aeruginosa swarm by carrying bacteria cells forward and allowing them to move on their own using flagella. On the other hand, as a bio-surfactant, rhamnolipid lowers local surface tension, which in turn eases liquid spreading and cell movement. Simulations demonstrated that combination of these mechanisms could result in formation of fingers (tendrils) at the edge of a swarm which have been earlier observed in experiments.
Acknowledgments
This research was supported in part by the National Science Foundation (DMS-0800612 and DMS-0719895) (H.D., Z.-L.X., and M.A.) and the Indiana Clinical and Translational Science Institute (NIH # UL1RR025761) (J.D.S.).
Contributor Information
HUIJING DU, Department of Applied and Computational Mathematics and Statistics, University of Notre Dame, Notre Dame, IN 46637, USA.
ZHILIANG XU, Department of Applied and Computational Mathematics and Statistics, University of Notre Dame, Notre Dame, IN 46637, USA.
JOSHUA D. SHROUT, Department of Civil Engineering and Geological Sciences, University of Notre Dame, Notre Dame, IN 46556, USA Eck Institute for Global Health University of Notre Dame, Notre Dame, IN 46556, USA, jshrout@nd.edu.
MARK ALBER, Department of Applied and Computational Mathematics and Statistics, University of Notre Dame, Notre Dame, IN 46637, USA; Department of Medicine, Indiana University School of Medicine, Indianapolis, IN 46202, USA, malber@nd.edu.
References
- 1.Angelini TE, Roper M, Kolter R, Weitz DA, Brenner MP. Bacillus subtilis spreads by surfing on waves of surfactant. Proc Natl Acad Sci USA. 2009;106:18109–18113. doi: 10.1073/pnas.0905890106. [DOI] [PMC free article] [PubMed] [Google Scholar]
- 2.Balay S, Gropp WD, McInnes LC, Smith BF. Technical Report ANL-95/11-Revision 2.1.3. Argonne National Laboratory; 2002. PETSc users manual. [Google Scholar]
- 3.Bees MA, Andresen P, Mosekilde E, Givskov M. The interaction of thin-film flow, bacterial swarming and cell differentiation in colonies of Serratia liquefaciens. J Math Biol. 2000;40:27–63. doi: 10.1007/s002850050004. [DOI] [PubMed] [Google Scholar]
- 4.Bees MA, Andresen P, Mosekilde E, Givskov M. Quantitative effects of medium hardness and nutrient availability on the swarming motility of Serratia liquefaciens. Bull Math Biol. 2002;64:565–587. doi: 10.1006/bulm.2002.0287. [DOI] [PubMed] [Google Scholar]
- 5.Ben-Jacob E, Cohen I, Levine H. The cooperative self-organization of microorganisms. Adv Phys. 2000;49:395–554. [Google Scholar]
- 6.Caiazza NC, Shanks RMQ, O’Toole GA. Rhamnolipids modulate swarming motility patterns of Pseudomonas aeruginosa. J Bacteriol. 2005;187:7351–7361. doi: 10.1128/JB.187.21.7351-7361.2005. [DOI] [PMC free article] [PubMed] [Google Scholar]
- 7.Caiazza NC, Merritt JH, Brothers KM, O’Toole GA. Inverse regulation of biofilm formation and swarming motility by Pseudomonas aeruginosa PA14. J Bacteriol. 2007;189:3603–3612. doi: 10.1128/JB.01685-06. [DOI] [PMC free article] [PubMed] [Google Scholar]
- 8.Chen G, Qiao M, Zhang H, Zhu H. Sorption and transport of naphthalene and phenanthrene in silica sand in the presence of rhamnolipid biosurfactant. Separ Sci Technol. 2005;40:2411–2425. [Google Scholar]
- 9.Collier AM, Hindmarsh AC, Serban R, Woodward CS. Technical Report UCRL-SM-208116. Lawrence Livermore National Laboratory; 2009. User documentation for kinsol v2.6.0. [Google Scholar]
- 10.Craster RV, Matar OK. Numerical simulations of fingering instabilities in surfactant-driven thin films. Phys Fluids. 2006;18:032103. [Google Scholar]
- 11.Czirok A, Ben-Jacob E, Cohen I, Vicsek T. Formation of complex bacterial colonies via self-generated vortices. Phys Rev E. 1996;54:1791–1801. doi: 10.1103/physreve.54.1791. [DOI] [PubMed] [Google Scholar]
- 12.Dockery JD, Keener JP. A mathematical model for quorum sensing in Pseudomonas aeruginosa. Bull Math Biol. 2001;63:95–116. doi: 10.1006/bulm.2000.0205. [DOI] [PubMed] [Google Scholar]
- 13.Dombrowski C, Cisneros L, Chatkaew S, Goldstein RE, Kessler JO. Self-concentration and large-scale coherence in bacterial dynamics. Phys Rev Lett. 2004;93:098103. doi: 10.1103/PhysRevLett.93.098103. [DOI] [PubMed] [Google Scholar]
- 14.Eberl L, et al. Involvement of N-acyl-L-homoserine lactone autoinducers in controlling the multicellular behavior of Serratia liquefaciens. Mol Microbio. 1996;20:127–136. doi: 10.1111/j.1365-2958.1996.tb02495.x. [DOI] [PubMed] [Google Scholar]
- 15.Eberl L, Molin S, Givskov M. Surface motility in Serratia liquefaciens. J Bacteriol. 1999;181:1703–1712. doi: 10.1128/jb.181.6.1703-1712.1999. [DOI] [PMC free article] [PubMed] [Google Scholar]
- 16.Golding I, Kozlovsky Y, Cohen I, Ben-Jacob E. Studies of bacterial branching growth using reaction–diffusion models for colonial development. Physica A. 1998;260:510–554. [Google Scholar]
- 17.Haines BM, Sokolov A, Aranson IS, Berlyand L, Karpeev DA. Three-dimensional model for the effective viscosity of bacterial suspensions. Phys Rev E. 2009;80:041922. doi: 10.1103/PhysRevE.80.041922. [DOI] [PubMed] [Google Scholar]
- 18.Helbing D. Traffic and related self-driven many-particle systems. Rev Mod Phys. 2001;73:1067–1141. [Google Scholar]
- 19.Kaiser D. Coupling cell movement to multicellular development in myxobacteria. Nat Rev Microbiol. 2003;1:45–54. doi: 10.1038/nrmicro733. [DOI] [PubMed] [Google Scholar]
- 20.Kamatkar NG, Leevy WM, Shrout JD. Surface hydrophobicity influences rhamnolipid swarming but does not affect growth for Pseudomonas aeruginosa. 2010 submitted. [Google Scholar]
- 21.Kohler T, Curty LK, Barja F, van Delden C, Pechere J. Swarming of Pseudomonas aeruginosa is dependent on cell-to-cell signaling and requires flagella and pili. J Bacteriol. 2000;182:5990–5996. doi: 10.1128/jb.182.21.5990-5996.2000. [DOI] [PMC free article] [PubMed] [Google Scholar]
- 22.Netotea S, Bertani I, Steindler L, Kerenyi A, Venturi V, Pongor S. A simple model for the early events of quorum sensing in Pseudomonas aeruginosa: modeling bacterial swarming as the movement of an “activation zone”. Biol Direct. 2009;4 doi: 10.1186/1745-6150-4-6. [DOI] [PMC free article] [PubMed] [Google Scholar]
- 23.Rashid MH, Kornberg A. Inorganic polyphosphate is needed for swimming, swarming, and twitching motilities of Pseudomonas aeruginosa. Proc Natl Acad Sci USA. 2000;97:4885–4890. doi: 10.1073/pnas.060030097. [DOI] [PMC free article] [PubMed] [Google Scholar]
- 24.Sheludko A. Thin liquid films. Adv Colloid Interface Sci. 1967;1:391–464. [Google Scholar]
- 25.Shrout JD, Chopp DL, Just CL, Hentzer M, Givskov M, Parsek MR. The impact of quorum sensing and swarming motility on Pseudomonas aeruginosa biofilm formation is nutritionally conditional. Mol Microbiol. 2006;62:1264–1277. doi: 10.1111/j.1365-2958.2006.05421.x. [DOI] [PubMed] [Google Scholar]
- 26.Sokolov A, Aranson IS, Kessler JO, Goldstein RE. Concentration dependence of the collective dynamics of swimming bacteria. Phys Rev Lett. 2007;98:158102. doi: 10.1103/PhysRevLett.98.158102. [DOI] [PubMed] [Google Scholar]
- 27.Sokolov A, Aranson IS. Reduction of viscosity in suspension of swimming bacteria. Phys Rev Lett. 2009;103:148101. doi: 10.1103/PhysRevLett.103.148101. [DOI] [PubMed] [Google Scholar]
- 28.Verber R, de Schepper IM. Viscosity of colloidal suspensions. Phys Rev E. 1997;55:3143–3158. [Google Scholar]
- 29.Verstraeten N, Braeken K, Debkumari B, Fauvart M, Fransaer J, Vermant J, Michiels J. Living on a surface: Swarming and biofilm formation. Trends in Microbiol. 2008;16:496–506. doi: 10.1016/j.tim.2008.07.004. [DOI] [PubMed] [Google Scholar]
- 30.Warner MRE, Craster RV, Matar OK. Fingering phenomena created by a soluble surfactant deposition on a thin liquid film. Phys Fluids. 2004;16:2933–2951. [Google Scholar]
- 31.Warner MRE, Craster RV, Matar OK. Fingering phenomena associated with insoluble surfactant spreading on thin liquid films. J Fluid Mech. 2004;510:169–200. [Google Scholar]
- 32.Wu Y, Jiang Y, Kaiser D, Alber M. Social interactions in myxobacterial swarming. PLoS Comput Biol. 2007;3:e253. doi: 10.1371/journal.pcbi.0030253. [DOI] [PMC free article] [PubMed] [Google Scholar]
- 33.Wu Y, Kaiser AD, Jiang Y, Alber M. Periodic reversal of direction allows Myxobacteria to swarm. Proc Natl Acad Sci USA. 2009;106:1222–1227. doi: 10.1073/pnas.0811662106. [DOI] [PMC free article] [PubMed] [Google Scholar]
- 34.Zhang HP, Be’er A, Smith RS, Florin EL, Swinney HL. Swarming dynamics in bacterial colonies. Europhys Lett. 2009;87:48011. [Google Scholar]


