Abstract
Drugs that inhibit specific histone deacetylase (HDAC) activities have enormous potential in preventing the consequences of acute injury to the nervous system and in allaying neurodegeneration. However, very little is known about the expression pattern of the HDACs in the central nervous system (CNS). Identifying the cell types that express HDACs in the CNS is important for determining therapeutic targets for HDAC inhibitors and evaluating potential side effects. We characterized the cellular expression of HDACs 1–3, and HDACs 4 and 6, in the adult mouse brain in the cingulate cortex, parietal cortex, dentate gyrus, and CA1 regions of the hippocampus and subcortical white matter. Expression of class I HDACs showed a cell-and region-specific pattern. Transient focal ischemia induced by temporary middle cerebral artery occlusion, or global ischemia induced by in vitro oxygen–glucose deprivation, altered the extent of HDAC expression in a region- and cell-specific manner. The pan-HDAC inhibitor, SAHA, reduced ischemia-induced alterations in HDACs. The results suggest that in addition to promoting epigenetic changes in transcriptional activity in the nucleus of neurons and glia, HDACs may also have non-transcriptional actions in axons and the distant processes of glial cells and may significantly modulate the response to injury in a cell- and region-specific manner.
Keywords: Axon, Dentate gyrus, Astrocytes, Neurogenesis, Neurovascular unit
Introduction
Histone deacetylases (HDACs) are categorized as either “zinc-dependent” or “NAD-dependent” (sirtuins). The former are class I (HDAC 1–3 and 8), class II (HDAC 4–7, 9, and 10), or class IV (HDAC 11) based upon sequence similarity. Roles for specific HDACs in brain maturation and function, and in the CNS response to injury, are slowly being elucidated [1–5]. Inhibitors of the zinc-dependent HDACs promote “neuronal” differentiation of neural progenitor cells [3, 6] and also protect existing neurons from insult [7–9]. These inhibitors are structurally diverse, suggesting different mechanisms of action, and all exhibit some HDAC isoform selectivity [10]. The hydroxamate compounds (such as SAHA and TSA) and the small carboxylates inhibit class I and class II HDACs. The benzamide MS-275 and also valproic acid have a narrower range and target HDACs chiefly in class I. Despite promoting nuclear p53 accumulation, class I/II HDAC inhibitors protect postnatal mouse cortical neurons from p53-dependent cell death. The HDAC inhibitors suppress p53-dependent expression of PUMA, a critical signaling intermediate linking p53 to Bax activation, and prevent post-mitochondrial events, including cleavage of caspase-9 and caspase-3 [11].
Recently, we showed that class I HDACs are abundantly expressed in white matter axons and glial cells and that pan- and class I-specific HDAC inhibitors dramatically improve functional recovery of axons, while preserving cellular architecture, in an in vitro model of ischemic white matter injury [12]. We have gone on to characterize the cellular expression of HDACs 1–3 (and HDACs 4 and 6) in the adult mouse brain in the cingulate cortex, parietal cortex, dentate gyrus, and CA1 regions of the hippocampus and subcortical white matter. The expression of class I HDACs showed a cell- and region-specific pattern. Transient focal ischemia induced by temporary middle cerebral artery occlusion (MCAo), or global ischemia induced by in vitro oxygen–glucose deprivation (OGD), altered the extent of HDAC expression in a region- and cell-specific manner.
Materials and Methods
The Institutional Animal Care and Use Committee approved all experimental procedures.
Transient Middle Cerebral Artery Occlusion
This was performed on anesthetized male C57bl/6 mice (25–30 g), as previously described [13]. Anesthesia was induced by inhalation of 3% isoflurane and maintained by inhalation of 1.5% isoflurane. Body temperature was monitored throughout surgery (via a rectal probe) and maintained at 36–38°C using a heating blanket. Focal cerebral ischemia was induced by occlusion of the right middle cerebral artery for 45 min and the filament withdrawn gently back into the common carotid artery in order to allow reperfusion to take place. After 1 week of recovery, mice were re-anesthetized, perfusion-fixed (4% paraformaldehyde in PBS), and the brains were removed and kept in fix solution for another 24 h at 4°C before cryoprotection in 30% sucrose for immunohistochemistry.
Preparation of Optic Nerves and Oxygen–Glucose Deprivation
Mouse optic nerves (MONs) were gently freed from their dural sheaths, placed in a perfusion chamber superfused with artificial CSF (ACSF), and continuously aerated by a humidified gas mixture of 95%O2/5% CO2. All experiments were performed at 37°C. The OGD was induced by switching to glucose-free ACSF (replaced with equimolar sucrose to maintain osmolarity) and a gas mixture containing 95% N2/5% CO2. The OGD was applied for 60 min, glucose and O2 were restored, and compound action potentials (CAPs) were recorded for up to 5 h. To explore the role of HDAC inhibitors in OGD-induced upregulation of HDAC 1–3, the pan inhibitor SAHA (1 µM, Selleck, Houston, TX; dissolved in DMSO as 1 mM stock) was used. The inhibitor was applied starting 30 min before, during (60 min), and 30 min after the end of OGD. Evoked CAPs were recorded throughout to ensure that the time course of events were typical for the experimental conditions. At the end, MONs were collected and stored in 4% paraformaldehyde in PBS overnight at 4°C for immunohistochemistry. Cryoprotection was achieved in 10%, 20%, and then 30% sucrose for 2–4, 8–10, and 16–18 h, respectively.
Immunohistochemistry
Ten- to 30-µm-thick sections from each MON were blocked and permeabilized in 5–40% normal goat/donkey (50% by volume) serum (Sigma, St. Louis, MO) and 0.3% Triton X-100 (Sigma) for 60 min at room temperature. Fifty- to 200-µm-thick free-floating sections from each brain were blocked and permeabilized in 5% normal donkey serum (Sigma) and 1% Triton X-100 (Sigma) for 60 min at room temperature. All primary antibodies were prepared in their respective solutions (Table 1). Astrocytes were identified with a polyclonal antibody to glial fibrillary acidic protein (GFAP; DiaSorin, Stillwater, MN) or a monoclonal GFAP antibody conjugated to Cy3 (Sigma). Axons were labeled with a monoclonal antibody to neurofilaments (NF-200), and neurons were identified with a polyclonal antibody to membrane-associated protein 2 (MAP2). Antibodies to HDACs 1–4 and 6 (monoclonal or polyclonal) were obtained from Sigma-Aldrich and Sytox from Invitrogen (Carlsbad, CA). Primary antibodies were used at a dilution of 1:15 for polyclonal GFAP (pre-diluted six times), 1:1,000 for monoclonal GFAP, 1:400 for NF-200, 1:5,000 for MAP2, 1:250 for HDAC 1–4 and 6, and 1:25,000 for Sytox. Brain sections were incubated in primary antibodies at 4°C for 2 days with constant shaking, while MONs were incubated in primary antibodies at 4°C overnight without shaking. After a thorough wash in PBS, the tissue was exposed to a secondary antibody, prepared in 2% normal goat serum for overnight incubation. Donkey anti-rabbit Cy5, anti-mouse Cy5, anti-mouse Cy3, and anti-chicken Cy3 and anti-guinea pig (Jackson ImmunoResearch, West Grove, PA) were used at 1:100 for MONs and at 1:250 dilution for free-floating brain sections. Sections were double or triple labeled to co-localize structures of interest. Tissue was obtained from at least three different mice, and labeling was repeated two to three times by two different investigators for each mouse. We confirmed the specificity of each HDAC antibody in extracts prepared from primary cortical neurons treated with specific HDAC shRNAs.
Table 1.
Antibodies used
| Antigen | Dilution | Source |
|---|---|---|
| GFAP (polyclonal) | 1:15 (pre-diluted 6 times) | Immunostar/DiaSorin, |
| GFAP (monoclonal, conjugated to Cy3) | 1:1,000 | Sigma-Aldrich |
| HDAC 1 (polyclonal) | 1:250 | Sigma-Aldrich |
| HDAC 2 (polyclonal) | 1:250 | Sigma-Aldrich |
| HDAC 2 (monoclonal) | 1:250 | Sigma-Aldrich |
| HDAC 3 (polyclonal) | 1:250 | Sigma-Aldrich |
| HDAC 4 (polyclonal) | 1:250 | Sigma-Aldrich |
| HDAC 6 (polyclonal) | 1:250 | Sigma-Aldrich |
| NF-200 (monoclonal) | 1:400 | Sigma-Aldrich |
| MAP 2 (polyclonal) | 1:5,000 | Abcam |
| Sytox | 1:25,000 | Millipore/Invitrogen |
Confocal Microscopy Imaging
The expression of MAP2, NF-200, GFAP, or Sytox was imaged using an Olympus (Center Valley, PA) FV1000 upright laser scanning confocal microscope. Sections were scanned with an argon and He–Ne laser for Cy3/543, for Cy5/633, and for Cy2/488 fluorescence. Two or three adjacent sections from each MON were imaged for a total of three or eight areas of interest per MON. Comparative anatomical regions from each brain (ipsilateral or contra-lateral to MCAo) were imaged per coronal brain section. A total of 30 or 50 optical sections of 1-µm thickness at 1,024 × 1,024-pixel size from MONs or brain slices, respectively, were collected in the z-axis from a single microscopic field using the ×60 (PlanApo, oil immersion; numerical aperture, 1.42; Olympus) or ×40 (UPlanFL, oil immersion; numerical aperture, 1.30; Olympus) objective lens under fixed gain, laser power, pinhole, and PMT settings. Panoramic images were formed by taking multiple low-magnification (×4, UPlanSApo, N.A. 0.16) images in the z-axis (1-µm-thick sections in 200-µm-thick slices). To compare and quantify immunohistochemical staining, all sections were processed concurrently. Images were acquired with Olympus FluoView imaging software in sequential mode using multiple channels simultaneously. Z-stacks were projected into a single plane image before assessment of co-localization.
Results
HDAC Expression Pattern is Region- and Cell-Specific in the Adult Brain
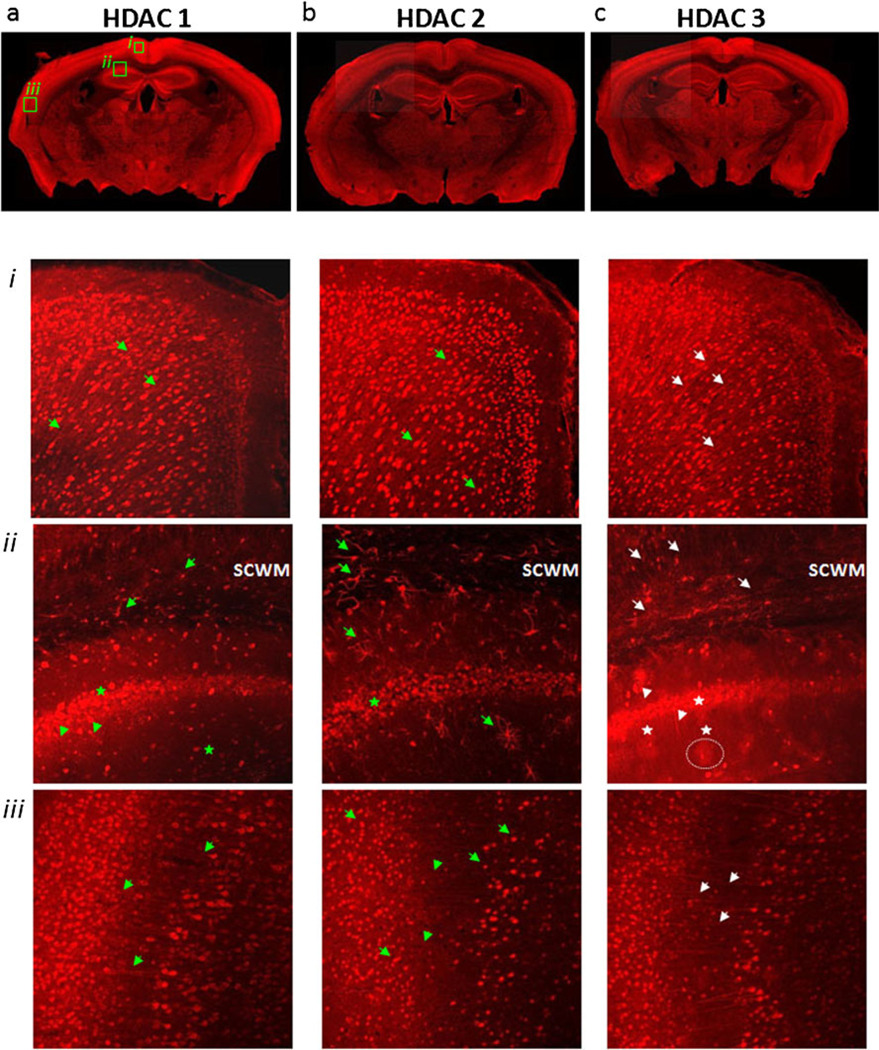
In coronal brain slices, we evaluated the expression and localization of HDACs 1–3 (Fig. 1), and for comparison HDACs 4 and 6 (data not shown), using immunohistochemistry with isoform-specific antibodies and confocal imaging. Panoramic images (see “Materials and Methods”) revealed the expression of HDACs 1–3 to be widespread and prominent (Fig. 1a–c), particularly in regions such as the cerebral cortex. Class II isoforms HDAC 4 and HDAC 6 demonstrated comparably less intense labeling. The expression of HDAC 4 was stronger than HDAC 6 and primarily located in neuronal cytoplasm and in axons (data not shown) in the parietal cortex. Interestingly, in some layers of cortex, HDAC 4 labeling was scattered and most neurons were void (data not shown). The expression of HDAC 6, though very low, was mostly in neuronal cytoplasm (data not shown).
Fig. 1.
Class 1 HDAC expression in the adult mouse brain. HDACs 1 (a), 2 (b), and 3 (c) are highly expressed in cortical and hippocampal neurons, with relative detection decreasing in other neuronal cells away from the cortex and low expression in areas of white matter. a In cingular (i) and parietal (iii) cortex, HDAC 1 expression was in neuronal cell bodies and in their axons. In hippocampal CA1–CA2 junction (ii), HDAC 1 expression was prominent in pyramidal cell bodies (stars) and was visible in some dendrites (arrowheads). In overlying subcortical white matter (SCWM), HDAC 1 expression was present in some nuclei and associated processes (arrows). b HDAC 2 expression was localized to neuronal nuclei in cingulate (i) and parietal cortex (iii) (arrows) and hippocampal pyramidal cells (ii) (stars). In some sections of the parietal cortex (iii), HDAC 2 labeling was faintly visible in axons (arrowheads). HDAC 2 expression was very prominent in SCWM and hippocampus (ii) in some astroglial nuclei and uniformly outlining their associated processes (arrows). c HDAC 3 was expressed in the nuclei of neurons and axons in cingulate and parietal cortex (i and iii) (arrows), but in the cytoplasm of pyramidal neurons of the hippocampus (stars), as well as in their axons and dendrites (ii) (arrowheads). Note HDAC 3 nuclear labeling associated with the synaptic domains of interneurons away from the pyramidal cell layer (dotted line)
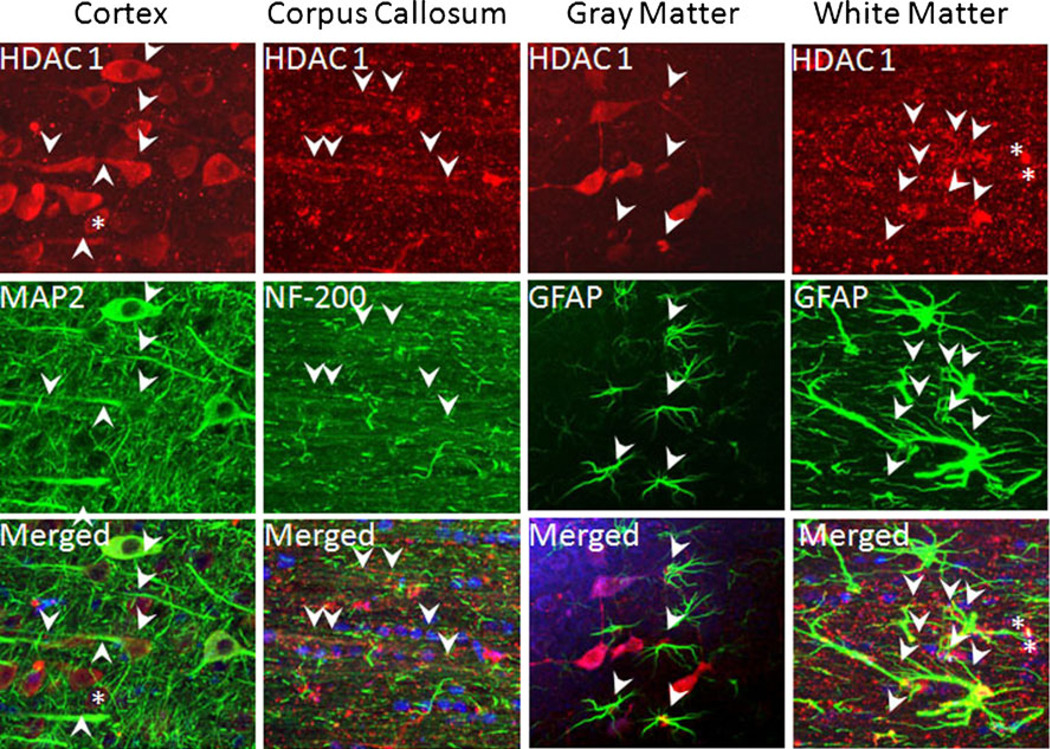
To determine cell type-specific expression of class I HDAC isoforms, we performed double or triple labeling using cell- and HDAC isoform-specific antibodies. The expression of HDAC 1 (Fig. 2, cortex column) co-localized with MAP2(+) neuronal cell bodies (Fig. 2, left panels), completely outlining the cytoplasm but excluding the nuclei (Fig. 2, left panels, merged, nuclei, star). Immunoreactivity also co-localized with NF-200(+) axons (Fig. 2, corpus callosum column, arrowheads). In addition to neuronal expression, HDAC 1 was expressed in the nuclei and cytoplasm of GFAP(+) astrocytes in the hippocampus (Fig. 2, gray matter column) and subcortical white matter (Fig. 2, white matter column). Expression was also observed, to some extent, in astrocyte end-feet (Fig. 2, white matter column, arrowheads, and Fig. 6a, left lower panel, arrows). Note that despite prominent axonal labeling, HDAC 1 expression did not outline dendrites in the hippocampus. In subcortical white matter (SCWM), HDAC 1 immunoreactivity was occasionally noted in cells (mostly nuclear (Fig. 2, asterisk) in addition to astrocytes, and these were identified as APC(+) oligodendrocytes (data not shown).
Fig. 2.
HDAC 1 expression in the cortex, corpus callosum, hippocampus, and subcortical white matter (SCWM). HDAC 1 displayed a clear cytoplasmic (arrows) and axonal (arrowheads) pattern in cortical neurons (cortex, upper panel) and co-localized with MAP2(+) neuronal cell bodies and axons (cortex, middle panel). Sytox(+) blue nuclei were visible in the merged images. Similarly, HDAC 1 (corpus callosum, upper panel) co-localized with NF-200(+) axons (arrowheads, left middle panel) in the corpus callosum. HDAC 1 was limited to the nuclei of GFAP(+) astrocytes in the hippocampus (gray matter, arrows). In SCWM, HDAC 1 labeling was detected in the nuclei (white matter, arrows) and to some extent in the proximal portions of the main processes and end-feet (arrowheads) of GFAP(+) astrocytes (green) outlining penetrating arterioles. Note the distinct co-localization of HDAC 1 and GFAP in the merged images, which confirmed that HDAC 1 exhibits a region (gray vs. white matter) specific labeling pattern in astrocytes
Fig. 6.
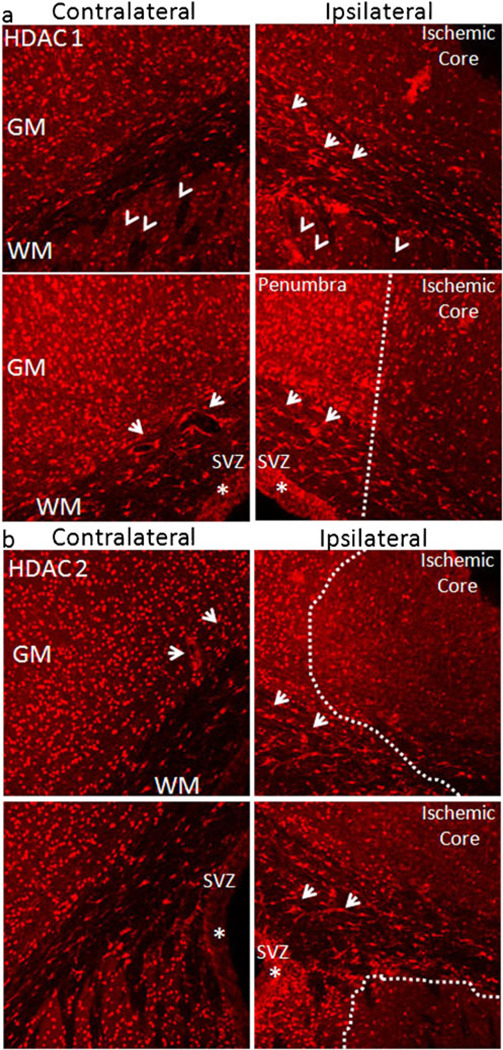
Ischemia upregulates HDAC 1 and HDAC 2 expression. a Following MCAo (ipsilateral, 45 min), HDAC 1 was reduced in the ischemic core (dotted line separates the ischemic core from the penumbra), but upregulated in spared neurons of the surrounding penumbra in cortex, striatum (arrowheads), SVZ (star), as well as in glial cells in the SCWM (arrows, right panels) compared with the corresponding contralateral regions (left panels). Note how capillaries were encircled with bright HDAC 1 labeling in contralateral sections (arrows, lower left panel). b Following MCAo (ipsilateral, 45 min), HDAC 2 was reduced in the ischemic core, but upregulated in spared neurons of the surrounding penumbra in cortex, SVZ (star), as well as glial cells in the SCWM (arrows, right panels) compared with corresponding contralateral regions (left panels). Note that some striatal neurons (outlined with dotted lines) demonstrated loss of HDAC 2, while those adjacent to the SVZ upregulated HDAC 2. Capillaries were regularly encircled with bright HDAC 2 labeling (contralateral section; arrows, upper left panel)
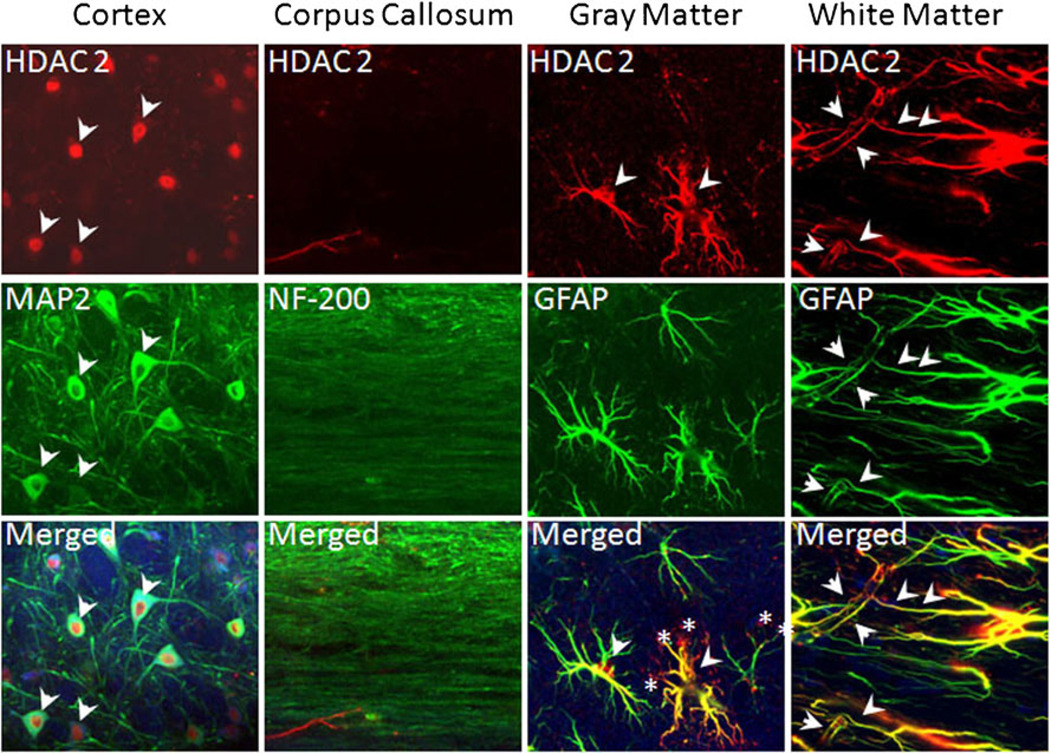
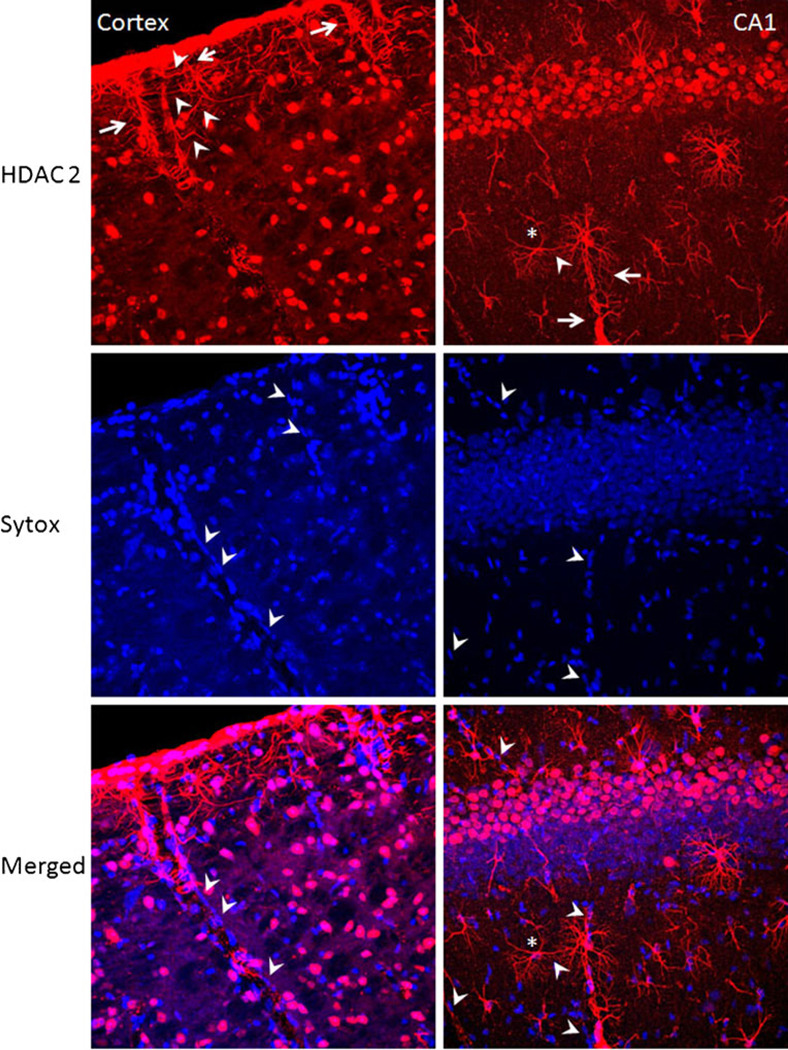
In contrast to HDAC 1, the expression of HDAC 2 (Fig. 3, cortex column, arrows) was principally nuclear in MAP2(+) neurons (Fig. 3, left panels, merged) and the cytoplasm was spared. The nuclear nature of HDAC 2 labeling in neurons was further supported by the lack of HDAC 2 immunoreactivity in NF-200(+) axons (Fig. 3, corpus callosum column). Interestingly, HDAC 2 was abundant in nuclei (Fig. 3, gray and white matter columns, arrows), cytoplasm, and along the entire processes of astrocytes in the hippocampus and in SCWM (Fig. 3). Indeed, HDAC 2 labeling in the hippocampus identified astrocyte processes beyond the extent of GFAP immunoreactivity (Fig. 3, gray matter column, merged, asterisk). A similar co-localization of HDAC 2 on GFAP(+) astrocytes was observed in SCWM, where HDAC 2 labeling extended to the finest processes as well as to end-feet (arrowheads in Fig. 3, white matter column, and Fig. 8, right and left panels), consistently outlining interdigitating arterioles in SCWM, larger pial arteries in cortex (Fig. 8, cortex column, arrows), and penetrating capillaries in CA1 (Fig. 8, CA 1 column, arrows) and dentate regions of the hippocampus (Fig. 5, left panels, arrows).
Fig. 3.
HDAC 2 expression in neurons, astrocytes, and their end-feet. HDAC 2 (cortex, upper panel, arrows) demonstrated a distinct nuclear pattern in neurons, filling the center of MAP(+) neuronal cell bodies (cortex, middle panel). Consistent with this nuclear expression, HDAC 2 labeling was absent in NF-200(+) axons (corpus callosum, middle panel) in the corpus callosum. HDAC 2 is robustly expressed in GFAP(+) astrocyte nuclei and cell bodies (gray matter), filling astrocyte processes in the hippocampus (arrows) and SCWM (white matter). HDAC 2 is highly expressed in astrocyte end-feet (arrows), precisely outlining the interdigitating arterioles (arrows) in SCWM (merged, white matter lower panel). Note that HDAC 2 labeling identified astrocytes beyond their GFAP(+) immunoreactivity (white matter panel, stars)
Fig. 8.
HDAC 2 is robustly expressed in the neurovascular unit. HDAC 2 consistently labeled astrocyte end-feet in larger pial arteries in the cortex (left panels) and also penetrating small capillaries in the hippocampus (right panels). The HDAC 2 labeling was limited to astrocyte end-feet in the neurovascular unit. Endothelial cells (arrowheads, labeled blue with Sytox) did not express HDAC 2
Fig. 5.
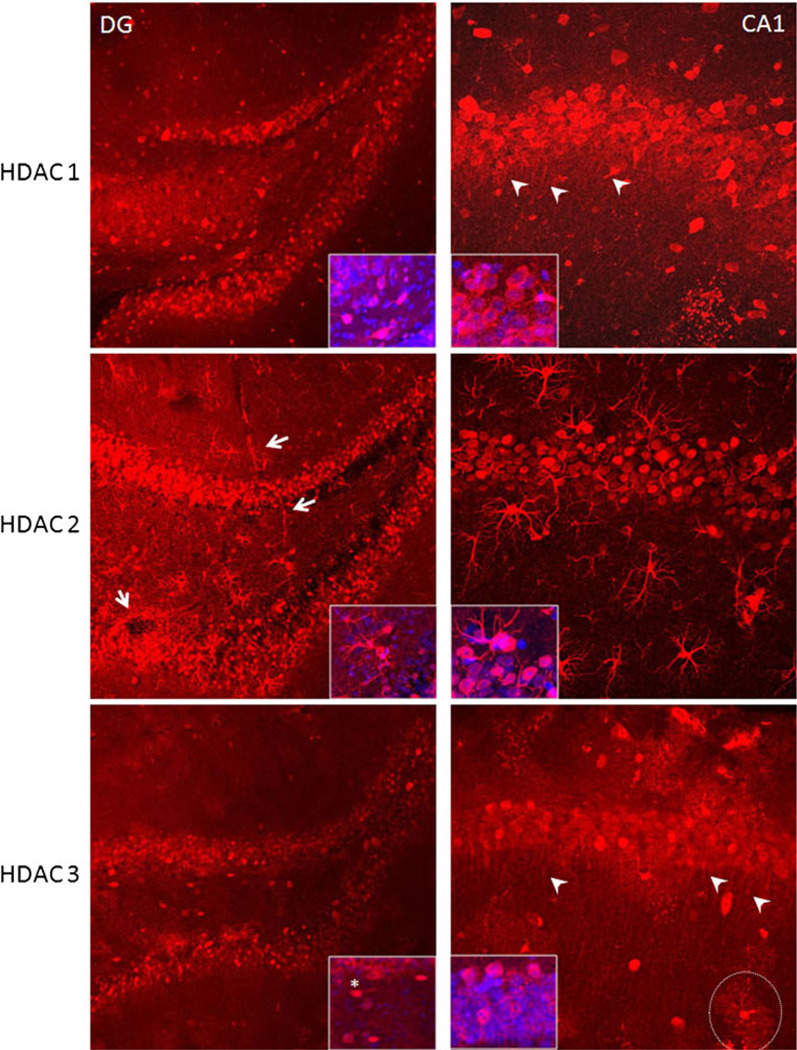
HDAC 1–3 expression in the dentate gyrus and the CA1 regions of hippocampus. HDAC 1 (upper panels) was compared in the dentate gyrus (DG), a site of neurogenesis, and the CA1 region which is known to undergo apoptosis even after very transient ischemic injury. HDAC 1 labeling was mainly expressed in the cytoplasm of DG granule cells and in CA1 pyramidal neurons. This was confirmed with blue Sytox(+) nuclei filling the center of neurons (see insets). Note that HDAC 1 labeled dendrites of CA1 pyramidal neurons (upper right panel, arrows), but not neuronal processes in DG. HDAC 2 (middle panels) was expressed in the nuclei of DG granule cells and in the cytoplasm of CA1 pyramidal cells (see insets for blue nuclei labeled with Sytox). In addition, astrocytes diffusely expressed HDAC 2 in their nuclei, cell bodies, processes, and end-feet outlining the vasculature (left middle panel, arrows). HDAC 3 was mainly expressed in the nuclei of DG granule cells and in the nuclei and cytoplasm of CA1 pyramidal cells. Note that some cells in between the upper and lower blades of the DG express HDAC 3 in their cytoplasm (insets). The punctate nature of HDAC 3 expression was more prominent in the CA1 region, especially around interneurons, and outlined their synaptic domains (dotted circle). HDAC 3 expression was also present in CA1 pyramidal cell dendrites (arrows)
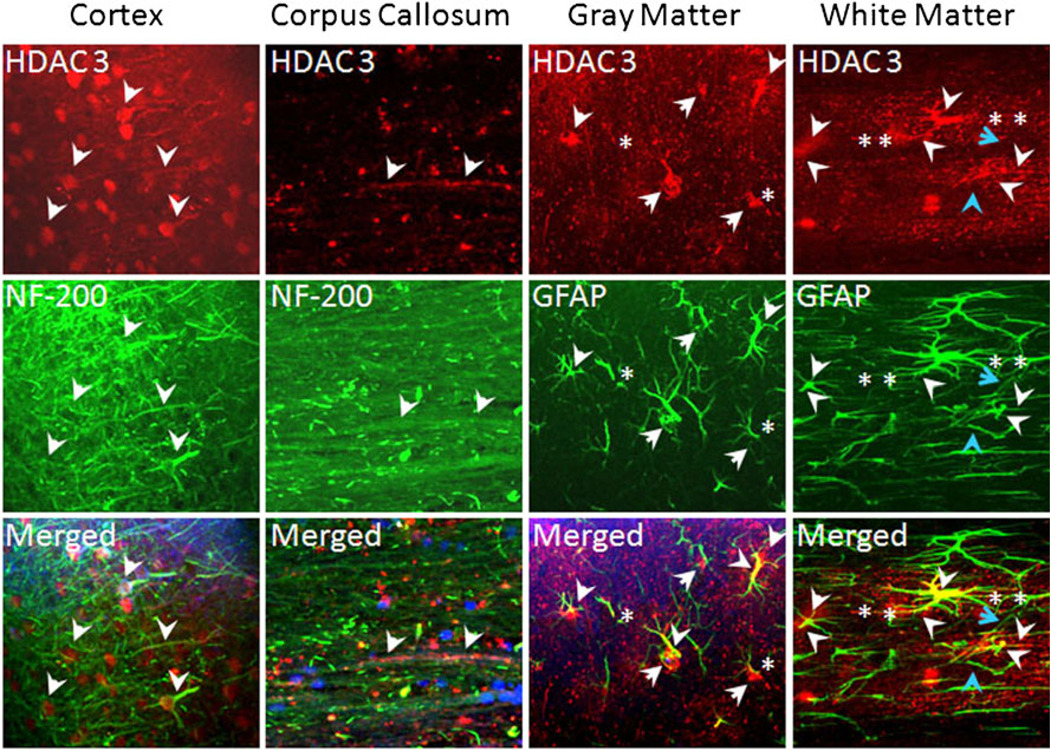
The expression pattern of HDAC 3 was mixed. In neurons, HDAC 3 was nuclear (Fig. 4, cortex column, arrows) but was also expressed in proximal axons (Fig. 4, cortex column arrowheads). Consistent with this, HDAC 3 labeling co-localized with NF-200(+) axons (Fig. 4, corpus callosum column, arrows), albeit to a lesser extent compared with HDAC 1. Astrocytes expressed HDAC 3 in their nuclei and cytoplasm (Fig. 4, gray matter column, arrows) and in the proximal portions of their main processes in the hippocampus and in SCWM (Fig. 4, white matter column, arrowheads). In addition, HDAC 3 expression was punctate in distal processes of astrocytes in (Fig. 4, white matter column, asterisk), similar to white matter astrocytes in optic nerve [12]. Careful inspection revealed that HDAC 3 was not expressed in the end-feet regions of astrocytes (Fig. 4, white matter column, blue arrowheads); therefore, HDAC 3 expression did not delineate capillaries (Fig. 4, white matter column, blue arrows).
Fig. 4.
HDAC 3 is expressed in neuronal cell bodies, axons, in the nuclei, and distal processes of astrocytes. HDAC 3 exhibited a cytoplasmic (arrows) and axonal (arrowhead) pattern in cortical neurons (cortex) and co-localized with MAP2(+) neuronal cell bodies and axons (cortex, middle panel). HDAC 3 (right, upper panel) also co-localized with NF-200(+) axons (left, middle panel) in the corpus callosum. HDAC 3 was displayed in the nuclei (arrows) and proximal main processes (arrowheads) of GFAP(+) astrocytes in hippocampus (arrows) and SCWM (merged panels). Note the distinct punctate nature of HDAC 3 expression in both gray matter regions, co-localizing with distal processes of GFAP(+) astrocytes (stars). In the lower right panel, HDAC 3 labeling was absent in astrocyte end-feet (blue arrowhead), but outlined the vasculature (blue arrow)
HDACs 1, 2, and 3 are Abundantly Expressed in Subventricular Zone and Dentate Gyrus
In the healthy adult brain, neurogenesis normally occurs in the subventricular zone (SVZ) and hippocampal dentate gyrus (DG). Cerebral ischemia amplifies neurogenesis, and these new neurons may contribute to the observed functional recovery [14–17]. Histone protein modifications, such as acetylation and deacetylation, play a key role in regulating gene expression during the processes of cell proliferation and differentiation. Inhibitors of HDACs contribute to the survival of newborn neurons by inhibiting the apoptotic pathways during stroke. Therefore, we characterized the cellular expression pattern of HDACs 1–3 in SVZ (Fig. 6a, b) and in the DG in comparison to the CA1 region of the hippocampus, which is known to be extremely sensitive to transient global ischemia (Fig. 5).
The expression of HDAC 1 (Fig. 5, left upper panels) was abundant in cells comprising the upper and lower blades of the DG, outlining cell bodies but sparing nuclei (Fig. 5, left upper panel, see inset with nuclei in blue labeled with Sytox), and similar to HDAC 1 expression in cortical neurons (Fig. 2, cortex column). Interestingly, many neuronal nuclei around the granule cell layers were not labeled (inset). It was also apparent that HDAC 1 expression did not extend to proximal portions of the axons, in contrast to the HDAC 1 labeling pattern observed in the cortex. On the other hand, cellular expression of HDAC 1 in the CA1 region was similar to that in the cortex, with strong labeling of pyramidal cell bodies and outlining axons and dendrites (arrowheads in Fig. 5, right upper panel, confirmed with MAP2 co-labeling, data not shown).
The expression of HDAC 2 was principally nuclear in granule cells of the DG and entirely outlined astrocyte nuclei, cell bodies, and the entire length of processes and end-feet, both in the DG (Fig. 5, second row, arrows) and CA 1 region of the hippocampus. Interestingly, in CA1 pyramidal neurons, the expression of HDAC 2 was more abundant in cell bodies and cytoplasm rather than the nuclei and similar to HDAC 1 expression in the CA1. Note the small, round, hollow appearance in the center of neuronal cell bodies which are filled with Sytox(+) blue nuclei (Fig. 5, right second panel, inset). Neither axons nor dendrites were labeled with HDAC 2 in the DG and CA1 regions of the hippocampus.
HDAC 3 labeling was nuclear in the granule cells of the DG, but more abundant in the cytoplasm of pyramidal cells of the CA1 region (Fig. 5, lower panels). It was also prominent in dendrites of pyramidal neuronal cells in CA1 (arrowheads in Fig. 5, right lower panel, confirmed with MAP2 labeling, data not shown). Note the general punctate nature of HDAC 3 labeling (Figs. 4 and 5, lower right panel), which becomes particularly apparent when interneurons in CA1 regions are labeled and demarcates their synaptic domain (Fig. 5, right lower panel, dotted circle). The extensive expression of these HDACs in glia, in addition to neuronal structures and axons, implicates these as cellular targets of HDAC inhibitors [12].
Ischemia Upregulates HDACs 1, 2, and 3 Expression
Post-ischemic treatment with HDAC inhibitors has been shown to reduce infarct volume, cell death, and neuroinflammation and improve neurological performance in rodents after MCAo (for a review, see [8]). However, the effects of ischemia on the cellular expression of HDACs 1–3, and whether HDAC inhibitors alter their expression, are unknown. Therefore, we first evaluated HDAC 1–3 expression levels in SVZ, cortex, and SCWM in ipsilateral and contralateral sides of coronal brain slices obtained from mice that were exposed to 45 min MCAo, followed by 1 week of recovery (Fig. 6a, b; see “Materials and Methods”). Secondly, we verified our findings in MON exposed to OGD with or without the pan-HDAC inhibitor, SAHA (Fig. 7).
Fig. 7.
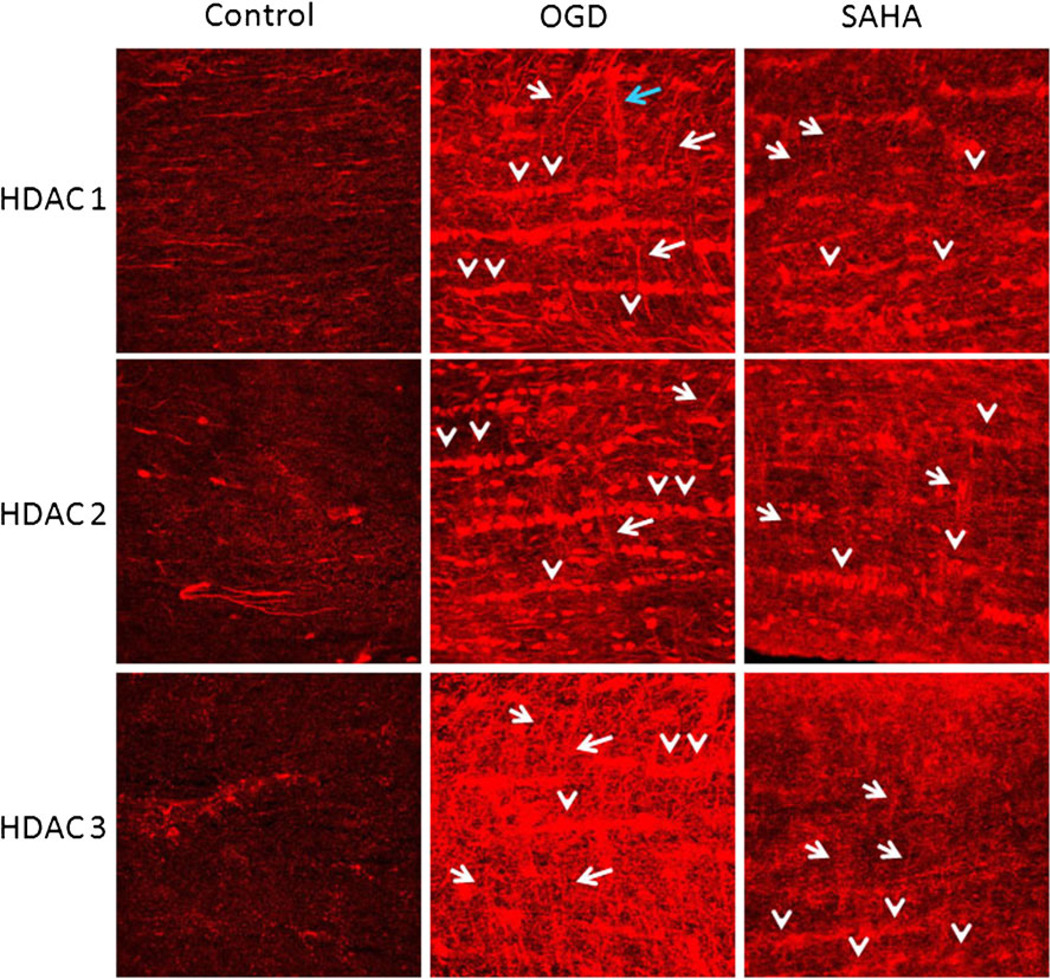
HDAC inhibition attenuates upregulation of class I HDAC isoforms. After 60 min of OGD, levels of HDAC 1–3 expression were upregulated in all glial cell nuclei (arrowheads) and processes of astrocytes (arrows) in MON. Note that OGD upregulated HDAC 3 most strongly (lower middle panel). HDAC inhibition with SAHA (1 µM), applied 30 min before, during, and 30 min after OGD, considerably attenuated HDAC 1–3 upregulation in MON
The expression of HDAC 1 was drastically reduced in the ischemic core (confirmed by the loss of MAP2 labeling and increase in pyknotic nuclei, data not shown), while the intensity of labeling prominently increased in adjacent SCWM cellular elements, in particular astrocytes (arrows, confirmed with GFAP labeling, data not shown) and striatal neurons as compared with contralateral labeling (Fig. 6a, left panels). Similarly, in cortical neurons adjacent to the ischemic core (penumbra, separated with dotted line; Fig. 6a, right lower panel), there was a comparable increase in HDAC 1 labeling. This was no longer confined to the neuronal nuclei in the penumbra, leading to an overall increase in background labeling. Interestingly, MCAo also led to an increase in HDAC 1 expression in ipsilateral SVZ compared with the uninjured side (Fig. 6a, compare lower panels, asterisks).
Ischemia induced a similar change in HDAC 2, an evident loss of expression in the ischemic core but an upregulation in SCWM (particularly in astrocytes, confirmed with GFAP labeling, data not shown) and penumbral regions (cortex, subcortical white matter, and SVZ (asterisk)), except the striatum (Fig. 6b, compare lower panels, note area outlined with dotted lines). The expression of HDAC 3 after MCAo showed identical changes to HDAC 2 (data not shown). These results suggest that a complex and regionally specific pattern of changes in histone deacetylation may contribute to ischemia-induced injury and subsequent neurogenesis.
HDAC Inhibition Attenuates Ischemia-Induced Upregulation of HDACs 1, 2, and 3
We have shown that HDAC inhibition attenuates ischemic injury to axon structure and function in the isolated mouse optic nerve preparations [12]. We verified that ischemia upregulated HDACs 1–3 in optic nerves and tested the hypothesis that HDAC upregulation was specific to ischemic injury (Fig. 7). MONs were exposed to OGD (60 min), with or without the HDAC inhibitor SAHA (1 µM). Control MONs (Fig. 7, left panels) were kept under normoxic conditions. Cellular patterns and characteristics of HDAC 1–3 expression in MONs were reported previously in detail [12]. Briefly, HDAC 1 is mainly expressed in axons and astrocyte nuclei, while HDACs 2 and 3 are primarily expressed in astrocytes. A period of OGD upregulated all three HDACs considerably, with HDAC 3 being the most prominent (Fig. 7, lower middle panel). As a result, all glial nuclei and cytoplasm (arrowheads) demonstrated HDACs 1–3 and some astrocytes expressed HDAC 1 and 2 in their main and distal processes (Fig. 7, middle panels, arrows), as well as in end-feet outlining penetrating arterioles (Fig. 7, upper middle panel, blue arrow). HDAC 3 was intensely expressed in all reactive astrocytes and in their processes (Fig. 7, lower middle panel, arrows). Application of SAHA (1 µM, 30 min before, during, and 30 min after the end of OGD) effectively attenuated HDAC expression; all glial nuclei and cytoplasm still expressed HDACs, but to a lesser extent (Fig. 7, right panels, arrowheads). The main difference was the loss of intensely labeled astrocyte processes. This was expected since we have shown that OGD causes astrocyte hypertrophy in MONs and HDAC inhibitors attenuate astrocyte reactivity [12]. We further verified that ischemia-induced upregulation in class 1 HDAC expression is a consequence of increased HDAC activity by labeling MONs obtained from control, OGD, and OGD+SAHA conditions for acetylated histone H3 (data not shown). In control optic nerves, H3 was observed in very few nuclei among numerous glial nuclei. The effect of OGD was to extensively upregulate H3 immunoreactivity such that all glial nuclei strongly expressed H3 and pretreatment of optic nerves with SAHA remarkably reduced this labeling. These results suggested that the ischemia-induced increase in class I HDAC expression was concomitant with increased HDAC activity and that SAHA effectively attenuated this.
HDAC 2 is Profusely Expressed in the Neurovascular Unit
The neurovascular unit consists of microvessels, endothelial cells, basal lamina matrix, astrocyte end-feet, and pericytes. Therefore, astrocytes, neurons and their axons, equally contribute to modulate and maintain the function and integrity of the neurovascular unit. Furthermore, experimental evidence indicates that astrocytes may provide a source of pro-MMP-9 and/or pro-MMP-2 upon stimulation with cytokines. These findings suggest that the HDACs expressed in astrocytes, in particular in their end-feet, may contribute to vascular matrix degradation and repair following a stroke. Our study consistently revealed HDAC 2 to be the most prominent isoform expressed in astrocyte end-feet, whether in larger pial arteries (Fig. 8, left panels, arrows) or in small penetrating arterioles in the hippocampus (Fig. 8, right panels, arrows). Note that the endothelial cells of the vessel wall do not express HDAC 2 (Fig. 8, middle panels, Sytox(+) flat elongated nuclei along the vessels, arrowheads). The expression of HDAC 1 was mostly noted on astrocyte end-feet around smaller penetrating arteries (right and lower left panels in Figs. 2 and 6a, respectively), while there was no detectable HDAC 3 expression in artery walls of any diameter.
Discussion
We determined that class I HDACs exhibit a cell- and region-specific expression pattern in the central nervous system (Table 2) and that an ischemic episode leads to the upregulation of their expression in the penumbra, SCWM, and SVZ (but not the injury core). Our findings suggest that the central nervous system response to injury and subsequent recovery may be modulated by HDAC expression, raising the possibility that cell- and region-specific use of HDAC inhibitors may represent therapeutic approaches.
Table 2.
Cell- and region-specific expression of class I HDAC isoforms
| Gray matter | White matter | ||||
|---|---|---|---|---|---|
| Cingulate | Parietal | CA1 | Dentate | SCWM | |
| HDAC 1 | |||||
| Neuron | + | + | + | + | |
| nuclei | − | − | − | − | |
| cytoplasm | + | + | + | + | |
| Axon | + | − | + | − | |
| Dendrite | − | + | − | ||
| Astrocyte | + | + | + | ||
| nuclei | + | + | + | ||
| cytoplasm | + | + | + | ||
| end-feet | + | + | + | ||
| HDAC 2 | |||||
| Neuron | + | + | + | + | |
| nuclei | + | + | − | + | |
| cytoplasm | − | − | + | ||
| Axon | + | + | − | − | |
| Dendrite | − | − | − | ||
| Astrocyte | + | + | + | + | |
| nuclei | + | + | + | + | |
| cytoplasm | + | + | + | + | |
| end-feet | + | + | + | + | |
| HDAC 3 | |||||
| Neuron | + | + | + | ||
| nuclei | + | + | − | ||
| cytoplasm | − | − | + | ||
| Axon | + | + | |||
| Dendrite | − | + | |||
| Astrocyte | + | + | |||
| nuclei | + | + | |||
| cytoplasm | + | + | |||
| end-feet | − | − | |||
+: expressed, −: not expressed
A significant finding in our study was that class I HDAC isoforms were readily expressed in cytoplasmic domains in addition to a more well-established nuclear localization in neurons. Consequently, HDAC 1 and HDAC 3 were prominently expressed in proximal axons and dendrites of neurons, as well as in axons of the corpus callosum. HDAC 2 labeling was more conventional, confined to the nuclei and absent in axonal and dendritic processes. Another interesting finding was that HDAC 2 displayed an extensive presence in nuclei, cell body, distal processes consisting of end-feet in astrocytes from white and gray matter, while HDACs 1 and 3 were expressed mostly in astrocyte nuclei. These findings inevitably raise the question of whether the diverse effects of HDAC inhibitors may be attributed to the differential roles of individual HDAC isoforms, their specific pattern of distribution among neurons and glial cells, and, in addition to transcriptional activation of genes, non-transcriptional actions in axons and the distant processes of glial cells. Application of HDAC inhibitors exerting a broad pharmacological range of action displays neuroprotective activity in several models of acute injury and neurodegeneration [7–10]. At least 11 different HDAC proteins have been identified, and several of these have been implicated in regulating diverse functions ranging from neuronal differentiation [3, 18] to stress-induced apoptosis [5, 11, 12, 19], mitochondrial transport [20], and to long-term memory formation [21]. Our results suggest that targeting specific HDAC isoforms may be beneficial and potentially reduce side effects and that cell- and region-specific isoform activity may be important for repair and residual tissue function following injury.
An exciting finding of our study was that an episode of focal ischemia uniformly upregulated class 1 HDAC expression and in a region-specific manner. Expression of all three isoforms was upregulated in the penumbra, SCWM, and SVZ, while significantly downregulated in the injury core. In vitro ischemia caused a similar upregulation of HDAC expression in the isolated mouse optic nerve preparation, suggesting that both neuronal and glial responses to ischemic injury involved class I HDAC isoforms. We further confirmed this suggestion by using the pan-HDAC inhibitor, SAHA, which effectively attenuated ischemia-induced HDAC upregulation in optic nerves. This finding is consistent with the hypothesis that elevated HDAC activity in response to ischemic injury may alter gene transcription patterns and other activities required for maintaining neuronal function and viability.
An emerging role for class I HDACs in neurogenesis is supported by their prominent expression in DG granule cells and SVZ. Extensive expression of HDAC 2 in astrocytes that surround the granule cells further questions the role of neuron–glial interaction in neurogenesis. In contrast, the widespread presence of HDAC 2 at the end-feet of astrocytes, thereby outlining blood vessels of all sizes, is an intriguing finding providing a provocative suggestion that HDACs may play a crucial role in the neurovascular response to injury and subsequent inflammation.
Diverse effects of HDAC inhibitors may be attributed to the differential role of individual HDAC isoforms, their specific pattern of distribution among neurons and glial cells, and their ability to exert both transcriptional and non-transcriptional actions in axons and glial cell processes. In summary, our data suggest that targeting specific HDAC isoforms may be beneficial and that cell- and region-specific isoform activity may be important for repair and tissue function following injury. Therefore, cell- and region-specific HDAC inhibition may be set as an attainable goal for therapeutic treatment.
Acknowledgments
This work was supported by the American Heart Association (S.B.), National Institutes of Health (NIH)–National Institute on Aging grant AG033720 (S.B.), and NIH–National Institute of Neurological Disorders and Stroke grant NS065319 (S.P. M., R.S.M.). We thank Rona Lee for performing the mouse MCAo surgery.
Footnotes
Disclosures The authors declare no conflicts of interest.
Contributor Information
Selva Baltan, Department of Neurology, University of Washington School of Medicine, Seattle, WA, USA.
Amelia Bachleda, Department of Neurology, University of Washington School of Medicine, Seattle, WA, USA.
Richard S. Morrison, Department of Neurological Surgery, University of Washington School of Medicine, Seattle, WA, USA
Sean P. Murphy, Department of Neurological Surgery, University of Washington School of Medicine, Seattle, WA, USA
References
- 1.Guan JS, Haggarty SJ, Giacometti E, Dannenberg JH, Joseph N, Gao J, et al. HDAC2 negatively regulates memory formation and synaptic plasticity. Nature. 2009;459(7243):55–60. doi: 10.1038/nature07925. [DOI] [PMC free article] [PubMed] [Google Scholar]
- 2.Kramer OH, Knauer SK, Greiner G, Jandt E, Reichardt S, Guhrs KH, et al. A phosphorylation-acetylation switch regulates STAT1 signaling. Genes Dev. 2009;23(2):223–235. doi: 10.1101/gad.479209. [DOI] [PMC free article] [PubMed] [Google Scholar]
- 3.Montgomery RL, Hsieh J, Barbosa AC, Richardson JA, Olson EN. Histone deacetylases 1 and 2 control the progression of neural precursors to neurons during brain development. Proc Natl Acad Sci U S A. 2009;106(19):7876–7881. doi: 10.1073/pnas.0902750106. [DOI] [PMC free article] [PubMed] [Google Scholar]
- 4.Rivieccio MA, Brochier C, Willis DE, Walker BA, D'Annibale MA, McLaughlin K, et al. HDAC6 is a target for protection and regeneration following injury in the nervous system. Proc Natl Acad Sci U S A. 2009;106(46):19599–19604. doi: 10.1073/pnas.0907935106. [DOI] [PMC free article] [PubMed] [Google Scholar]
- 5.Kim HJ, Leeds P, Chuang DM. The HDAC inhibitor, sodium butyrate, stimulates neurogenesis in the ischemic brain. J Neurochem. 2009;110(4):1226–1240. doi: 10.1111/j.1471-4159.2009.06212.x. [DOI] [PMC free article] [PubMed] [Google Scholar]
- 6.Lee S, Lee SK. Crucial roles of histone-modifying enzymes in mediating neural cell-type specification. Curr Opin Neurobiol. 2010;20(1):29–36. doi: 10.1016/j.conb.2010.01.003. [DOI] [PMC free article] [PubMed] [Google Scholar]
- 7.Chuang DM, Leng Y, Marinova Z, Kim HJ, Chiu CT. Multiple roles of HDAC inhibition in neurodegenerative conditions. Trends Neurosci. 2009;32(11):591–601. doi: 10.1016/j.tins.2009.06.002. [DOI] [PMC free article] [PubMed] [Google Scholar]
- 8.Langley B, Brochier C, Rivieccio MA. Targeting histone deacetylases as a multifaceted approach to treat the diverse outcomes of stroke. Stroke. 2009;40(8):2899–2905. doi: 10.1161/STROKEAHA.108.540229. [DOI] [PubMed] [Google Scholar]
- 9.Gibson CL, Murphy SP. Benefits of histone deacetylase inhibitors for acute brain injury: a systematic review of animal studies. J Neurochem. 2010;115(4):806–813. doi: 10.1111/j.1471-4159.2010.06993.x. [DOI] [PMC free article] [PubMed] [Google Scholar]
- 10.Thomas EA. Focal nature of neurological disorders necessitates isotype-selective histone deacetylase (HDAC) inhibitors. Mol Neurobiol. 2009;40(1):33–45. doi: 10.1007/s12035-009-8067-y. [DOI] [PubMed] [Google Scholar]
- 11.Uo T, Veenstra TD, Morrison RS. Histone deacetylase inhibitors prevent p53-dependent and p53-independent Bax-mediated neuronal apoptosis through two distinct mechanisms. J Neurosci. 2009;29(9):2824–2832. doi: 10.1523/JNEUROSCI.6186-08.2009. [DOI] [PMC free article] [PubMed] [Google Scholar]
- 12.Baltan S, Murphy SP, Danilov CA, Bachleda A, Morrison RS. Histone deacetylase inhibitors preserve white matter structure and function during ischemia by conserving ATP and reducing excitotoxicity. J Neurosci. 2011;31(11):3990–3999. doi: 10.1523/JNEUROSCI.5379-10.2011. [DOI] [PMC free article] [PubMed] [Google Scholar]
- 13.Gibson CL, Murphy SP. Progesterone enhances functional recovery after middle cerebral artery occlusion in male mice. J Cereb Blood Flow Metab. 2004;24(7):805–813. doi: 10.1097/01.WCB.0000125365.83980.00. [DOI] [PubMed] [Google Scholar]
- 14.Arvidsson A, Collin T, Kirik D, Kokaia Z, Lindvall O. Neuronal replacement from endogenous precursors in the adult brain after stroke. Nat Med. 2002;8(9):963–970. doi: 10.1038/nm747. [DOI] [PubMed] [Google Scholar]
- 15.Jin K, Minami M, Lan JQ, Mao XO, Batteur S, Simon RP, et al. Neurogenesis in dentate subgranular zone and rostral subventricular zone after focal cerebral ischemia in the rat. Proc Natl Acad Sci U S A. 2001;98(8):4710–4715. doi: 10.1073/pnas.081011098. [DOI] [PMC free article] [PubMed] [Google Scholar]
- 16.Parent JM, Vexler ZS, Gong C, Derugin N, Ferriero DM. Rat forebrain neurogenesis and striatal neuron replacement after focal stroke. Ann Neurol. 2002;52(6):802–813. doi: 10.1002/ana.10393. [DOI] [PubMed] [Google Scholar]
- 17.Zhang R, Zhang Z, Zhang C, Zhang L, Robin A, Wang Y, et al. Stroke transiently increases subventricular zone cell division from asymmetric to symmetric and increases neuronal differentiation in the adult rat. J Neurosci. 2004;24(25):5810–5815. doi: 10.1523/JNEUROSCI.1109-04.2004. [DOI] [PMC free article] [PubMed] [Google Scholar]
- 18.Tursun B, Patel T, Kratsios P, Hobert O. Direct conversion of C elegans germ cells into specific neuron types. Science. 2011;331(6015):304–308. doi: 10.1126/science.1199082. [DOI] [PMC free article] [PubMed] [Google Scholar]
- 19.Ma C, D'Mello SR. Neuroprotection by histone deacetylase-7 (HDAC7) occurs by inhibition of c-jun expression through a deacetylase-independent mechanism. J Biol Chem. 2011;286(6):4819–4828. doi: 10.1074/jbc.M110.146860. [DOI] [PMC free article] [PubMed] [Google Scholar]
- 20.Chen S, Owens GC, Makarenkova H, Edelman DB. HDAC6 regulates mitochondrial transport in hippocampal neurons. PLoS One. 2010;5(5):e10848. doi: 10.1371/journal.pone.0010848. [DOI] [PMC free article] [PubMed] [Google Scholar]
- 21.McQuown SC, Barrett RM, Matheos DP, Post RJ, Rogge GA, Alenghat T, et al. HDAC3 is a critical negative regulator of long-term memory formation. J Neurosci. 2011;31(2):764–774. doi: 10.1523/JNEUROSCI.5052-10.2011. [DOI] [PMC free article] [PubMed] [Google Scholar]


