Abstract
Hypoxia and the associated hypoxia-inducible factors (HIFs) may be influential in the progression of diabetic retinopathy. However, little is known of the extent of hypoxia and the levels of HIFs early in the progression of the disease. In the current study, we injected the oxygen-dependent probe pimonidazole (Hypoxyprobe™-1) into diabetic rats, and also performed immunohistochemistry to determine the retinal levels of HIF-1α and HIF-2α. The rats were made diabetic using a single injection of streptozotocin (STZ; 60 mg/kg), with vehicle-injected rats used as non-diabetic controls. The measurements of hypoxia and HIF levels were obtained three weeks following STZ injection, at which time we have previously found significant decreases in retinal blood flow in the same model. In the current experiments, no increases in either HIF-1α or hypoxia were observed in the diabetic rats (compared with controls), and there was even a tendency for hypoxia levels to be decreased (tissue more highly oxygenated). However, we did observe an increase in HIF-2α in the retinas of the diabetic rats. Therefore, we conclude that early diabetes-induced increases in HIF-2α occur independently of hypoxia.
Keywords: hypoxia-inducible factor, HIF-1α, HIF-2α, streptozotocin, diabetes, retina, hypoxia
1. INTRODUCTION
Early stages of diabetic retinopathy are characterized by retinal vascular abnormalities such as microaneurysms, intraretinal hemorrhages, and cotton-wool spots, while later stages of the disease are characterized by retinal neovascularization and the threat of blindness (Yam and Kwok 2007). Although the mechanisms of diabetic retinopathy have not been completely elucidated, retinal hypoxia is often implicated as a central player. Caused by hypoperfusion, leukostasis, and/or capillary dropout, hypoxia in turn may lead to hyperpermeability, neovascularization, and hyperperfusion (Curtis et al., 2009).
Hypoxia initiates the stabilization of hypoxia inducible factors (HIFs), including HIF-1α and HIF-2α (Arjamaa and Nikinmaa 2006; Holmquist-Mengelbier et al., 2006), which are constitutively expressed and regulated in an oxygen-dependent manner (Lisy and Peet 2008). However, HIF-1α can also be stabilized by stimuli other than hypoxia (Bell et al., 2007). Interestingly, HIF-1α and -2α appear to be activated in different cell populations in the ischemic retina (Mowat et al., 2010).
Upon stabilization, HIF-1α and -2α are transported into the nucleus where they become transcription factors for a variety of downstream targets. One downstream target of HIF-1α is the angiogenic factor vascular endothelial growth factor (VEGF) (Arjamaa and Nikinmaa 2006), which is a target for potential therapy in diabetic retinopathy (Waisbourd et al., ). Downstream targets of HIF-2α are oxidative stress-related genes including catalase-encoding Cas1, superoxide dismutase-encoding SOD1, and erythropoietin-encoding EPO (Warnecke et al., 2004; Ding et al., 2005). In the diabetic retina, the activities of catalase and SOD have been shown to be altered (Obrosova et al., 2006), and EPO appears to play a neural protective role (Zhu et al., 2008).
Evidence for retinal hypoxia has been obtained from diabetic retinopathy patients, with vitreous oxygen tensions of 5.7 mmHg compared with 8.5 mmHg in non-diabetics (Holekamp et al., 2006). In cats that were diabetic for 6–8 years, oxygen microelectrodes placed in the inner retina gave measurements of 7.7 mmHg compared with 16.4 mmHg in controls (Linsenmeier et al., 1998). At a much shorter period of diabetes, mild retinal hypoxia was reported for mice following 5 months of diabetes (de Gooyer et al., 2006), although at a period of 3 months diabetes, we found less hypoxia than in controls, for both mice and rats (Wright et al., 2010).
The explanation for our unexpected finding of less hypoxia at 3 months diabetes can only be speculative inasmuch as we have not measured the change in retinal blood flow at that time point. However, in multiple investigations we have found significant (20–45%) reductions in retinal blood flow at approximately 3–5 weeks of diabetes in rats and mice (Lee and Harris 2008; Lee et al., 2008; Wright and Harris 2008; Wright et al., 2009), and therefore the purpose of the current study was to examine the extent of hypoxia and the potential upregulation of HIFs at this early time point when we know that flow is reduced.
2. METHODS
2.1 Animals
Male Wistar rats (Harlan Laboratories) weighing 137 to 158 grams were assigned to i.p. injection of streptozotocin (STZ; 60 mg/kg dissolved in pH 4.5 sodium citrate buffer) or sodium citrate buffer alone. STZ was injected into the animals within 15 min of preparation. The rats received standard chow and water and were housed 1 per cage for 3 weeks following injection. On the day of the experiment, non-fasting blood glucose levels were checked via a tail vein puncture using a One Touch Ultra Glucometer (Milpitas, CA); no insulin was given during the 3-week protocol. The animals were treated in accordance with the ARVO Statement for the Use of Animals in Ophthalmic and Vision Research.
2.2 Measurement of Retinal Hypoxia
Retinal tissue hypoxia was measured using the Hypoxyprobe-1 Omni Kit (Natural Pharmacia International Inc., Burlington, MA), which contains pimonidazole hydrochloride (HCl) and rabbit anti-pimonidazole antisera (primary antibody for immunofluorescent labeling). Pimonidazole remains in hypoxic cells after forming an irreversible adduct with thiol groups in environments with pO2 < 10 mmHg (Raleigh and Koch, C. J., 1990). Using the rabbit anti-pimonidazole antisera, immunofluorescent labeling of retinal cross-sections for localization of hypoxia was performed.
2.3 Tissue Preparation for Immunofluorescence Labeling
Three weeks following STZ injection, the rats were injected i.p. with pimonidazole HCl at a dose of 60 mg/kg. Three hours following pimonidazole HCl injection, rats were anaesthetized with Inactin, and eyes were enucleated and placed in phosphate buffered 4% paraformaldehyde (FD Neurotechnologies, Inc., Baltimore, MD) for 3 hours. The eye was cut at the ora serrata, and the lens and anterior portion of the eye were removed. The eyecup (retina, choroid, and sclera) was placed in 20–25% sucrose solution at 4° C overnight for cryoprotection (Chen and Nathans, J., 2007; Nishiguchi et al., 2008), then placed in optimal cutting temperature (O.C.T.) compound and cut at 10 µm thickness and stored at −80°C until labeled.
2.4 Immunofluorescence Labeling
Slides were washed twice for 5 min in Triton X-100 with gentle agitation. The slides then were incubated in goat serum for 1.5 hours, followed by incubation with primary antibody mixed in PBS + 1% bovine serum albumin (BSA) overnight at 4° C. Negative controls slides were similarly incubated, but without addition of the primary antibody. Next, the slides were washed twice with Triton X-100 for 5 min with gentle agitation, followed by incubation with secondary antibody mixed in PBS + 1% BSA for 1 hr in the dark. Finally, the slides were washed twice in PBS for 10 min and mounted with Vectashield Hardset mounting medium with DAPI (Vector Laboratories, Inc., Burlingam, CA).
Primary antibodies used were rabbit polyclonal HIF-1α (Lifespan Biosciences, Seattle, WA) at a 1:100 dilution, rabbit polyclonal HIF-2α (Abcam, Cambridge, MA) at a 1:100 dilution, rabbit polyclonal anti-pimonidazole (NPi Inc, Burlington, MA) at a 1:1000 dilution, and a rabbit polyclonal IgG (Abcam, Cambridge, MA) used for an isotype control. The secondary antibody was an FITC goat anti-rabbit IgG-Fc fragment (Jackson Immuno Research Labs, West Grove, PA) at a 1:250 dilution for HIF-1α, a 1:100 dilution for HIF-2α, and a 1:200 dilution for anti-pimonidazole.
2.5 Immunofluorescence Image Analysis
A CoolSNAP ES camera (Photometrics, Tucson, AZ) was attached to a Nikon Eclipse E600FN microscope using an X-Cite 120 Fluorescence illumination system. A 10x objective and a Nikon FITC filter was used for image acquisition using an exposure time of 500 ms. Light intensity measurements were obtained using a radiometer photometer (model ILT 1400-A; International Light Technologies; Peabody, MA) before and after images were obtained from each slide, and then averaged. NIS Elements Basic Research software version 3.0 (Nikon Instruments Inc., Melville, NY) was used for capturing and analyzing the images.
Images obtained from both the central and peripheral retina were analyzed by individual layers (ganglion cell layer, GCL; inner plexiform layer, IPL; inner nuclear layer, INL; outer plexiform layer, OPL; outer nuclear layer, ONL; and photoreceptor layer, PR). In the DAPI counterstained image, a region of interest was drawn around the area to be analyzed, with the identical region of interest used for the matching FITC-conjugated stained image, with a background region of interest collected for subtraction. Following background subtraction from both the sample and isotype control, isotype fluorescence was subtracted from the sample fluorescence, and normalized to the microscope light intensity.
2.6 Statistics
Data are expressed as means ± standard error of the mean. Statistical t-tests and linear regression analyses were performed with GraphPad Instat version 3.05 software (San Diego, CA), using a criterion of p<0.05 as statistically significant.
3. RESULTS
At the beginning of the protocol, the two groups of rats (N=10 control; N=8 STZ) both averaged 146 ± 2 g. However, the STZ rats gained weight more slowly than the controls, with the means significantly different (p<0.001) at the end of the 3-week protocol (control: 300 ± 6 g; STZ: 241 ± 3 g). Non-fasting glucose levels averaged 116 ± 3 mg/dl in controls, and above 400 mg/dl in the STZ rats, with the values exceeding the glucose meter maximum (of 600 mg/dl) in one-half of the group. One rat injected with STZ did not become diabetic and was not included in the experimental group.
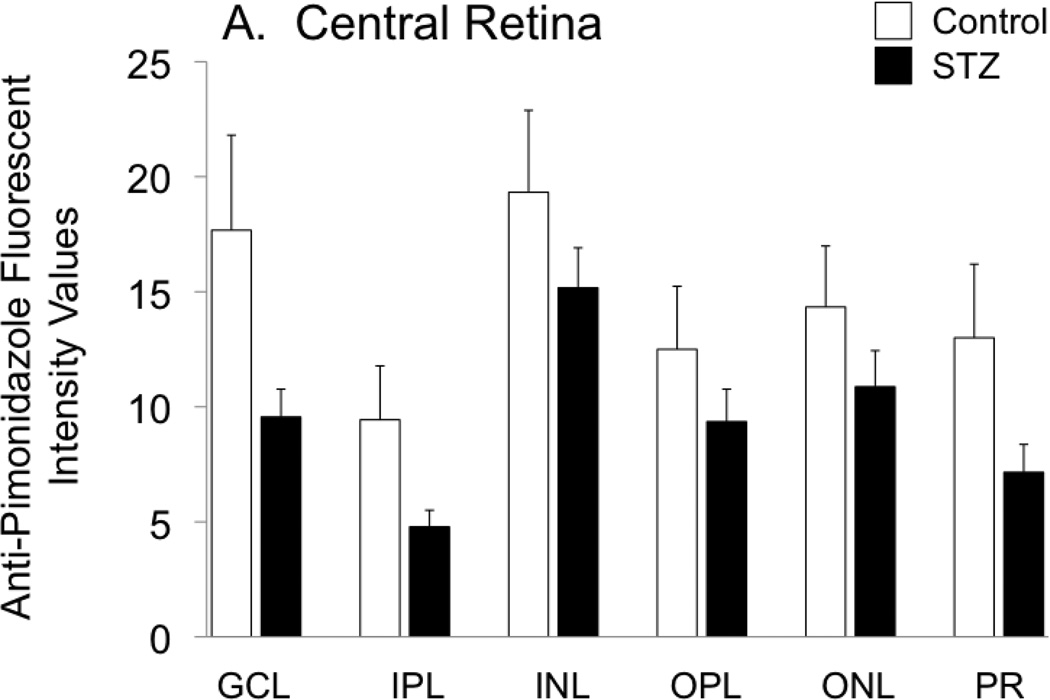
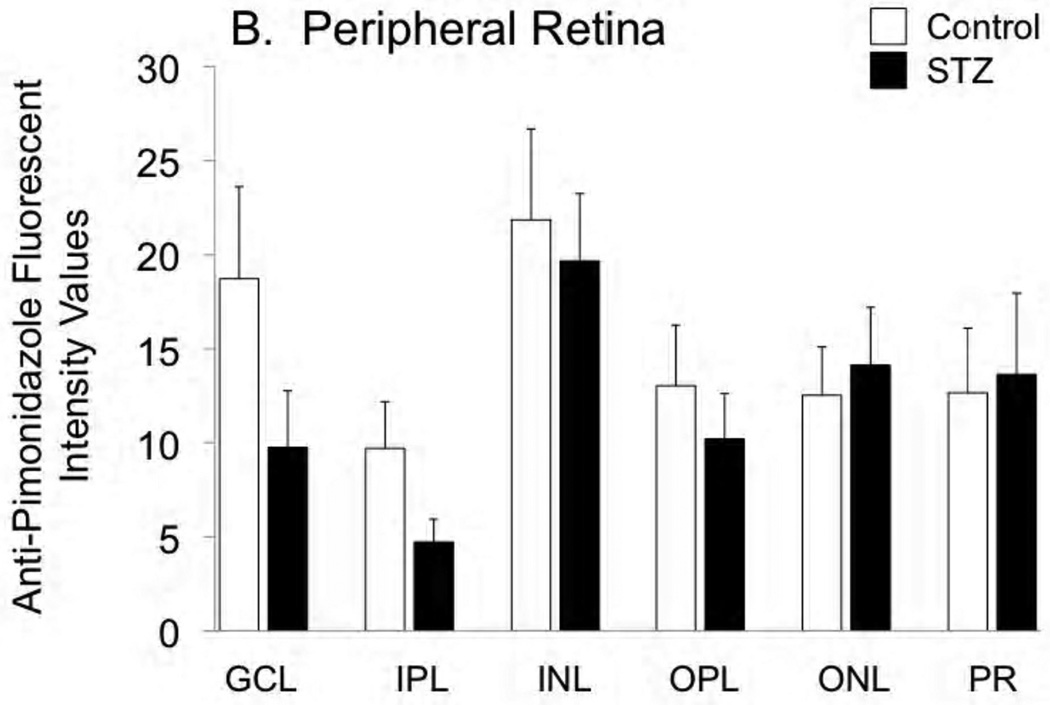
Hypoxyprobe (pimonidazole) was injected into the rats of both groups, for a measurement of the extent of retinal hypoxia. As shown in Figure 1A, hypoxia tended to be less pronounced in all layers of the central retina of the STZ group compared with controls, although the differences did not reach statistical significance. In the peripheral retina (Fig 1B), this tendency (toward an STZ-induced decrease in hypoxia) was limited to the ganglion cell and inner plexiform layers.
Figure 1.
Fluorescent staining intensities for Hypoxyprobe (anti-pimonidazole antibody) in the central retina (A) and peripheral retina (B) of control and STZ diabetic rats. Layers are abbreviated GCL (ganglion cell layer), IPL (inner plexiform layer), INL (inner nuclear layer), OPL (outer plexiform layer), ONL (outer nuclear layer), and PR (photoreceptor layer).
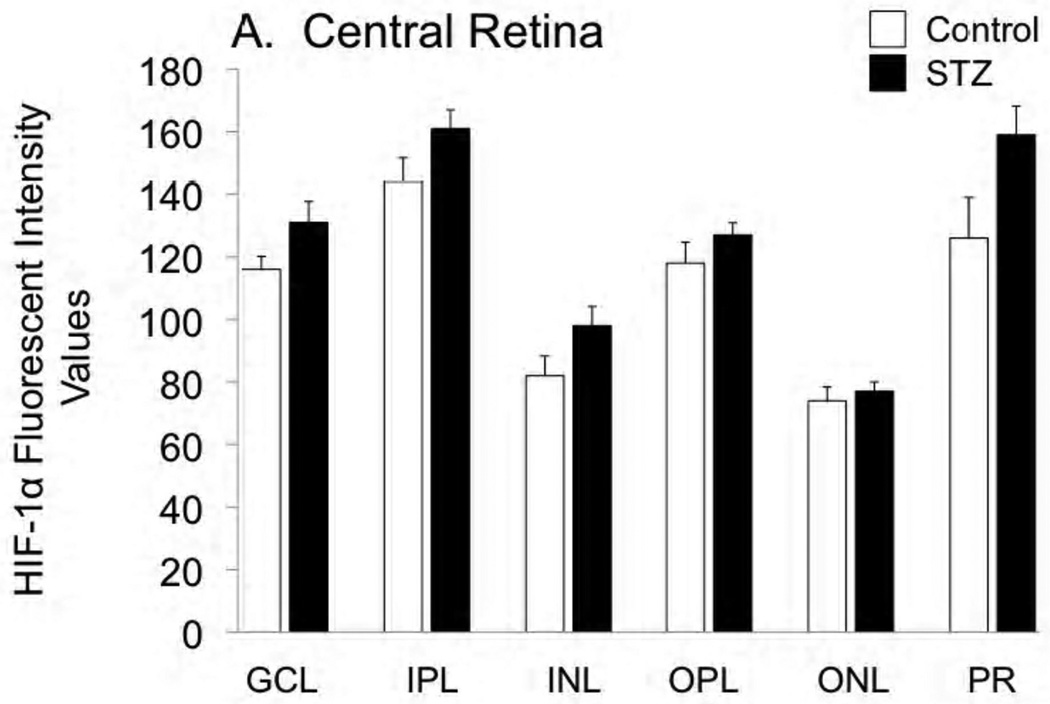
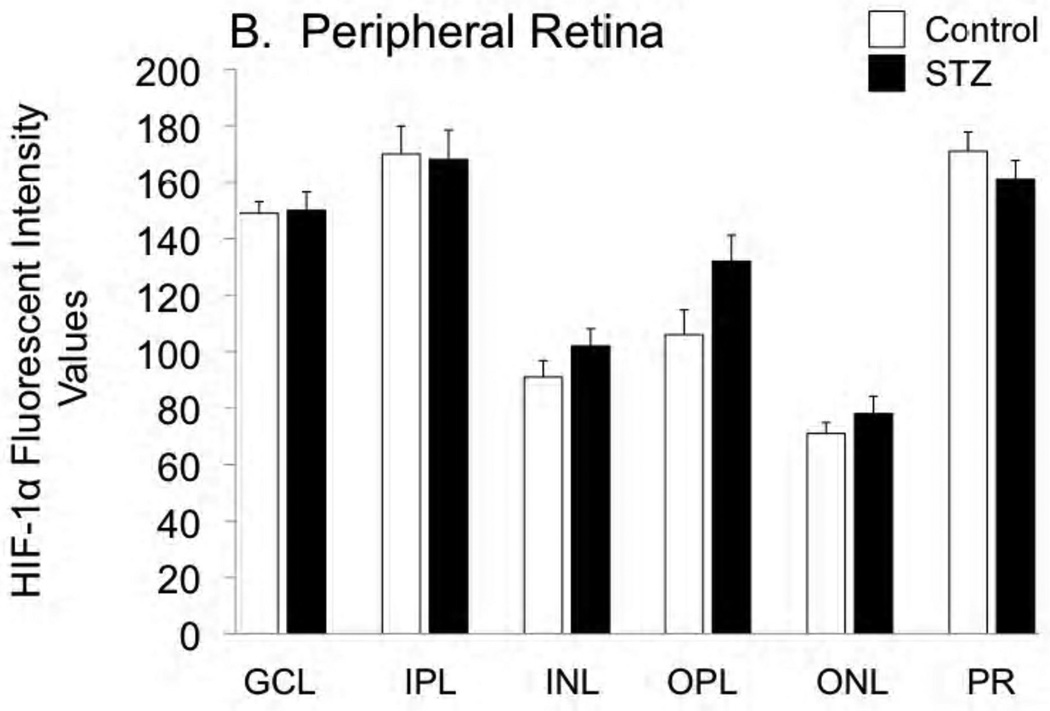
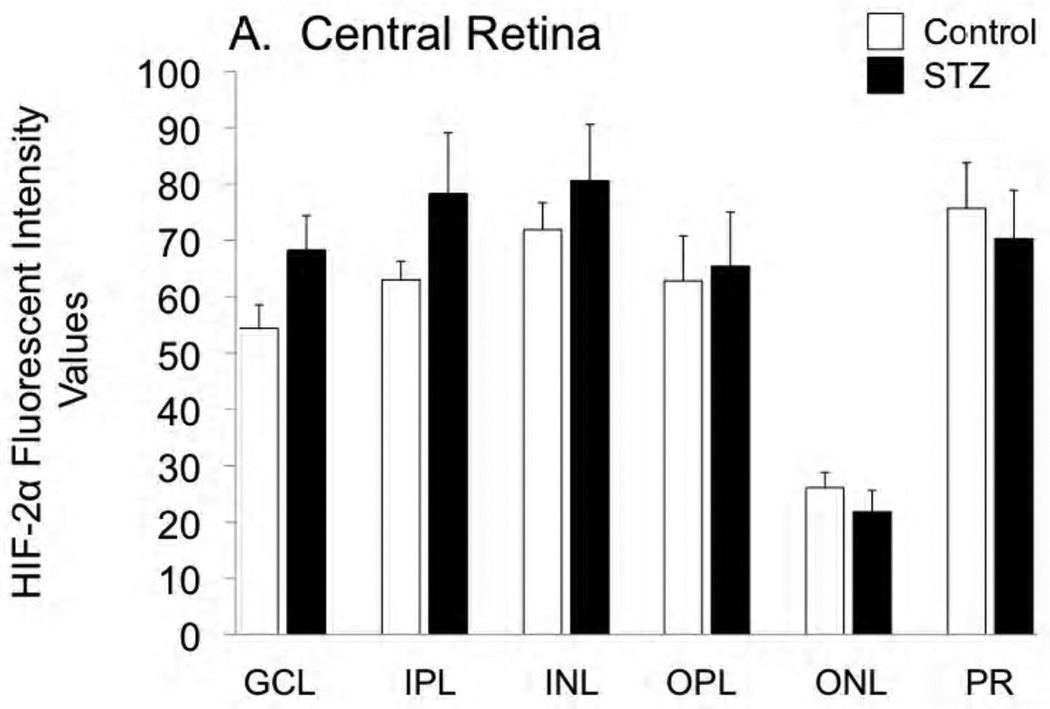
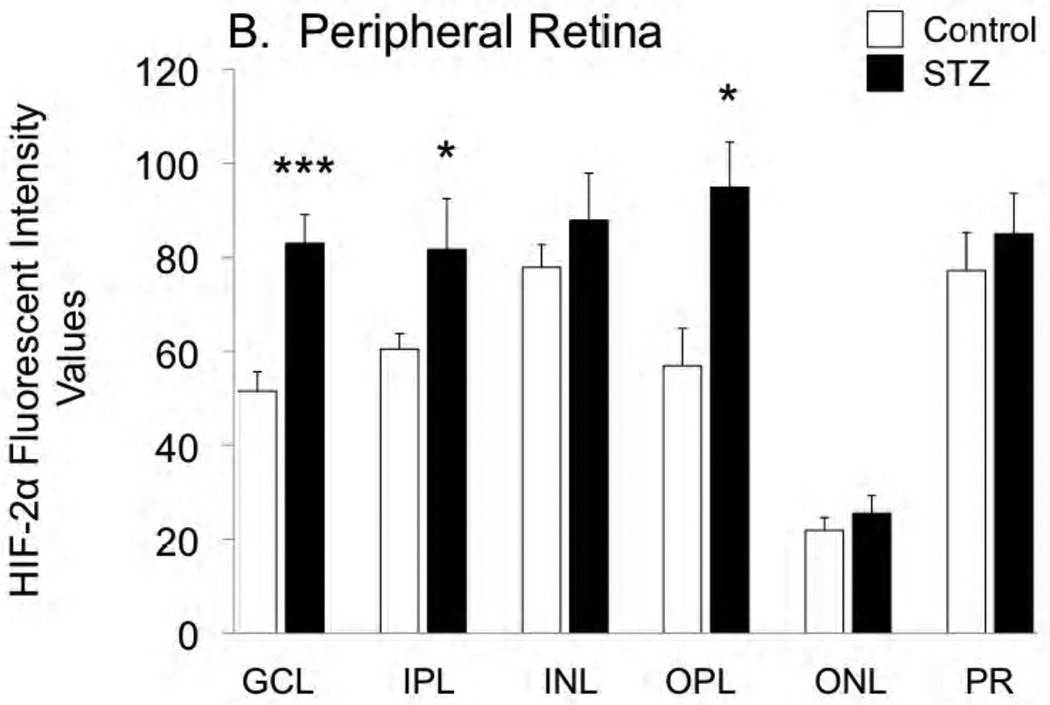
Cross-sections of the enucleated eyes were stained for both HIF-1α and HIF-2α, as shown in Figures 2 and 3, respectively. Staining for HIF-1α was very similar between control and STZ groups, while there was a tendency for HIF-2α to increase with diabetes, with this tendency reaching statistical significance in the ganglion cell, inner plexiform, and outer plexiform layers of the peripheral retina.
Figure 2.
Fluorescent immunostaining for HIF-1α in the central retina (A) and peripheral retina (B) of control and STZ diabetic rats. Layers are abbreviated GCL (ganglion cell layer), IPL (inner plexiform layer), INL (inner nuclear layer), OPL (outer plexiform layer), ONL (outer nuclear layer), and PR (photoreceptor layer).
Figure 3.
Fluorescent immunostaining for HIF-2α in the central retina (A) and peripheral retina (B) of control and STZ diabetic rats. Layers are abbreviated GCL (ganglion cell layer), IPL (inner plexiform layer), INL (inner nuclear layer), OPL (outer plexiform layer), ONL (outer nuclear layer), and PR (photoreceptor layer). *p<0.05 and ***p<0.001 vs controls.
Figure 4 provides sample images of the immunostaining for HIF-1α, HIF-2α, and Hypoxyprobe, with the upper row of images from a control rat, and the lower row from an STZ rat. These examples are reflective of the data in Figures 1–3, with the HIF-2α staining in the STZ rat greater than in the control, despite a decrease in hypoxia (Hypoxyprobe).
Figure 4.
Example images of HIF-1α, HIF-2α, and Hypoxyprobe staining in the central retinas of one control and one STZ rat. In each frame, the ganglion cell layer is at the bottom, and the photoreceptor layer is toward the top.
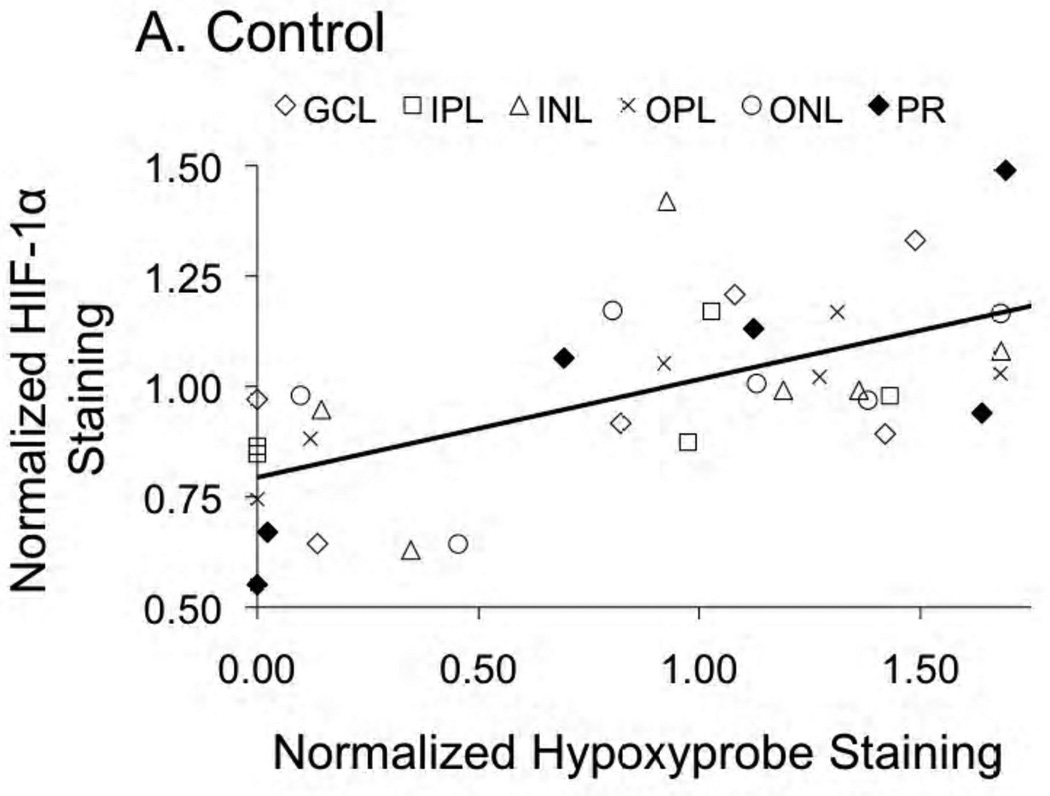
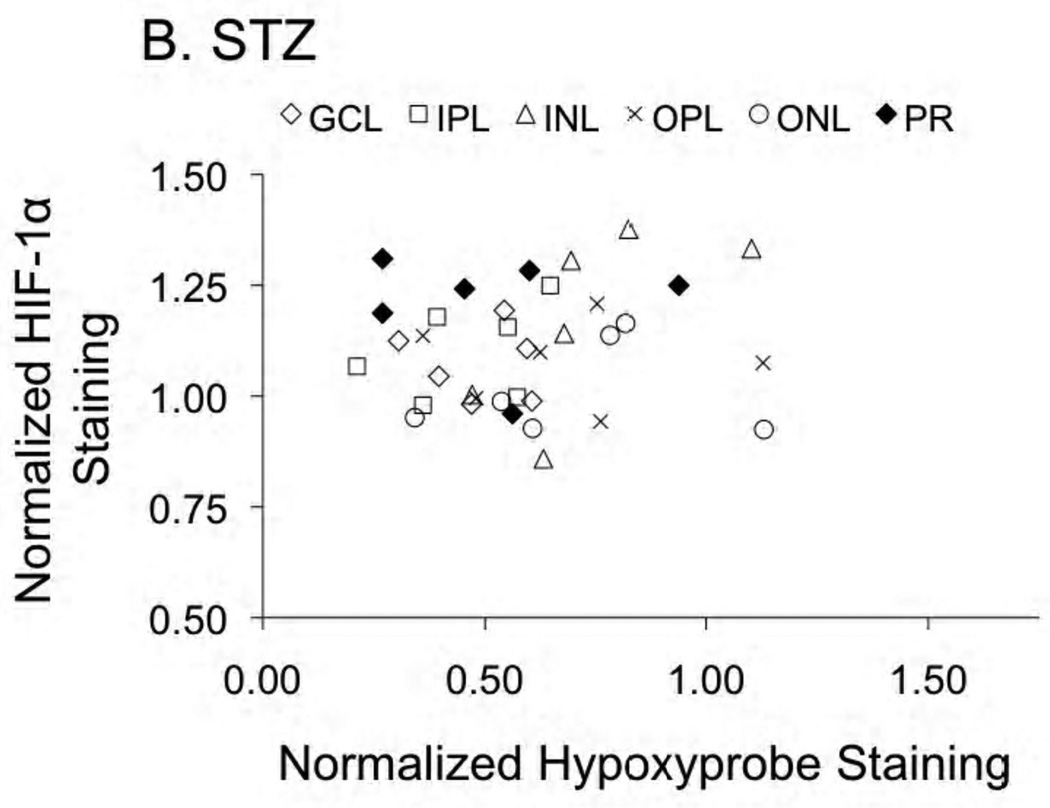
In general, there was little correlation between HIF expression and Hypoxyprobe staining, with the one exception being HIF-1α in the central retina of control rats. As shown in Figure 5A, in control rats having Hypoxyprobe staining of less than one-half of the normalized average (i.e., <0.5 on the x-axis), HIF-1α expression was uniformly below average (< 1.0 on the y-axis). In contrast, HIF-1α expression was generally higher than average in layers of increased hypoxia. This correlation was found only for HIF-1α in the central retina of controls (r2=0.41; p<0.0001): as shown in Figure 5B, no relationship between these two parameters was found in STZ rats. Additionally, no correlations were found between HIF-2α and Hypoxyprobe in either control or STZ rats.
Figure 5.
HIF-1α and Hypoxyprobe staining presented as normalized to the control average. Panel A provides the relationship (r2=0.41; p<0.0001) in control rats; no relationship between the two parameters was found in the STZ rats (panel B). Data are provided for the ganglion cell layer (GCL), inner plexiform layer (IPL), inner nuclear layer (INL), outer plexiform layer (OPL), outer nuclear layer (ONL), and photoreceptor layer (PR).
4. DISCUSSION
In this study, we found that STZ-induced diabetes in the rat increases HIF-2α in the retina, and to our knowledge, this is the first demonstration of this finding. We found the greatest increase in HIF-2α in the peripheral inner retina. Although increases in HIF-2α can occur due to hypoxia, we observed a tendency for the reverse, that is, less hypoxia in the diabetic rat retina. Moreover, we found no increase in HIF-1α in either the central or peripheral retina of the diabetic rats. Taken together, our results suggest a potential hypoxia-independent increase in HIF-2α early in the diabetic retina.
The tendency for less hypoxia in the diabetic retina may differ from expectations, although we have previously reported statistically significant decreases in hypoxia in the STZ-injected rat following a more lengthy 12-week period of hyperglycemia (Wright et al., 2010). However, inasmuch as we do not have measurements of retinal blood flow at 12 weeks STZ, it is difficult to know how the increase in oxygenation corresponds with any potential changes in perfusion. In the current study, we measured hypoxia and HIFs at a time point (3 weeks) where we have observed a diabetes-induced constriction of retinal arterioles and a significant reduction in retinal blood flow in the rat (Lee et al., 2008). Interestingly, despite a decrease in flow at this time point, we also found a trend toward a decrease in hypoxia in the current study. The extent of “hyperoxygenation” is similar to the level that we observed at 12 weeks of STZ (Wright et al., 2010), which is supported by the oxygen microelectrode results presented by another group (Lau and Linsenmeier 2010).
The amount of pimonidazole binding can potentially be influenced by factors other than hypoxia alone, with factors such as pH, sulfhydryl concentrations, and nitroreductase concentrations having been given previous consideration (Kleiter et al., 2006). However, we are unaware that any of these factors would be altered between our control and diabetic groups to the extent that would influence our interpretations. With respect to one of these factors, pimonidazole binding in anoxic V79 cells is reduced when pH is substantially lowered by a full pH unit, to a value of 6.4 rather than 7.4 (Kleiter et al., 2006). To our knowledge there are no reports of intraretinal pH measurements in hyperglycemic vs normoglycemic rats in the initial few weeks of chemically induced hyperglycemia. However, intraretinal pH has been measured in diabetic cats, with the inner retina tending to be 0.07–0.08 pH units more acidic than in normoglycemic cats (Budzynski et al., 2005). Therefore, unless the change toward acidity is much more substantial in our rat model, we predict that pH probably has little influence on our hypoxia assay. Finally, our pimonidazole data suggesting a decrease in retinal oxygenation in early diabetes has been corroborated for the time point of 12 weeks STZ by pO2 microelectrode measurements (Lau and Linsenmeier 2010), in a protocol that would be insensitive to the factors listed above.
When speculating the cause and effect between vasoconstriction and changes in oxygenation, it could have been predicted that the early diabetes-induced decreases in retinal blood flow would lead to hypoxia. However, data from our lab seem to suggest that hyperoxygenation, instead, may lead to vasoconstriction and a decrease in retinal blood flow. Certainly, there is ample evidence that increases in oxygenation induce vasoconstriction. In addition, the scenario of elevated oxygenation, and/or decreased oxygen consumption in the diabetic retina, has been postulated previously to produce a decrease in retinal blood flow (Small et al., 1987; Rimmer and Linsenmeier 1993).
The hypoxia-independent increase in HIF-2α may need further investigation. Elevated levels of reactive oxygen species (ROS) could be hypothesized to stabilize HIF-2α independent of hypoxia, as occurs for HIF-1α (Bell et al., 2007). However, if this is the case, the potential ROS-induced increase in HIFs may be transient, since increases in ROS in the diabetic retina continue through 6 weeks to 6 months (Kowluru et al., 2006; Obrosova et al., 2006; Kanwar et al., 2007; Zheng et al., 2007; Gubitosi-Klug et al., 2008), whereas the increase in HIFs may or may not be sustained over that period. HIF-1α has been reported to increase in rats 2 weeks following STZ injection (Poulaki et al., 2004) but not after 3 weeks (current study), or at 4 or 12 weeks STZ (Wright et al., 2010). HIF-2α might follow a similar but slightly different pattern compared to HIF-1α, with increases following 3 weeks of STZ (current study) but not after 4 or 12 weeks STZ (Wright et al., 2010).
In conclusion, we find an early increase in HIF-2α in the diabetic rat retina at a time when we observe no increase in either hypoxia or HIF-1α. The stimulus for the increase in HIF-2α, and the possible signaling consequences of the increase, have yet to be determined.
The study investigated retinal hypoxia and HIFs at 3 weeks STZ-induced diabetes in rats.
No increases in hypoxia or HIF-1α were observed in the diabetic retina at this time point.
HIF-2α was increased in the diabetic retina, with the levels independent of hypoxia.
ACKNOWLEDGMENTS
This study was funded by NIH EY017599 (NRH).
Footnotes
Publisher's Disclaimer: This is a PDF file of an unedited manuscript that has been accepted for publication. As a service to our customers we are providing this early version of the manuscript. The manuscript will undergo copyediting, typesetting, and review of the resulting proof before it is published in its final citable form. Please note that during the production process errors may be discovered which could affect the content, and all legal disclaimers that apply to the journal pertain.
References
- Arjamaa O, Nikinmaa M. Oxygen-dependent diseases in the retina: role of hypoxia-inducible factors. Exp Eye Res. 2006;83:473–483. doi: 10.1016/j.exer.2006.01.016. [DOI] [PubMed] [Google Scholar]
- Bell EL, Klimova TA, Eisenbart J, Moraes CT, Murphy MP, Budinger GR, Chandel NS. The Qo site of the mitochondrial complex III is required for the transduction of hypoxic signaling via reactive oxygen species production. J Cell Biol. 2007;177:1029–1036. doi: 10.1083/jcb.200609074. [DOI] [PMC free article] [PubMed] [Google Scholar]
- Budzynski E, Wangsa-Wirawan N, Padnick-Silver L, Hatchell D, Linsenmeier R. Intraretinal pH in diabetic cats. Curr Eye Res. 2005;30:229–240. doi: 10.1080/02713680590934067. [DOI] [PubMed] [Google Scholar]
- Curtis TM, Gardiner TA, Stitt AW. Microvascular lesions of diabetic retinopathy: clues towards understanding pathogenesis? Eye (Lond) 2009;23:1496–1508. doi: 10.1038/eye.2009.108. [DOI] [PubMed] [Google Scholar]
- de Gooyer TE, Stevenson KA, Humphries P, Simpson DA, Gardiner TA, Stitt AW. Retinopathy is reduced during experimental diabetes in a mouse model of outer retinal degeneration. Invest Ophthalmol Vis Sci. 2006;47:5561–5568. doi: 10.1167/iovs.06-0647. [DOI] [PubMed] [Google Scholar]
- Ding K, Scortegagna M, Seaman R, Birch DG, Garcia JA. Retinal disease in mice lacking hypoxia-inducible transcription factor-2alpha. Invest Ophthalmol Vis Sci. 2005;46:1010–1016. doi: 10.1167/iovs.04-0788. [DOI] [PubMed] [Google Scholar]
- Gubitosi-Klug RA, Talahalli R, Du Y, Nadler JL, Kern TS. 5-Lipoxygenase, but not 12/15-lipoxygenase, contributes to degeneration of retinal capillaries in a mouse model of diabetic retinopathy. Diabetes. 2008;57:1387–1393. doi: 10.2337/db07-1217. [DOI] [PMC free article] [PubMed] [Google Scholar]
- Holekamp NM, Shui YB, Beebe D. Lower intraocular oxygen tension in diabetic patients: possible contribution to decreased incidence of nuclear sclerotic cataract. Am J Ophthalmol. 2006;141:1027–1032. doi: 10.1016/j.ajo.2006.01.016. [DOI] [PubMed] [Google Scholar]
- Holmquist-Mengelbier L, Fredlund E, Lofstedt T, Noguera R, Navarro S, Nilsson H, Pietras A, Vallon-Christersson J, Borg A, Gradin K, Poellinger L, Pahlman S. Recruitment of HIF-1alpha and HIF-2alpha to common target genes is differentially regulated in neuroblastoma: HIF-2alpha promotes an aggressive phenotype. Cancer Cell. 2006;10:413–423. doi: 10.1016/j.ccr.2006.08.026. [DOI] [PubMed] [Google Scholar]
- Kanwar M, Chan PS, Kern TS, Kowluru RA. Oxidative damage in the retinal mitochondria of diabetic mice: possible protection by superoxide dismutase. Invest Ophthalmol Vis Sci. 2007;48:3805–3811. doi: 10.1167/iovs.06-1280. [DOI] [PubMed] [Google Scholar]
- Kleiter MM, Thrall DE, Malarkey DE, Ji X, Lee DY, Chou SC, Raleigh JA. A comparison of oral and intravenous pimonidazole in canine tumors using intravenous CCI-103F as a control hypoxia marker. Int J Radiat Oncol Biol Phys. 2006;64:592–602. doi: 10.1016/j.ijrobp.2005.09.010. [DOI] [PubMed] [Google Scholar]
- Kowluru RA, Kowluru V, Xiong Y, Ho YS. Overexpression of mitochondrial superoxide dismutase in mice protects the retina from diabetes-induced oxidative stress. Free Radic Biol Med. 2006;41:1191–1196. doi: 10.1016/j.freeradbiomed.2006.01.012. [DOI] [PubMed] [Google Scholar]
- Lau JC, Linsenmeier RA. Oxygen Consumption and Distribution in the Diabetic Rat Retina. Invest. Ophthalmol. Vis. Sci. 2010;51 E-abstract 5644. [Google Scholar]
- Lee S, Harris NR. Losartan and ozagrel reverse retinal arteriolar constriction in non-obese diabetic mice. Microcirculation. 2008;15:379–387. doi: 10.1080/10739680701829802. [DOI] [PMC free article] [PubMed] [Google Scholar]
- Lee S, Morgan GA, Harris NR. Ozagrel reverses streptozotocin-induced constriction of arterioles in rat retina. Microvasc Res. 2008;76:217–223. doi: 10.1016/j.mvr.2008.07.005. [DOI] [PMC free article] [PubMed] [Google Scholar]
- Linsenmeier RA, Braun RD, McRipley MA, Padnick LB, Ahmed J, Hatchell DL, McLeod DS, Lutty GA. Retinal hypoxia in long-term diabetic cats. Invest Ophthalmol Vis Sci. 1998;39:1647–1657. [PubMed] [Google Scholar]
- Lisy K, Peet DJ. Turn me on: regulating HIF transcriptional activity. Cell Death Differ. 2008;15:642–649. doi: 10.1038/sj.cdd.4402315. [DOI] [PubMed] [Google Scholar]
- Mowat FM, Luhmann UF, Smith AJ, Lange C, Duran Y, Harten S, Shukla D, Maxwell PH, Ali RR, Bainbridge JW. HIF-1alpha and HIF-2alpha are differentially activated in distinct cell populations in retinal ischaemia. PLoS One. 2010;5:e11103. doi: 10.1371/journal.pone.0011103. [DOI] [PMC free article] [PubMed] [Google Scholar]
- Obrosova IG, Drel VR, Kumagai AK, Szabo C, Pacher P, Stevens MJ. Early diabetes-induced biochemical changes in the retina: comparison of rat and mouse models. Diabetologia. 2006;49:2525–2533. doi: 10.1007/s00125-006-0356-7. [DOI] [PMC free article] [PubMed] [Google Scholar]
- Poulaki V, Joussen AM, Mitsiades N, Mitsiades CS, Iliaki EF, Adamis AP. Insulin-like growth factor-I plays a pathogenetic role in diabetic retinopathy. Am J Pathol. 2004;165:457–469. doi: 10.1016/S0002-9440(10)63311-1. [DOI] [PMC free article] [PubMed] [Google Scholar]
- Rimmer T, Linsenmeier RA. Resistance of diabetic rat electroretinogram to hypoxemia. Invest Ophthalmol Vis Sci. 1993;34:3246–3252. [PubMed] [Google Scholar]
- Small KW, Stefansson E, Hatchell DL. Retinal blood flow in normal and diabetic dogs. Invest Ophthalmol Vis Sci. 1987;28:672–675. [PubMed] [Google Scholar]
- Waisbourd M, Goldstein M, Loewenstein A. Treatment of diabetic retinopathy with anti-VEGF drugs. Acta Ophthalmol. doi: 10.1111/j.1755-3768.2010.02010.x. [DOI] [PubMed] [Google Scholar]
- Warnecke C, Zaborowska Z, Kurreck J, Erdmann VA, Frei U, Wiesener M, Eckardt KU. Differentiating the functional role of hypoxia-inducible factor (HIF)-1alpha and HIF-2alpha (EPAS-1) by the use of RNA interference: erythropoietin is a HIF-2alpha target gene in Hep3B and Kelly cells. FASEB J. 2004;18:1462–1464. doi: 10.1096/fj.04-1640fje. [DOI] [PubMed] [Google Scholar]
- Wright WS, Harris NR. Ozagrel attenuates early streptozotocin-induced constriction of arterioles in the mouse retina. Exp Eye Res. 2008;86:528–536. doi: 10.1016/j.exer.2007.12.012. [DOI] [PMC free article] [PubMed] [Google Scholar]
- Wright WS, McElhatten RM, Messina JE, Harris NR. Hypoxia and the expression of HIF-1alpha and HIF-2alpha in the retina of streptozotocin-injected mice and rats. Exp Eye Res. 2010;90:405–412. doi: 10.1016/j.exer.2009.12.002. [DOI] [PMC free article] [PubMed] [Google Scholar]
- Wright WS, Messina JE, Harris NR. Attenuation of diabetes-induced retinal vasoconstriction by a thromboxane receptor antagonist. Exp Eye Res. 2009;88:106–112. doi: 10.1016/j.exer.2008.10.008. [DOI] [PMC free article] [PubMed] [Google Scholar]
- Yam JC, Kwok AK. Update on the treatment of diabetic retinopathy. Hong Kong Med J. 2007;13:46–60. [PubMed] [Google Scholar]
- Zheng L, Du Y, Miller C, Gubitosi-Klug RA, Ball S, Berkowitz BA, Kern TS. Critical role of inducible nitric oxide synthase in degeneration of retinal capillaries in mice with streptozotocin-induced diabetes. Diabetologia. 2007;50:1987–1996. doi: 10.1007/s00125-007-0734-9. [DOI] [PubMed] [Google Scholar]
- Zhu B, Wang W, Gu Q, Xu X. Erythropoietin protects retinal neurons and glial cells in early-stage streptozotocin-induced diabetic rats. Exp Eye Res. 2008;86:375–382. doi: 10.1016/j.exer.2007.11.010. [DOI] [PubMed] [Google Scholar]


