Abstract
In recent years, oncolytic adenoviruses have shown some promise as a novel class of antitumor agents. However, their utility in targeting bone metastases is relatively less studied. We have examined whether the systemic therapy of oncolytic adenoviruses expressing the soluble form of transforming growth factor-β (TGFβ) receptor II fused with human immunoglobulin G1 can be developed for the treatment of established breast cancer bone metastases. MDA-MB-231-luc2 human breast cancer cells were injected in the left heart ventricle of nude mice to establish bone metastasis. Mice with hind limb tumors were administered (on days 8 and 11) oncolytic adenoviruses-Ad.sTβRFc or mhTERTAd.sTβRFc. Skeletal tumor growth was monitored weekly by bioluminescence imaging (BLI) and radiography. At the termination time on day 28, hind limb bones were analyzed for tumor burden, synchrotron micro-computed tomography, and osteoclast activation. Intravenous delivery of Ad.sTβRFc and mhTERTAd.sTβRFc induced significant inhibition of tumor growth, reduction of tumor burden, osteoclast activation, and increased animals' survival. Oncolytic adenoviruses were safer than dl309, a wild-type virus. A slight elevation of liver enzyme activity was observed after Ad.sTβRFc administration; this subsided with time. Based on these studies, we believe that Ad.sTβRFc and mhTERTAd.sTβRFc can be developed as a safe and effective approach for the treatment of established bone metastasis.
Introduction
In the United States, nearly 207,090 women will be diagnosed with breast cancer resulting in 39,840 deaths in the year 2010.1 In the advanced stage of breast cancer, the majority of patients develop bone metastases which cause severe bone pain, bone fractures, and eventual death.2 Development of novel therapies for the treatment of bone metastases is a major unmet medical need.3 In recent years, oncolytic adenoviruses have shown some promise as important antitumor agents.4,5,6,7,8,9,10 However, their potential in targeting bone metastasis is relatively less studied.7 Considering that tumor microenvironment plays a critical role in the tumor progression at the bone site,11 it would be desirable to develop armed oncolytic adenoviruses that would simultaneously target the tumor cells, and the key players involved in the tumor/bone microenvironment. During the progression of breast cancer, once the tumor cells arrive at the bone site, a “vicious cycle” is initiated between the tumor cells, osteoclast, and the osteoblast cells.12 Transforming growth factor-β (TGFβ) has been shown to a key player involved in the vicious cycle.12,13,14,15,16,17,18,19,20 TGFβ can induce parathyroid hormone related peptide, interleukin-11, and receptor activator of nuclear factor-κB ligand production, thus promoting osteoclastogenesis and osteolytic bone destruction.21,22,23,24,25,26 Bone destruction can in turn release growth factors such as insulin like growth factor-1 from the bone matrix, that could lead to enhanced tumor growth.27 In an effort to target bone metastases, our laboratory has created Ad.sTβRFc, an oncolytic adenovirus expressing soluble TGFβ receptor II fused with human immunoglobulin Fc fragment (sTGFβRIIFc).6 Our hypothesis is that Ad.sTβRFc replication in tumors will induce oncolysis, and the simultaneous production of sTGFβRIIFc will inhibit aberrant TGFβ signaling at the tumor/bone site. Using a MDA-MB-231 breast cancer bone metastasis model, we have previously shown that intravenous injection of Ad.sTβRFc in nude mice, before the appearance of detectable skeletal tumors, prevented the formation of bone metastases.28 In order to create a therapeutic approach, in the present study, we have generated a MDA-MB-231-luc2 cell line which expresses a firefly luciferase2 gene, thus enabling the tumor growth to be monitored in vivo by bioluminescence imaging (BLI). We have examined whether systemic injection of Ad.sTβRFc and mhTERTAd.sTβRFc (an oncolytic adenovirus similar to Ad.sTβRFc, except viral replication is under the control of a modified human TERT promoter),29 can be developed to treat the established skeletal metastases. Following the intracardiac injection of MDA-MB-231-luc2 cells in nude mice, presence of bone metastases in the hind limbs was first confirmed by BLI on day 7, and then the viral vectors were administered intravenously on days 8 and 11. Because the safety of the vectors is an important consideration in developing oncolytic adenoviruses, the vectors-induced liver toxicity was also examined. The results presented here show that Ad.sTβRFc and mhTERTAd.sTβRFc are effective in inhibiting bone metastases; mhTERTAd.sTβRFc induced lower acute toxicity compared to Ad.sTβRFc. Based on these studies, we believe that Ad.sTβRFc and mhTERTAd.sTβRFc have the potential to be developed for the treatment of bone metastases in advanced stage breast cancer patients.
Results
Effect of adenoviral vectors on the skeletal tumor progression: BLI analysis
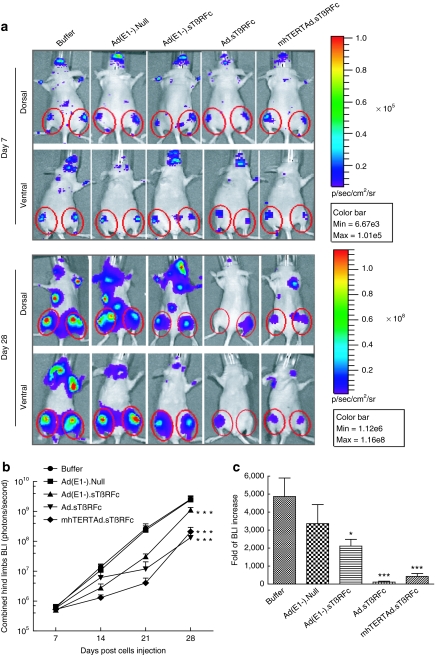
To examine the effect of intravenous delivery of adenoviral vectors on bone metastases, MDA-MB-231-luc2 cells were injected into the left heart ventricle of nude mice to establish bone metastases. Imaging data on day 7 were used to create six experimental groups, each with similar BLI signal in the hind limbs (5.0–6.5 × 10⁵ photons/second). Mice were administered with either buffer or various viral vectors on day 8 and 11 as described in Materials and Methods section. Mice were imaged once a week and signal intensity of combined dorsal and ventral hind limbs was quantified. Figure 1a shows BLI of a representative mouse from each group on day 7 and day 28. In the buffer-treated group, there was a progressive increase in the BLI signal over time (Figure 1a,b). Ad(E1−).Null had no significant effect on the tumor growth (P > 0.05). However, mice that received Ad(E1−).sTβRFc, Ad.sTβRFc, or mhTERTAd.sTβRFc exhibited significant reductions in BLI signal (P < 0.001) over the course of the study (Figure 1b). The increases in BLI from day 7 to 28 showed that the Ad.sTβRFc group had the least fold-increases in the tumor sizes compared to buffer (110.1 ± 54.1, P < 0.001); mhTERTAd.sTβRFc also caused a highly significant effect (427.0 ± 162.3, P < 0.001); Ad(E1−).sTβRFc had some effect (2,111.1 ± 378.3, P < 0.05) whereas Ad(E1−).Null had no significant effect (3,361.6 ± 1,055.7, P > 0.05) compared with the buffer group (4,867.6 ± 1,028.7) (Figure 1c).
Figure 1.
Monitoring bone metastasis progression by bioluminescence imaging. (a) Representative whole-body dorsal and ventral bioluminescence imaging (BLI) images on day 7 and day 28. Regions of interest (ROIs) are pointed out with red circles. Mice with established hind limb tumors were randomized into five groups: buffer (n = 10), Ad(E1−).Null (n = 10), Ad(E1−).sTβRFc (n = 12), Ad.sTβRFc (n = 12), and mhTERTAd.sTβRFc (n = 12). Buffer or adenoviral vectors were injected intravenously as described in Materials and Methods section. (b) Signal intensity of BLI in hind limbs over the course of the study. Whole-body dorsal and ventral BLI images in various treatment groups were obtained on days 7, 14, 21, and 28. Graph shows combined dorsal and ventral signal intensity of BLI in hind limbs on various days. Data are plotted as the mean ± SEM for each group. Buffer (n = 10), Ad(E1−).Null (n = 10), Ad(E1−).sTβRFc (n = 12), Ad.sTβRFc (n = 12), and mhTERTAd.sTβRFc (n = 12). (c) Fold-difference of BLI signal intensity, before and after treatment. P value comparisons with buffer group are shown for b and c (*P < 0.05, ***P < 0.001).
Effect of adenoviral vectors on bone metastases: Radiographic analysis
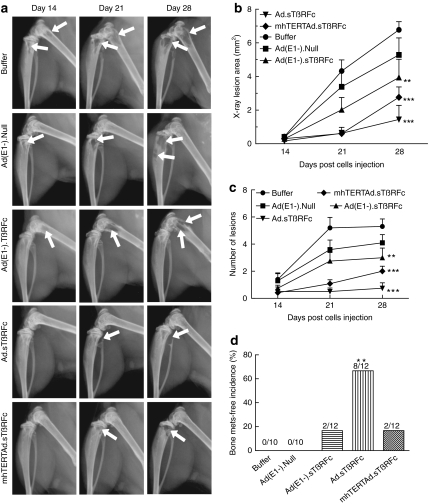
Bone metastases were further examined using radiographic measurements taken on day 14, 21, and 28. Figure 2a shows representative bone from each treatment group indicating tumor progression from day 14 to 28 (osteolytic lesions are indicated by arrows). To quantify tumor size, X-ray lesions were measured from both hind limbs of each mouse. In the buffer-treated group, there was a progressive increase in tumor area (Figure 2b). Ad(E1−).Null had no effect on the tumor progression (P > 0.05). Ad(E1−).sTβRFc had a significant effect on tumor growth (P < 0.01). Highly significant inhibition was observed in the Ad.sTβRFc-treated and mhTERTAd.sTβRFc-treated (P < 0.001) groups. Similar effects of viral treatments were observed on the lesion numbers (Figure 2c). However, in another indicator-bone metastases free incidence-, differences in the efficacy among various treatment groups were detected (Figure 2c). Ad.sTβRFc was the most effective treatment in producing tumor-free mice (8/12 tumor free mice, P < 0.01). In the Ad(E1−).sTβRFc and mhTERTAd.sTβRFc groups, 2/12 mice were tumor free, but the effect was not statistically significant (Figure 2d). However, there were no tumor-free mice in the Ad(E1−).Null or buffer groups.
Figure 2.
Monitoring osteolytic bone metastasis progression by radiography. (a) Representative radiographs of mice on day 14, 21, and 28 from each treatment group. Arrows indicate osteolytic lesions. (b) X-ray osteolytic lesion analysis. Average of lesion area during the course of the experiment. (c) Average of lesion numbers per mouse during the course of the experiment. Numbers in b and c are plotted as the mean ± SEM. (d) Bone metastasis (mets)-free incidence (mice without X-ray positive lesions) on day 28 are shown. Numbers of mice in each group are: buffer (n = 10), Ad(E1−).Null (n = 10), Ad(E1−).sTβRFc (n = 12), Ad.sTβRFc (n = 12), and mhTERTAd.sTβRFc (n = 12). P value comparisons with buffer group are shown for b, c, and d (**P < 0.01, ***P < 0.001).
Effect of adenoviral vectors on tumor burden and osteolytic bone destruction
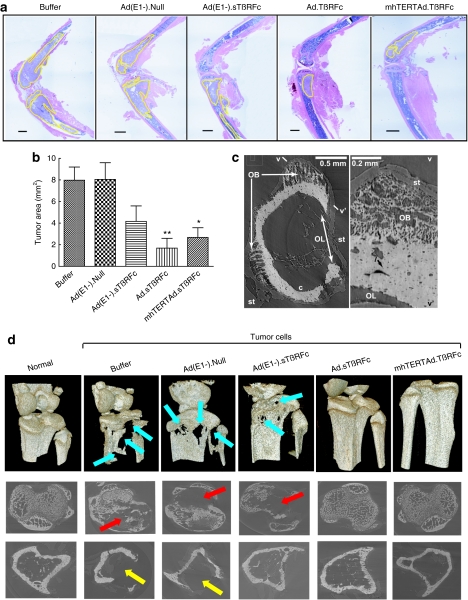
At the end of the experiment (day 28), tumor size was also analyzed by histomorphometric analysis of the bone sections. On day 28, the tibia and femur from the buffer-treated group and the Ad(E1−).Null-treated group had high tumor burdens of 7.98 ± 1.22 mm2 and 8.06 ± 1.54 mm2, respectively (Figure 3a,b). Ad(E1−).sTβRFc reduced the tumor burden but the reduction was not significant (4.07 ± 1.37 mm2, P > 0.05). Significant effects on the reduction of tumor burden were observed in the Ad.sTβRFc-treated (1.68 ± 0.91 mm2, P < 0.01) and mhTERTAd.sTβRFc-treated groups (2.68 ± 0.86 mm2, P < 0.05). The histological examination of the bone samples from various treatment groups shows that in bones with high tumor burden [the majority of the bones in the buffer treated or Ad(E1−).Null-treated groups], bone matrix was generally destroyed, whereas the bones with less tumor burden such as in the Ad.sTβRFc-treated group had intact bone matrix (Figure 3a).
Figure 3.
Analysis of tumor burden at bone site on day 28. (a) Representative longitudinal, midsagittal hematoxylin and eosin (H&E)-stained sections of tibia/femur from each group. Bar = 500 µm, original magnification is ×20. (b) Tumor areas outlined with yellow in (a) were used to measure tumor burden in each sample. Numbers of bone samples used in each group are: buffer (n = 10), Ad(E1−).Null (n = 10), Ad(E1−).sTβRFc (n = 12), Ad.sTβRFc (n = 12), and mhTERTAd.sTβRFc (n = 12). P value comparisons with buffer group are shown (*P < 0.05, ** P < 0.01). (c) Ad(E1−).Null femoral diaphysis. Left: MicroCT slice showing osteolytic (OL) and osteoblastic (OB) lesion, cortical bone c and soft tissue (st). Right: Numerical section v–v' perpendicular to the slice and showing osteocyte lacuna l; fine, porous bone in OB and rough bone surface at OL. Lighter pixels represent higher mineral densities. (d) MicroCT-based 3D renderings of bones. Upper panel, images show extensive bone destruction in buffer and Ad(E1−).Null-treated groups (blue arrows), which were reduced in the other vector-treated groups. Middle panel, images around the growth plate in tibia show trabecular destruction (red arrows). Lower panel, images 1,450 µm distal of tibia growth plate showing cortical loss (yellow arrows).
MicroCT revealed osteolytic as well as osteoblastic lesions (Figure 3c,d). Osteoblastic lesions are seen near osteolytic lesions in the distal femur (Figure 3c), and the fine structure of both are very clear. The 3D reconstructed images showed extensive osteolytic bone destruction in buffer and Ad(E1−).Null-treated groups (Figure 3d, upper panel, blue arrows), which were reduced in the other vectors-treated groups. Osteolytic (but not osteoblastic) lesions are seen in growth plate volumes and proximal cortices of the buffer, Ad(E1−).Null and Ad(E1−).sTβRFc tibiae (Figure 3d). The images around tibia growth plate showed trabecular destruction (red arrows, middle panel, Figure 3d), and cortical loss (yellow arrows, lower panel, Figure 3d) which were inhibited by Ad.sTβRFc and mhTERTAd.sTβRFc. Because >5-mm bone lengths are imaged simultaneously, it is possible, with relatively little effort, to interrogate any arbitrary subvolume with sensitivity revealing osteoblastic as well as osteolytic lesions, the former being something easily missed in radiographs or in histology of single longitudinal sections. These results confirm that in this model, bone metastasis is associated predominantly with bone destruction. This is consistent with observations of human breast cancer metastases: mostly osteolytic with up to 15% osteoblastic or mixed.11
Effect of adenoviral vectors on osteoclast numbers and blood levels of TRACP 5b and sTGFβRIIFc
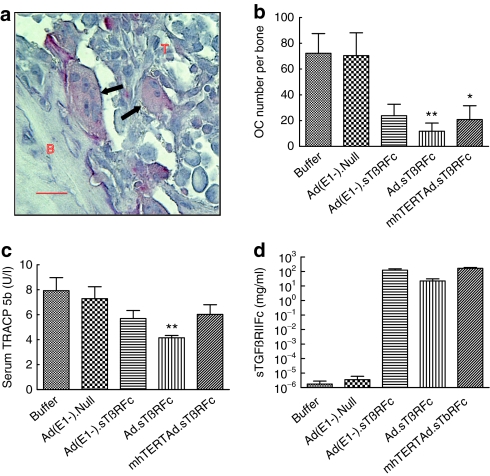
To examine the efficacy of oncolytic viral inhibition of tumor-induced osteolytic bone destruction, the bone resorbing tartrate-resistant acid phosphatase positive multinucleated osteoclasts (shown as arrows in Figure 4a) in bone samples were examined on day 28. Bones from the buffer or Ad(E1−).Null groups had high osteoclast numbers: 72.2 ± 15.3 and 70.4 ± 17.7, respectively (Figure 4b). Ad(E1−).sTβRFc reduced osteoclast production, but not significantly (23.8 ± 8.8, P > 0.05). However, significant reductions were observed in the Ad.sTβRFc (11.7 ± 6.3, P < 0.01) and mhTERTAd.sTβRFc (20.8 ± 10.7, P < 0.05) groups (Figure 4b). To further quantify the osteolytic bone destruction, TRACP 5b protein a secreted marker of osteoclast number and bone resorption in the blood was measured.30 On day 28, the serum levels of TRACP 5b in the buffer, Ad(E1−).Null, Ad(E1−).sTβRFc, Ad.sTβRFc, and mhTERTAd.sTβRFc treatment groups were 7.93 ± 1.05, 7.29 ± 0.96, 5.70 ± 0.64, 4.15 ± 0.18, and 6.03 ± 0.77 units/l, respectively (Figure 4c). Ad.sTβRFc was the only group that showed significant inhibition of serum TRAPC 5b levels compared to the buffer group (P < 0.01) (Figure 4c).
Figure 4.
Osteoclast activity at bone site; serum TRACP 5b, and sTGFβRIIFc levels on day 28. (a) Tartrate-resistant acid phosphatase (TRAP) staining of bone (arrows, osteoclasts; B, bone; T, tumor). Bar = 25 µm, original magnification is ×400. (b) Osteoclast (OC) number per tibia/femur calculated in TRAP-stained sections. Numbers of bone samples used are: buffer (n = 10), Ad(E1−).Null (n = 10), Ad(E1−).sTβRFc (n = 12), Ad.sTβRFc (n = 12), and mhTERTAd.sTβRFc (n = 12). (c) Serum TRACP 5b concentration in units/l. (d) Serum sTGFβRIIFc levels. Number of mice used in various groups for c and d are: buffer (n = 10), Ad(E1−).Null (n = 10), dl309 (n = 1), Ad(E1−).sTβRFc (n = 12), Ad.sTβRFc (n = 12), and mhTERTAd.sTβRFc (n = 12). P value comparisons with buffer group are shown for b and c (*P < 0.05, ** P < 0.01).
To examine vector-induced sTGFβRIIFc production, serum amounts of sTGFβRIIFc were measured. On day 28, mice that received buffer, dl309 or Ad(E1−).Null had a basal level of sTGFβRIIFc in blood (2.0×10⁻⁶–5.1×10⁻⁶ mg/ml). However, Ad(E1−).sTβRFc, Ad.sTβRFc, and mhTERTAd.sTβRFc all produced high levels of sTGFβRIIFc: 122.2 ± 27.9, 22.1 ± 8.6, 164.6 ± 24.0 mg/ml, respectively (Figure 4d). Since sTGFβRIIFc has been shown to bind with TGFβ-1 and inhibit TGFβ1-dependent signaling in vitro,29 it is likely that adenoviral-mediated production of sTGFβRIIFc in vivo described here would also inhibit TGFβ signaling pathways at the tumor/bone site, and it would contribute toward antitumor effect of Ad(E1−).sTβRFc, Ad.sTβRFc, and mhTERTAd.sTβRFc.
Effect of adenoviral vectors on body weight loss during the course of metastases progression
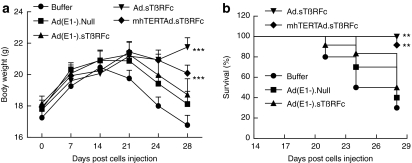
We have observed that in this metastasis model, mice begin to appear cachexic about 2 weeks after intracardiac inoculation of tumor cells. To examine whether the adenoviral vectors being investigated here can inhibit tumor-induced cachexia-like symptoms, mice body weights were examined twice a week during the course of the experiment (Figure 5). Mice that had received buffer started to lose body weight quite rapidly after day 14 (Figure 5a). Mice in the Ad(E1−).Null and Ad(E1−).sTβRFc groups started losing weight from day 21 onwards, and mice in the mhTERTAd.sTβRFc group mice also lost some weight after day 21. However, Ad.sTβRFc group mice did not lose body weight, instead the mice gained body weight even after day 21 (Figure 5a). During the course of the experiment from day 0 to day 28, the buffer group experienced a slight reduction (2.46 ± 3.72%) in body weight. In Ad(E1−).Null and Ad(E1−).sTβRFc groups, body weight gains were 2.01 ± 4.85% and 3.00 ± 4.66%, respectively, which were not significantly different from the buffer group (P > 0.05). However, significant body weight gains were produced in Ad.sTβRFc (22.57 ± 3.17% increase, P < 0.001), and mhTERTAd.sTβRFc (12.26 ± 2.39% increase, P < 0.05) groups. Using the criteria of 10% body weight loss from day 14 to 28 as a predictor of poor survival, Ad(E1−).Null and Ad(E1−).sTβRFc had no significant survival advantage over buffer groups in log-rank survival analysis (P values > 0.05). Favorable survival outcomes were observed however, in the Ad.sTβRFc (P < 0.01) and mhTERTAd.sTβRFc (P < 0.01) treated groups (Figure 5b).
Figure 5.
Body weight analysis. (a) Mouse body weight analysis. Average body weight per group throughout the experiment is plotted as the mean ± SEM. (b) Kaplan–Meier survival plot showing mice with <10% loss of body weight (survival %) from day 14 to day 28 in various treatment groups. Number of mice in various groups are: buffer (n = 10), Ad(E1−).Null (n = 10), Ad(E1−).sTβRFc (n = 12), Ad.sTβRFc (n = 12), and mhTERTAd.sTβRFc (n = 12). P value comparisons with buffer group are shown for a and b (*P < 0.05, ** P < 0.01, ***P < 0.001).
Safety of systemic administration of oncolytic adenoviruses
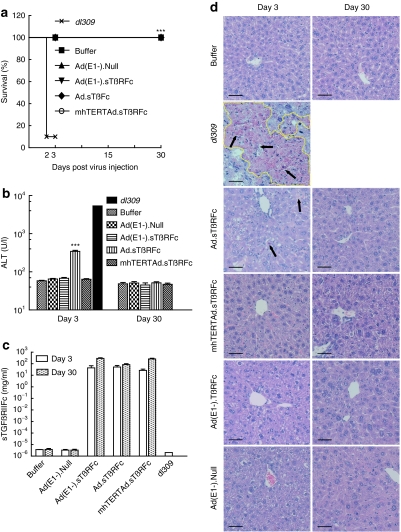
Next, we examined the safety of intravenously delivered viral vectors. Nude mice were administered a single dose of adenoviral vectors or a wild-type adenovirus dl309. By day 2, nine out of ten mice died in the dl309 group, and the remaining one was visibly sick before termination on day 3. None of the mice in the other groups died or became sick (Figure 6a). On day 3, alanine aminotransferase (ALT) level in buffer group was 58.17 ± 1.906 units/l. The dl309 group mouse had a very high level of ALT (5,365.3 units/l, Figure 6b), but was excluded from the statistical analysis. Ad(E1−).Null, Ad(E1−).sTβRFc, and mhTERTAd.sTβRFc had no significant effect on ALT levels (P > 0.05). The Ad.sTβRFc group had a higher level of ALT (344.5 ± 22.1 units/l, P <0.001), but the increase subsided by day 30 (51.5 ± 3.4 units/l, Figure 6b). These differences in viral toxicity among different groups is probably not due to sTGFβRIIFc expression, as the Ad(E1−).sTβRFc, Ad.sTβRFc, and mhTERTAd.sTβRFc treatment groups all produced high levels of sTGFβRIIFc in serum on day 3 [43.3 ± 23.8, 51.3 ± 18.3, and 26.5 ± 7.1 mg/ml, respectively (Figure 6c)] and on day 30 [285.3 ± 39.1, 82.6 ± 16.5, and 255.8 ± 41.4 mg/ml, respectively (Figure 6c)]. Liver pathology was consistent with the liver ALT enzyme analysis. In the dl309 group, the liver (day 3 sample) showed extensive geographic necrosis; only about 30% of the tissue appeared viable. Some individual cell necrosis, but no geographical areas of necrosis were observed in the Ad.sTβRFc group on day 3, but by day 30 the tissue appeared nearly normal; only some increase in mitotic rate of hepatocytes along with nucleomegaly was observed. Similarly, some increase in mitotic rate of hepatocytes and nucleomegaly was also observed in the mhTERTAd.sTβRFc, Ad(E1−).sTβRFc, and Ad(E1−).Null groups on day 3 and day 30 (Figure 6d).
Figure 6.
Safety and toxicity studies in nude mice. Four- to six-week-old nude mice were given intravenous injection of 2 × 10⁸ plaque-forming units (pfu)/mouse of adenoviruses or 100 µl of buffer. Buffer (n = 6), Ad(E1−).Null (n = 6), Ad(E1−).sTβRFc (n = 6), Ad.sTβRFc (n = 10), mhTERTAd.sTβRFc (n = 10) or dl309 (n = 10). (a) Log-rank analysis of mouse survival showing 9/10 deaths in dl309 group. On days 3 and 30 postadministration, the following were analyzed. (b) Serum alanine aminotransferase (ALT) concentration. (c) Serum sTGFβRIIFc protein concentration. P value comparisons with buffer group are shown for (a) and (b) (***P < 0.001, dl309 group not considered in the analysis). (d) Representative hematoxylin and eosin (H&E)-stained liver sections on days 3 and 30 in different groups. Bar = 50 µm, original magnification is ×200. Extensive geographic necrosis area is outlined with yellow and individual cell necrosis is indicated with arrows.
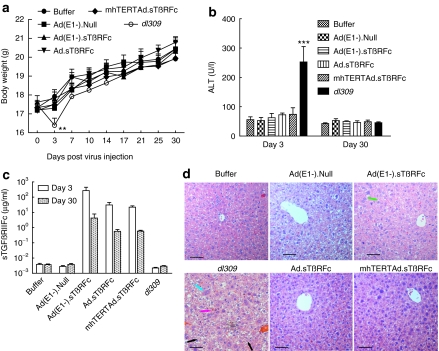
We have also conducted the safety/toxicity studies in immunocompetent Balb/c mice. Following a single dose of adenoviral intravenous delivery, mice in dl309 group exhibited a significant reduction in body weight by day 3 (Figure 7a, P < 0.01) and gradually recovered over time; however, mice in all the other groups did not lose body weight after virus or buffer injection, instead gained body weight during the course of the experiment (Figure 7a). On day 3, ALT levels in dl309 group were 252.7 ± 52.4 units/l) were significantly higher compared to other treatment groups (P < 0.001) (Figure 7b). However, by day 30, ALT levels appeared normal even in dl309-treated mice. Intravenous delivery of Ad(E1−).sTβRFc, Ad.sTβRFc, and mhTERTAd.sTβRFc produced significant levels of sTGFβRIIFc in serum- 271.9 ± 177.5, 30.7 ± 13.7, and 22.1 ± 4.6 µg/ml, respectively on day 3. However, there was a reduction in serum sTGFβRIIFc levels from day 3 to day 30 (4.2 ± 3.7, 0.6 ± 0.2, and 0.6 ± 0.1 µg/ml, respectively) in these treatment groups (Figure 7c). On day 3, liver pathology showed significant necrosis and widespread hepatocellular swelling changes and cytoplasmic clarification, along with mild increased inflammation in lobules in dl309 group. However, no necrosis and only mild binucleation and degenerative cytoplasmic changes along with some increased mitotic activity was observed in Ad.sTβRFc, mhTERTAd.sTβRFc, Ad(E1−).sTβRFc, and Ad(E1−).Null treatment groups (Figure 7d). By day 30, liver pathology was nearly normal in all the treatment groups (data not shown).
Figure 7.
Safety and toxicity studies in BALB/c mice. Four- to six-week-old BALB/c mice were given intravenous injection of 2 × 10⁸ plaque-forming units (pfu)/mouse of adenoviruses or 100 µl of buffer. Buffer (n = 8), Ad(E1−).Null (n = 8), Ad(E1−).sTβRFc (n = 8), Ad.sTβRFc (n = 8), mhTERTAd.sTβRFc (n = 8), or dl309 (n = 8). (a) Mouse body weight analysis. Average body weight per group throughout the experiment is plotted as the mean ± SEM. (b) Serum alanine aminotransferase (ALT) concentration. (c) Serum sTGFβRIIFc protein concentration. P value comparisons with buffer group are shown for (a) and (b) (**P < 0.01, ***P <0.001). (d) Representative hematoxylin and eosin (H&E)-stained liver sections on day 3 in different groups. Bar = 50 µm, original magnification is ×200. Cell necrosis is indicated with pink arrow; cellular swelling and cytoplasmic clarification is indicated with black arrow; binucleation is indicated with blue arrow; and mitosis is indicated with green arrow.
Discussion
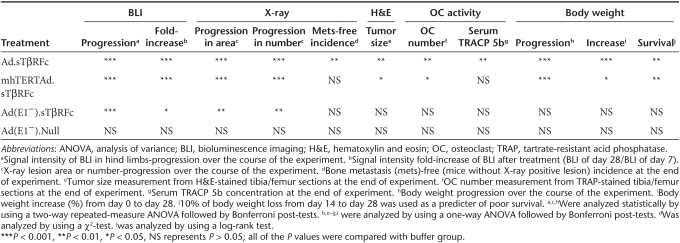
The key finding in this study is that the systemic delivery of the oncolytic virus Ad.sTβRFc is quite potent in inhibiting the progression of established bone metastases and conferring survival advantage to mice in this breast cancer model. This was evident in multiple assays: real-time monitoring of tumor growth by BLI and X-ray radiography of mice in vivo; ex vivo analyses of the tumor burden and osteoclast activation; and the favorable clinical response including the occurrence of tumor-free mice and visible reversal of cachexia-like symptoms and body weight gains. Another oncolytic virus, mhTERTAd.sTβRFc, was also effective in inhibiting bone metastases, albeit slightly weaker than Ad.sTβRFc in some of the measured responses. A nonreplicating Ad(E1−).sTβRFc virus can inhibit tumor growth, though it failed to exert a significant clinical response (Table 1). It is quite interesting that mhTERTAd.sTβRFc is slightly less potent than Ad.sTβRFc as an antitumor agent. Both Ad.sTβRFc and mhTERTAd.sTβRFc are derived from dl01/07 that has two mutations in the E1A gene that confers selective replication in the tumor cells.31 One reason for lower mhTERTAd.sTβRFc effectiveness could be that, though mhTERT promoter is tumor-specific,29 it is probably a weaker promoter than the adenoviral E1A promoter that drives viral replication in Ad.sTβRFc. As a result of this, somewhat reduced oncolytic effects are observed by mhTERTAd.sTβRFc. However, it is noteworthy that oncolytic adenoviral vectors in which viral replication is under hTERT promoter has been shown to be quite effective in inhibiting tumor growth in multiple tumor models,32,33,34,35,36 and have found to be generally safe and effective in clinical trials.32,33,34,37 In future, it would be important to examine the efficacy of these viruses in clinically relevant orthotopic metastatic tumor models, using sensitive florescence techniques as described in the literature.38,39
Table 1. Comparison of various adenoviral vectors in multiple assays.
It is interesting to note that in our studies, over expression of sTGFβRIIFc via a nonreplicating Ad(E1−).sTβRFc virus did indeed slow down the progression of bone metastasis, possibly by inhibiting TGFβ signaling and thus interfering with the vicious cycle at the tumor/bone site. However, this is eventually not sufficient to inhibit the uncontrolled progression of osteolytic lesions which could also involve factors other than TGFβ-dependent signaling pathways. In that regard, it is noteworthy that both the oncolytic viruses Ad.sTβRFc and mhTERTAd.sTβRFc derived from dl01/07 viral backbone, can replicate in cancer cells and cause tumor oncolysis regardless of the genetic alterations in the tumor cells.6,31 Therefore, we believe that the combination of sTGFβRIIFc production and tumor destruction by Ad.sTβRFc is more effective in inhibiting bone metastasis and in producing favorable clinical outcomes such as body weight gain in mice. Based on this, we propose the following model to explain our results described here. Systemic administration of Ad.sTβRFc or mhTERTAd.sTβRFc results in its uptake in the skeletal tumors, resulting in viral replication and some tumor destruction. Both Ad.sTβRFc and mhTERTAd.sTβRFc vectors produce sTGFβRIIFc, that can be secreted into the tumor-bone microenvironment causing the inhibition of aberrant TGFβ signaling in various target cells including breast tumor cells, osteoclasts, and osteoblasts. This would result in the induction of osteoblast differentiation, inhibition of osteoclastogenesis, and inhibition of bone resorption, which in turn would inhibit the release of growth factors from the bone matrix, further inhibiting the TGFβ-dependent tumor growth. We have shown adenoviral replication (hexon production) and sTGFβRIIFc expression in the skeletal tumors following intravenous injection of Ad.sTβRFc,28 and mhTERTAd.sTβRFcFc (Z. Hu and P. Seth, unpublished results). However, many of the key proposed steps involved in Ad.sTβRFc and mhTERTAd.sTβRFc-mediated inhibition of bone metastasis described here remain to be investigated in future.
Another important finding here is that both the oncolytic adenoviruses Ad.sTβRFc and mhTERTAd.sTβRFc can be safely administered systemically. In immunodeficient mice, animal deaths occurred within 3-days after the systemic delivery of wild-type adenovirus dl309, whereas none of the mice died during the treatment by the same viral dose of oncolytic adenoviruses. However, a slight increase in liver enzyme on day 3 was observed after Ad.sTβRFc administration, which subsided with time. This is not surprising given that intravenous injection of oncolytic virus will not only be taken up by the skeletal tumors,28 but also by the mouse liver resulting in transient hepatotoxicity.40,41,42 Interestingly, the mhTERTAd.sTβRFc oncolytic virus did not induce significant transient ALT activity. Thus the lower antitumor potency of mhTERTAd.sTβRFc as discussed above, is somewhat compensated by its slightly better safety profile. In general, relatively similar safety/toxicity results were obtained in immunocompetent mice model. However, in BALB/c mice there was a clear reduction of vector-mediated sTGFβRIIFc production from day 3 to day 30. This could possibly be due to the massive immune responses mounted against the adenoviral-infected cells, and possibly against the foreign transgene as previously reported for other recombinant adenoviruses,43,44 a research area that needs careful future investigations. It would be also interesting to examine the antitumor responses in an immunocompetent mice model.
To our knowledge, this is the first report in which systemic delivery of oncolytic adenoviruses such as Ad.sTβRFc and mhTERTAd.sTβRFc have been shown to inhibit established bone metastases in a breast cancer model. Our next critical step will be to conduct clinical trials that would include a careful dose escalation study to evaluate the safety and efficacy of the Ad.sTβRFc and mhTERTAd.sTβRFc viruses in advanced stage breast cancer patients with bone metastases.
Materials and Methods
Cell lines and viruses. HEK293 cells (ATCC, Manassas, VA) were maintained as described earlier.45 A MDA-MB-231-luc2 cell line was generated by stable transfection of the parental MDA-MB-231 cell line (kindly provided by Dr Theresa Guise) with a pGL4.17[luc2/Neo] vector (Promega, Madison, WI), and cultured with 1,000 µg/ml G418 sulfate (Promega). Adenoviral vectors expressing sTGFβRIIFc are: Ad.sTβRFc, an oncolytic adenovirus;6 mhTERTAd.sTβRFc, an mhTERT promoter-controlled oncolytic adenovirus,29 and Ad(E1−).sTβRFc, a nonreplicating adenovirus.29 Ad(E1−).Null is a nonreplicating adenovirus without any foreign gene, and dl309 is a wild-type adenovirus.46 All adenoviral vectors were amplified in HEK293 cells and purified as described earlier.45
Bone metastasis model. All animal experimental procedures were approved by the Institutional Animal Care and Use Committee at NorthShore University HealthSystem. To establish bone metastasis, MDA-MB-231-luc2 cells (1.5 × 10⁵/mouse) were inoculated into the left ventricle of 5-week-old female athymic nu/nu mice (Charles River Laboratories, Wilmington, MA) on day 0, as described earlier.28,47
BLI. Noninvasive BLI was performed dorsally and ventrally on each mouse with a Xenogen IVIS spectrum (Caliper Life Sciences, Hopkinton, MA). Mice were injected intraperitoneally with 100 µl of the -luciferin solution (150 mg/kg in phosphate-buffered saline; Gold BioTechnology, St Louis, MO) and anesthetized with 1.5–2.0% isoflurane. Signal intensity was quantified as the total flux (photons/seconds) within regions of interest positioned over left and right hind limbs using Living Image software 3.0 (Caliper Life Sciences). BLI was conducted weekly for the duration of the study.
Treatment protocol. Combined dorsal and ventral BLI of both hind limbs on day 7 were used to divide mice into various groups (10–12 mice/group), using a ranked/random assignment to obtain similar tumor burden in each group. Buffer or adenoviruses were injected via tail vein (2 × 10⁸ plaque-forming units/mouse in 100 µl buffer) on day 8 and on day 11 (1 × 10⁸ plaque-forming units/mouse in 100 µl buffer). All of the mice were euthanized after blood was collected on day 28.
Radiography. Mice were monitored weekly for osteolytic bone metastasis by radiography (Faxitron X-ray, Wheeling, IL) as described earlier.28 X-ray lesion areas in the hind limbs were quantified by Image J software (National Institutes of Health, Bethesda, MD).
Bone histology and histomorphometry. On day 28, mice were euthanized, and hind limbs were harvested, processed, and stained with hematoxylin and eosin as previously described.28 Tumor burden per tibia/femur was quantified on hematoxylin and eosin-stained sections as previously described.28 Osteoclasts within the tumor and on bone-tumor interface per tibia/femur were measured after staining for tartrate-resistant acid phosphatase activity.48
Synchrotron micro-computed tomography. Synchrotron micro-computed tomography, which can provide spatial resolution and contrast sensitivity superior to that in radiography and X-ray tube-based micro-computed tomography,49 imaged volumes of representative hind limbs of each treatment group. Data were collected at station 2-BM of the Advanced Photon Source at Argonne National Laboratory (Argonne, IL) using the dedicated micro-computed tomography instrument50 using the following conditions: 15 keV, 0.12° rotation increment, 180° rotation range (2K)2 reconstructions with 2.9-µm isotropic volume elements (voxels). Statistical analysis is not yet possible because too few replicates have been imaged to date, but the data suffice to illustrate the 3D effects on the bone.
Safety and liver toxicity assay
Nude mice. Four- to six-week-old athymic nu/nu mice were injected via tail vein with buffer or 2 × 10⁸ plaque-forming units/mouse of various adenoviruses (6 or 10 mice per group) on day 0. Blood samples were collected on day 3 and day 30, and analyzed for serum ALT using an ALT activity assay kit (Cayman Chemical Company, Ann Arbor, MI). Mice livers were harvested, fixed in formalin, and stained with hematoxylin and eosin for the histopathology analysis.
Immunocompetent mice. Four- to six-week-old BALB/c were injected via tail vein with buffer or 2 × 10⁸ plaque-forming units/mouse of various adenoviruses (8 mice per group). Blood samples and liver were collected after 3 or 30 days of vectors administrations and analyzed as described above for nude mice.
Quantification of TRACP 5b, and sTGFβRIIFc in serum. Serum concentrations of osteoclast-derived TRACP 5b were measured by using a solid phase immunofixed enzyme activity (MouseTRAP) kit according to the manufacturer's instructions (Immunodiagnostic Systems, Phoenix, AZ). Serum sTGFβRIIFc levels were determined by enzyme-linked immunosorbent assay using antibodies against human immunoglobulin G Fcγ fragment (Jackson Immunoresearch, West Grove, PA) as described earlier.29
Statistical analysis. Data are presented as mean ± SEM and statistically analyzed using GraphPad Prism software version 5 (GraphPad software, San Diego, CA). A two-way repeated-measure analysis of variance followed by Bonferroni post-tests was used for all the data of over time course. A χ2-test was used for the bone metastasis incidence data. A log-rank test was used for the survival data. Statistical significance was analyzed using one-way analysis of variance followed by Bonferroni post-tests for multiple groups for rest of the data. Differences were considered significant at P < 0.05.
Acknowledgments
The work was funded by the National Institutes of Health grant # R01CA12738 (P.S.). Use of the Advanced Photon Source was supported by the U.S. Department of Energy, Office of Science, Office of Basic Energy Sciences, under Contract No. DE-AC02-06CH11357. The authors declared no conflict of interest. The authors thank Dr Khandekar, Maxine, and James Farrell, Carol Gollob Foundation, and an Anonymous source for their generous support. We thank Francesco De Carlo (APS) for his help in collecting the synchrotron microCT data. We thank Dr Manolova-Rairoff and Rebecca Orr for help in tissue processing, and Dr Jovanovic for reviewing the hematoxylin and eosin-stained liver sections.
REFERENCES
- Cancer Facts and Figures 2010 American Cancer Society . < http://www.cancer.org/Research/ CancerFactsandFigures >.
- Coleman RE. Metastatic bone disease: clinical features, pathophysiology and treatment strategies. Cancer Treat Rev. 2001;27:165–176. doi: 10.1053/ctrv.2000.0210. [DOI] [PubMed] [Google Scholar]
- Lu J, Steeg PS, Price JE, Krishnamurthy S, Mani SA, Reuben J.et al. (2009Breast cancer metastasis: challenges and opportunities Cancer Res 694951–4953. [DOI] [PubMed] [Google Scholar]
- Bischoff JR, Kirn DH, Williams A, Heise C, Horn S, Muna M.et al. (1996An adenovirus mutant that replicates selectively in p53-deficient human tumor cells Science 274373–376. [DOI] [PubMed] [Google Scholar]
- McCormick F. Future prospects for oncolytic therapy. Oncogene. 2005;24:7817–7819. doi: 10.1038/sj.onc.1209064. [DOI] [PubMed] [Google Scholar]
- Seth P, Wang ZG, Pister A, Zafar MB, Kim S, Guise T.et al. (2006Development of oncolytic adenovirus armed with a fusion of soluble transforming growth factor-β receptor II and human immunoglobulin Fc for breast cancer therapy Hum Gene Ther 171152–1160. [DOI] [PubMed] [Google Scholar]
- Crompton AM., and, Kirn DH. From ONYX-015 to armed vaccinia viruses: the education and evolution of oncolytic virus development. Curr Cancer Drug Targets. 2007;7:133–139. doi: 10.2174/156800907780058862. [DOI] [PubMed] [Google Scholar]
- Li JL, Liu HL, Zhang XR, Xu JP, Hu WK, Liang M.et al. (2009A phase I trial of intratumoral administration of recombinant oncolytic adenovirus overexpressing HSP70 in advanced solid tumor patients Gene Ther 16376–382. [DOI] [PubMed] [Google Scholar]
- Yun CO. Overcoming the extracellular matrix barrier to improve intratumoral spread and therapeutic potential of oncolytic virotherapy. Curr Opin Mol Ther. 2008;10:356–361. [PubMed] [Google Scholar]
- Yamamoto M., and, Curiel DT. Current issues and future directions of oncolytic adenoviruses. Mol Ther. 2010;18:243–250. doi: 10.1038/mt.2009.266. [DOI] [PMC free article] [PubMed] [Google Scholar]
- Casimiro S, Guise TA., and, Chirgwin J. The critical role of the bone microenvironment in cancer metastases. Mol Cell Endocrinol. 2009;310:71–81. doi: 10.1016/j.mce.2009.07.004. [DOI] [PubMed] [Google Scholar]
- Guise TA, Mohammad KS, Clines G, Stebbins EG, Wong DH, Higgins LS.et al. (2006Basic mechanisms responsible for osteolytic and osteoblastic bone metastases Clin Cancer Res 1220 Pt 26213s–6216s. [DOI] [PubMed] [Google Scholar]
- Shipitsin M, Campbell LL, Argani P, Weremowicz S, Bloushtain-Qimron N, Yao J.et al. (2007Molecular definition of breast tumor heterogeneity Cancer Cell 11259–273. [DOI] [PubMed] [Google Scholar]
- Kang Y, He W, Tulley S, Gupta GP, Serganova I, Chen CR.et al. (2005Breast cancer bone metastasis mediated by the Smad tumor suppressor pathway Proc Natl Acad Sci USA 10213909–13914. [DOI] [PMC free article] [PubMed] [Google Scholar]
- Nguyen DX, Bos PD., and, Massagué J. Metastasis: from dissemination to organ-specific colonization. Nat Rev Cancer. 2009;9:274–284. doi: 10.1038/nrc2622. [DOI] [PubMed] [Google Scholar]
- Steeg PS., and, Theodorescu D. Metastasis: a therapeutic target for cancer. Nat Clin Pract Oncol. 2008;5:206–219. doi: 10.1038/ncponc1066. [DOI] [PMC free article] [PubMed] [Google Scholar]
- Onishi T, Hayashi N, Theriault RL, Hortobagyi GN., and, Ueno NT. Future directions of bone-targeted therapy for metastatic breast cancer. Nat Rev Clin Oncol. 2010;7:641–651. doi: 10.1038/nrclinonc.2010.134. [DOI] [PubMed] [Google Scholar]
- Tan AR, Alexe G., and, Reiss M. Transforming growth factor-β signaling: emerging stem cell target in metastatic breast cancer. Breast Cancer Res Treat. 2009;115:453–495. doi: 10.1007/s10549-008-0184-1. [DOI] [PMC free article] [PubMed] [Google Scholar]
- Biswas S, Criswell TL, Wang SE., and, Arteaga CL. Inhibition of transforming growth factor-β signaling in human cancer: targeting a tumor suppressor network as a therapeutic strategy. Clin Cancer Res. 2006;12 14 Pt 1:4142–4146. doi: 10.1158/1078-0432.CCR-06-0952. [DOI] [PubMed] [Google Scholar]
- Iyer S, Wang ZG, Akhtari M, Zhao W., and, Seth P. Targeting TGFβ signaling for cancer therapy. Cancer Biol Ther. 2005;4:261–266. doi: 10.4161/cbt.4.3.1566. [DOI] [PubMed] [Google Scholar]
- Akhtari M, Mansuri J, Newman KA, Guise TM., and, Seth P. Biology of breast cancer bone metastasis. Cancer Biol Ther. 2008;7:3–9. doi: 10.4161/cbt.7.1.5163. [DOI] [PubMed] [Google Scholar]
- Guise TA. Breaking down bone: new insight into site-specific mechanisms of breast cancer osteolysis mediated by metalloproteinases. Genes Dev. 2009;23:2117–2123. doi: 10.1101/gad.1854909. [DOI] [PMC free article] [PubMed] [Google Scholar]
- Kang Y, Siegel PM, Shu W, Drobnjak M, Kakonen SM, Cordón-Cardo C.et al. (2003A multigenic program mediating breast cancer metastasis to bone Cancer Cell 3537–549. [DOI] [PubMed] [Google Scholar]
- Padua D., and, Massagué J. Roles of TGFβ in metastasis. Cell Res. 2009;19:89–102. doi: 10.1038/cr.2008.316. [DOI] [PubMed] [Google Scholar]
- Gupta J, Robbins J, Jilling T., and, Seth P. TGFβ-dependent induction of interleukin-11 and interleukin-8 involves SMAD and p38 MAPK pathways in breast tumor models with varied bone metastases potential. Cancer Biol Ther. 2011;11:311–316. doi: 10.4161/cbt.11.3.14096. [DOI] [PMC free article] [PubMed] [Google Scholar]
- Tester AM, Sharp JA, Dhanesuan N, Waltham M., and, Thompson EW. Correlation between extent of osteolytic damage and metastatic burden of human breast cancer metastasis in nude mice: real-time PCR quantitation. Clin Exp Metastasis. 2002;19:377–383. doi: 10.1023/a:1016381416463. [DOI] [PubMed] [Google Scholar]
- Kingsley LA, Fournier PG, Chirgwin JM., and, Guise TA. Molecular biology of bone metastasis. Mol Cancer Ther. 2007;6:2609–2617. doi: 10.1158/1535-7163.MCT-07-0234. [DOI] [PubMed] [Google Scholar]
- Hu Z, Zhang Z, Guise T., and, Seth P. Systemic delivery of an oncolytic adenovirus expressing soluble transforming growth factor-β receptor II-Fc fusion protein can inhibit breast cancer bone metastasis in a mouse model. Hum Gene Ther. 2010;21:1623–1629. doi: 10.1089/hum.2010.018. [DOI] [PMC free article] [PubMed] [Google Scholar]
- Hu Z, Robbins JS, Pister A, Zafar MB, Zhang ZW, Gupta J.et al. (2010A modified hTERT promoter-directed oncolytic adenovirus replication with concurrent inhibition of TGFβ signaling for breast cancer therapy Cancer Gene Ther 17235–243. [DOI] [PMC free article] [PubMed] [Google Scholar]
- Janckila AJ, Nakasato YR, Neustadt DH., and, Yam LT. Disease-specific expression of tartrate-resistant acid phosphatase isoforms. J Bone Miner Res. 2003;18:1916–1919. doi: 10.1359/jbmr.2003.18.10.1916. [DOI] [PubMed] [Google Scholar]
- Howe JA, Demers GW, Johnson DE, Neugebauer SE, Perry ST, Vaillancourt MT.et al. (2000Evaluation of E1-mutant adenoviruses as conditionally replicating agents for cancer therapy Mol Ther 2485–495. [DOI] [PubMed] [Google Scholar]
- Huang TG, Savontaus MJ, Shinozaki K, Sauter BV., and, Woo SL. Telomerase-dependent oncolytic adenovirus for cancer treatment. Gene Ther. 2003;10:1241–1247. doi: 10.1038/sj.gt.3301987. [DOI] [PubMed] [Google Scholar]
- Kuroda S, Fujiwara T, Shirakawa Y, Yamasaki Y, Yano S, Uno F.et al. (2010Telomerase-dependent oncolytic adenovirus sensitizes human cancer cells to ionizing radiation via inhibition of DNA repair machinery Cancer Res 709339–9348. [DOI] [PubMed] [Google Scholar]
- Kim E, Kim JH, Shin HY, Lee H, Yang JM, Kim J.et al. (2003Ad-mTERT-delta19, a conditional replication-competent adenovirus driven by the human telomerase promoter, selectively replicates in and elicits cytopathic effect in a cancer cell-specific manner Hum Gene Ther 141415–1428. [DOI] [PubMed] [Google Scholar]
- Kishimoto H, Urata Y, Tanaka N, Fujiwara T., and, Hoffman RM. Selective metastatic tumor labeling with green fluorescent protein and killing by systemic administration of telomerase-dependent adenoviruses. Mol Cancer Ther. 2009;8:3001–3008. doi: 10.1158/1535-7163.MCT-09-0556. [DOI] [PMC free article] [PubMed] [Google Scholar]
- Kishimoto H, Zhao M, Hayashi K, Urata Y, Tanaka N, Fujiwara T.et al. (2009In vivo internal tumor illumination by telomerase-dependent adenoviral GFP for precise surgical navigation Proc Natl Acad Sci USA 10614514–14517. [DOI] [PMC free article] [PubMed] [Google Scholar]
- Nemunaitis J, Tong AW, Nemunaitis M, Senzer N, Phadke AP, Bedell C.et al. (2010A phase I study of telomerase-specific replication competent oncolytic adenovirus (telomelysin) for various solid tumors Mol Ther 18429–434. [DOI] [PMC free article] [PubMed] [Google Scholar]
- Hoffman RM. The multiple uses of fluorescent proteins to visualize cancer in vivo. Nat Rev Cancer. 2005;5:796–806. doi: 10.1038/nrc1717. [DOI] [PubMed] [Google Scholar]
- Hoffman RM. Orthotopic metastatic mouse models for anticancer drug discovery and evaluation: a bridge to the clinic. Invest New Drugs. 1999;17:343–359. doi: 10.1023/a:1006326203858. [DOI] [PubMed] [Google Scholar]
- Kalyuzhniy O, Di Paolo NC, Silvestry M, Hofherr SE, Barry MA, Stewart PL.et al. (2008Adenovirus serotype 5 hexon is critical for virus infection of hepatocytes in vivo Proc Natl Acad Sci USA 1055483–5488. [DOI] [PMC free article] [PubMed] [Google Scholar]
- Waddington SN, McVey JH, Bhella D, Parker AL, Barker K, Atoda H.et al. (2008Adenovirus serotype 5 hexon mediates liver gene transfer Cell 132397–409. [DOI] [PubMed] [Google Scholar]
- Seth P.ed) (1999Adenoviruses: Basic Biology to Gene Therapy RG Landes Company: Austin, TX [Google Scholar]
- Engler H, Machemer T, Philopena J, Wen SF, Quijano E, Ramachandra M.et al. (2004Acute hepatotoxicity of oncolytic adenoviruses in mouse models is associated with expression of wild-type E1a and induction of TNF-alpha Virology 32852–61. [DOI] [PubMed] [Google Scholar]
- Schowalter DB, Himeda CL, Winther BL, Wilson CB., and, Kay MA. Implication of interfering antibody formation and apoptosis as two different mechanisms leading to variable duration of adenovirus-mediated transgene expression in immune-competent mice. J Virol. 1999;73:4755–4766. doi: 10.1128/jvi.73.6.4755-4766.1999. [DOI] [PMC free article] [PubMed] [Google Scholar]
- Katayose D, Gudas J, Nguyen H, Srivastava S, Cowan KH., and, Seth P. Cytotoxic effects of adenovirus-mediated wild-type p53 protein expression in normal and tumor mammary epithelial cells. Clin Cancer Res. 1995;1:889–897. [PubMed] [Google Scholar]
- Bett AJ, Krougliak V., and, Graham FL. DNA sequence of the deletion/insertion in early region 3 of Ad5 dl309. Virus Res. 1995;39:75–82. [PubMed] [Google Scholar]
- Yin JJ, Selander K, Chirgwin JM, Dallas M, Grubbs BG, Wieser R.et al. (1999TGF-β signaling blockade inhibits PTHrP secretion by breast cancer cells and bone metastases development J Clin Invest 103197–206. [DOI] [PMC free article] [PubMed] [Google Scholar]
- Erlebacher A., and, Derynck R. Increased expression of TGF-β 2 in osteoblasts results in an osteoporosis-like phenotype. J Cell Biol. 1996;132:195–210. doi: 10.1083/jcb.132.1.195. [DOI] [PMC free article] [PubMed] [Google Scholar]
- Stock, SR.ed) (2008MicroComputed Tomography: Methodology and Applications Taylor and Francis [Google Scholar]
- Wang YX, Carlo FD, Mancini DC, McNulty I, Tieman B, Bresnahan J.et al (2001A high-throughput X-ray microtomography system at the Advanced Photon Source Rev Sci Instrum 722062–2068. [Google Scholar]


