

Abstract
Cells have developed a mechanism to discriminate between premature termination codons (PTCs) and normal stop codons during translation, sparking vigorous research to develop drugs promoting readthrough at PTCs to treat genetic disorders caused by PTCs. It was posed that this concept could also be applied to regulated gene therapy protocols by incorporating a PTC into a therapeutic gene, so active protein would only be made after administration of a readthrough agent. The strengths of the system are highlighted here by results demonstrating: (i) background expression levels were reduced to 0.01% to 0.0005% of wild type in unselected mass populations of cells depending upon the specific stop codon utilized and its position within the gene; (ii) expression levels responded well to multiple “On” and “Off” regulation cycles in vivo in human xenograft systems; (iii) the level of induction approached three logs using aminoglycoside activators including NB54, a newly synthesized aminoglycoside with significantly reduced toxicity; and (iv) expression levels could be appreciably altered when employing different promoters in a variety of cell types. These results strongly support the contention that this system should have important clinical applications when tight control of gene expression is required.
Introduction
The control of gene expression is essential in governing proper differentiation and developmental process of living cells. Recent advances and efforts to bring regenerative medicines, stem cell reprogramming, and gene therapy closer to clinical settings have further revealed the necessity for the precise control of gene expression. A system where the level of transgene expression could be temporally titrated into a therapeutic window in accordance with the progress of the disease is of crucial importance, especially since some proteins have deleterious side-effects and cannot be constitutively expressed. Thus, a pharmacologically controlled “on-demand” regulatory system with minimal introduction of exogenous elements and no pleiotropic effects is highly desirable for clinical applications.
The development of a stringent pharmacologically controlled gene regulation system is still a challenge despite 20 years of progress since the first usage of gene regulation in eukaryotes, a metal-responsive promoter.1 A limitation in the most widely used transcriptional inducible systems such as tetracycline,2 ecdysone,3 and rapamycin,4 is the requirement to cointroduce a constitutively expressed transcriptional transactivator along with the transgene to be regulated, a requirement with potentially harmful long-term side-effects. The prerequisite for the presence of the transactivator within the same cell as the transgene contributes to clonal variegation, often resulting in laborious efforts to isolate individual colonies with low basal level expression in vitro. Another limitation is the lack of choice in the promoter as the transgene has to be driven by a hybrid promoter containing the transactivator response element fused to a minimal promoter.2,3,4
To circumvent these shortcomings, we investigated and further developed a recently proposed post-transcriptionally regulated inducible system via the exploitation of the premature termination codon (PTC) readthrough mechanism.5 The strategy involves inserting a PTC within the transgene of interest so that full-length proteins are not produced because of premature translation termination. Additionally, the presence of the PTC within certain sections of the gene should elicit nonsense-mediated decay, an mRNA surveillance mechanism which functions to prevent the expression of truncated or aberrant proteins by increasing mRNA degradation. Together nonsense-mediated decay and translational termination should establish a low basal level of expression for this inducible system. To activate gene expression, small molecules such as Geneticin (G418), gentamicin and the newly developed NB54 were used to promote nonsense suppression (readthrough) to generate full-length proteins. Potential strengths of this system are: (i) tight regulation and little “leakiness” eliminating the need to select clonal or oligoclonal populations of cells with low levels of background expression, (ii) only the therapeutic allele needs to be transduced obviating the requirement of an exogenous transactivator, and (iii) it provides flexibility in promoter selection. Here, it is shown that, with minimal modification, the insertion of a nonsense codon within a gene of interest yields very low background levels of expression in mass populations of transduced cells yet can be induced up to three logs in vivo. Moreover, the feasibility of turning “On” and “Off” gene expression at will and of using different promoters to adjust levels of expression are demonstrated with this system. The results suggest that this regulatory approach affords considerable advantages that can be exploited for clinical application.
Results
Selection and placement of the PTC
Of fundamental importance for successfully engineering a post-transcriptionally regulated system is the choice and positioning of the PTC within the transgene. The protein sequences of two reporter genes, synthetic codon optimized sea pansy (Renilla reniformis) luciferase (hRLuc) and firefly (Photinus pyralis) luciferase (FLuc) were analyzed so that essential regions and amino acids which contribute to the folding and functioning of the protein would not be disrupted by the insertion of the PTC within the gene. Studies in different organisms have suggested that glutamine is most likely to be inserted to decode UAA (ochre) and UAG (amber),6,7 while tryptophan is most likely to decode UAG and UGA (opal).6,7,8,9,10 Moreover, UGA has also been shown to be misread by near-cognate tRNACys and tRNAArg in a context-dependent manner.6 Thus, three mutant hRLuc constructs were made with the insertion of the UGA stop codon at different regions, cysteine 124, tryptophan 156, and 219, of the gene (Figure 1a). In parallel, three mutant FLuc constructs were made, where threonine 19111 was mutated to one of the three PTCs: UAA, UAG, or UGA (Figure 1a). Threonine was chosen so that there is no preconceived bias to the decoding of the three PTCs. All mutants in this study were cloned with a cytosine nucleotide at the +4 position as indicated by the conclusion of several suppression studies from other groups.12
Figure 1.

Analysis of the selection and placement options of premature termination codons within the transgenes. (a) The synthetic codon optimized Renilla luciferase (hRLuc) gene construct shown with one of the three amino acid residues: cysteine 124, tryptophan 156 and 219 mutated to the opal nonsense codon. The firefly luciferase (FLuc) gene construct shown with threonine 191 mutated to one of the three: amber, ochre, or opal termination codon. All inserted premature termination codons (PTCs) have the +4 nucleotide as cytosine. (b) Luciferase expression of basal levels of the mutant hRLuc and mutant FLuc constructs in zeocin (50 µg/ml) selected mass population of transfected human embryonic kidney 293 (HEK293) cells. (c) Fold induction of luciferase expression from zeocin selected HEK293 mass population or cells transfected with mutant hRLuc and mutant FLuc constructs. Luciferase activities were assayed after 2.5 × 10⁵ cells are exposed to 400 µg/ml of G418 and 1 mg/ml of gentamicin for 48 hours. All luciferase readings were normalized to total protein. All experiments were done in triplicate and repeated at least two times. Error bars represent standard deviation.
To evaluate the effects on the basal and inducible levels of gene expression due to the positioning and choice of the PTC used, the constructs were transfected into HEK293 (human embryonic kidney 293) cells where a mass population was puromycin selected and then exposed to G418 or gentamicin for induction. The overall basal levels of all the mutant constructs were relatively low. The highest was 0.18% of wild type for the W219 mutant in the hRLuc group and 0.002% of wild type for the UGA mutant in the FLuc group (Figure 1b). The level of PTC suppression varied depending on the location of the PTC and the specific PTC used. G418 consistently yielded ~1.4–2-fold higher levels of induction than gentamicin, with the exception of 4.5-fold higher induction levels for the UGA FLuc mutant. The highest induction achieved with G418 was 17-fold for the C124 hRLuc mutant and 33-fold for the UGA FLuc mutant (Figure 1c). These mutational studies illustrate the importance of establishing the location and the choice of PTC to use when designing the inducible system.
Gene delivery of the post-transcriptionally regulated system in vitro
In order to evaluate the inducible system for gene therapy purpose, a Tat-independent self-inactivating (SIN) HIV-2 based lentiviral vector expressing the secreted humanized version of Gaussia luciferase (hGLuc), from the marine copepod Gaussia princeps, was constructed based on the previously described CRU5SINCGW vector backbone13 (Figure 2a). hGLuc was utilized instead of hRLuc and FLuc for its ability to report cellular and environment cues real-time in vivo by enabling luciferase activity to be assayed directly from blood serum or urine.14 The mutant hGLuc was constructed by incorporating an opal nonsense codon at cysteine residue 73, allowing efficient premature termination to occur yielding low background expression (0.0044% of wild type, data not shown). It is noteworthy that in light of the results described in Figure 1, we constructed another PTC containing allele of hGLuc, however, it was not as responsive to induction as the PTC containing allele at codon 73 (data not shown). This is not surprising given the results in Figure 1, and it is why we utilized the allele modified at codon 73 for further experimentation.
Figure 2.

Regulation of Gaussia luciferase expressions in cells transduced by HIV-2 based lentiviral vectors. (a) Schematic representation of the sequence and location of the inserted premature termination codon (PTC) within the Gaussia luciferase (hGLuc) gene along with the Tat-independent, self-inactivating HIV-2 based lentiviral vector used. ψ, packaging signal; SD, major splice donor; CMV, cytomegalovirus immediate early gene promoter; puro, puromycin resistance gene; WPRE, woodchuck hepatitis virus post-transcriptional regulatory element; rre, rev response element; LTR, long-terminal repeat. (b,c) Kinetics of turning “On” luciferase expression in human embryonic kidney 293 (HEK293) cells infected with the HIV-2 lentiviral vector harboring the mutant hGLuc gene. 1 × 10⁴ stable mass population of transduced HEK293 cells were seeded in 96-well plates and exposed to a constant concentration of 400 µg/ml of G418 (circles) or 1 mg/ml of gentamicin (squares). Luciferase expression was measured from the cultured media every 2 hours up to 24 hours and then every day up to 6 days. (d) Kinetics of turning “Off” luciferase expression in HEK293 cells transduced with lentiviral vector harboring the mutant hGLuc gene. 2.5 × 10⁵ stably selected mass population of transduced cells were seeded in 6-wells and exposed to a constant concentration of 400 µg/ml of G418 (circles) or 1 mg/ml of gentamicin (squares) for 6 hours or 24 hours. Cells were washed with phosphate buffered saline at time of aminoglycosides removal and fresh media was added to the cell. Cultured media was assayed for luciferase activity at 24-hour intervals. (e,f) Luciferase expression in various cell lines transduced with the HIV-2 lentiviral vector harboring the wild-type or mutant allele of hGLuc. Infected cells were selected for puromycin resistance to obtain a stably transduced mass population of cells. Then 2.5 × 10⁵ cells were exposed to 150 µg/ml of G418 and 1 mg/ml of gentamicin for 48 hours before luciferase expression was measured. Wild-type luciferase activity was measured in relative light units (RLU). Induction of mutant hGLuc was represented as fold induction relative to untreated cells. Luciferase readings were normalized to total protein. All experiments were done in triplicate and repeated at least twice. Error bars represent the standard deviation.
To study the kinetics of “switch-on”, HEK293 cells were transduced with the wild-type or mutant versions of hGLuc and a mass population of puromycin-resistant cells was selected prior to exposure to G418 or gentamicin. Subsequently, culture media was sampled at intervals of 2 hours up to 24 hours (Figure 2b) followed by daily assays up to 6 days (Figure 2c). Induction was achieved within a short period of time, with a twofold increase for G418 at 2 hours and gentamicin at 4 hours. G418 was more effective than gentamicin as indicated by the higher levels of expression beginning at the early time points (Figure 2b,c). Optimal expression with a fold induction of 275 and 28 were achieved at 48 hours for G418 and gentamicin, respectively (Figure 2c). Although continuous exposure of the cells to the aminoglycosides generated an increased accumulation of the secreted protein in the media, cell viability decreased rapidly after 48 hours especially for G418 treated cells (data not shown). Thus, the optimal time point to assay for protein expression, with the balance of expression and cell viability in mind, was 48 hours postdrug exposure.
The “switch-off” response of the regulated system was monitored by pulsing the mutant stable mass population for 6 hours and 24 hours with the aminoglycosides followed by assaying for luciferase activity every 24 hours upon the removal of the drug up to 120 hours. Both aminoglycosides exhibited similar “switch-off” response post 6 hours and 24 hours drug exposure. The most drastic drop, twofold for G418 and 1.6-fold for gentamicin, respectively, was observed between 48 hours and 72 hours after drug removal (Figure 2d). In general, “switch-off” also depends on the pharmacokinetics of the inducer molecule and the half-life of the expressed protein, and for these aminoglycosides and Gaussia luciferase it took approximately a week for the system to reach basal level.
Wild-type or mutant hGLuc were also transduced into U87MG (human glioblastoma-astrocytoma, epithelial-like cell line) and HeLa (human epithelial carcinoma cell line) cells to evaluate the inducible system with aminoglycosides in different cell types. Wild-type luciferase expression was detected at high levels, with 105 relative light units (RLU) for HEK293 and U87MG cells and 104 RLU for HeLa cells (Figure 2e). Moreover, wild-type luciferase expression was not altered by the exposure to the aminoglycosides. Conversely, aminoglycoside exposure of the cells harboring the mutant hGLuc showed induction of luciferase expression in all three cell lines (Figure 2f). In particular, the gene expression “switched-on” significantly in U87MG with 1242-fold increase relative to untreated cells, which was 23- and 16-fold higher induction than HeLa and HEK293 cells, respectively. On the whole, G418 was 2.5-, 10.9-, and 5.8-fold more effective at inducing readthrough than gentamicin for the HEK293, U87MG, and HeLa cells, respectively.
Gene delivery of the post-transcriptionally regulated system in vivo
A xenogeneic transplantation model was utilized to examine regulation in human cells in vivo. For this, wild-type and mutant hGLuc transduced HEK293 cells were injected subcutaneously into NOD-scid IL2Rgammanull mice and the xenografted mice were subjected to an alternating regimen of G418 treatment or withdrawal to monitor switching gene expression “On” and “Off”. The change in luciferase expression was monitored either by noninvasive bioluminescence imaging, at the end points of each induction such as on day 4 and day 10 (Figure 3a) or by measuring hGLuc directly from blood serum collected prior to every G418 injection (Figure 3b). The G418 inducer molecule exhibited specificity on the regulation of the mutant hGLuc and presented no observable effect on the expression of wild-type luciferase (Figure 3b). It also had no palpable influence on tumor growth during the multiple rounds of regulation (Figure 3c). Gene expression was significantly induced upon exposure to G418 while expression waned upon G418 withdrawal through three “On” and two “Off” cycles. It should be noted that we were limited in the period for drug withdrawal and did not wait until expression returned to undetectable levels because animals had to be killed once the tumor reached 1.5 cm in size.
Figure 3.

In vivo regulation of hGLuc expression in a human xenogeneic transplantation model with infected human embryonic kidney 293 (HEK293) cells. (a) Noninvasive bioluminescence imaging of G418 induced hGLuc expression from subcutaneously (s.c.) implanted HEK293 xenograft mice. The top panels show the first “switch-on” induction (day 4) while the bottom panels show the second “switch-on” induction (day 10) of the in vivo system. Control and mutant represent NOD-scid IL2Rgammanull (NSG) mice injected s.c. with transduced HEK293 cells harboring the mutant hGLuc construct exposed to phosphate buffered saline and G418, respectively. Wild type (WT) represent NSG mice injected s.c. with transduced HEK293 cells harboring the wild-type hGLuc construct exposed to G418. Experiments were repeated twice and each time involved the use of at least three mice per experimental group. (b,c) The “On” and “Off” regulation of hGLuc expression in HEK293 xenograft model. Luciferase activities were measured in relative light units (RLU) from blood serum. The graph is represented in RLU/mm3 by correlating the luciferase activity to tumor size. The “ON” and “OFF” arrow on the x-axis indicate when the G418 drug was administered and discontinued, respectively. Blood was collected and tumor size was measured, as described in the Materials and Methods, prior to every injection of G418. (d) Two rounds of regulation on the isolated hGLuc mutant xenograft tumor cells, grown in vitro. 2.5 × 10⁵ cells were seeded in 6-wells and exposed to 150 µg/ml of G418 and 1 mg/ml of gentamicin for 48 hours. Half of the cells were lysed and measured for luciferase activities while the other half were kept in culture without any exposure to aminoglycosides. A week later, 2.5 × 10⁵ cells were seeded and exposed to the aminoglycosides for 48 hours before luciferase activities were measured. Xenograft tumor cells were isolated from three mice from two independent experiments. All luciferase readings were normalized to total protein. All luciferase activity experiments were done in triplicate and repeated at least twice. Error bars represent standard deviation.
Xenograft tumors were isolated and exposed to aminoglycosides for two rounds of inductions ex vivo. Luciferase expression showed similar levels of induction, with an average fold induction of 118 and 58.5 for G418 and gentamicin, respectively (Figure 3d). The ability to regulate expression with this system ex vivo, especially after the cells have gone through multiple rounds of induction in vivo, demonstrated the stability and effectiveness of this regulatory strategy.
The inducible system was also examined with the U87MG xenograft model. NOD-scid IL2Rgammanull mice were injected subcutaneously with transduced U87MG cells harboring the wild-type or mutant hGLuc provirus. After 5 weeks, the system was “switched-on” for 4 days, “Off” for 3 days, and “On” again for 2 days. At the peak of the first induction, on day 4, bioluminescence imaging of the mice was monitored to detect the induction of luciferase expression (Figure 4a). The data were consistent with results collected from the HEK293 xenograft experiments, in which wild-type expressions and tumor size were not significantly hampered by the G418 exposure (Figure 4b,c), furthermore, mutant luciferase expression was effectively regulated through multiple cycles of “On” and “Off” response by the inducer molecule.
Figure 4.

Regulation of hGLuc in U87MG xenograft model. (a) Noninvasive bioluminescence imaging of G418 induced luciferase expression from subcutaneously (s.c.) implanted U87MG xenograft mice on day 4. Control and mutant represent NOD-scid IL2Rgammanull (NSG) mice injected s.c. with transduced U87MG cells harboring the mutant hGLuc construct exposed to phosphate buffered saline and G418, respectively. Wild type (WT) represents NSG mice injected s.c. with transduced U87MG cells harboring the wild-type hGLuc construct exposed to G418. (b,c) The “On” and “Off” regulation of hGLuc expression in a U87MG xenograft model. Luciferase activities were measured in relative light units (RLU) from blood serum. The graph is represented in RLU/mm3 by correlating the luciferase activity to tumor size. The “ON” and “OFF” arrows on the x-axis indicate when the G418 drug was administered and discontinued, respectively. Blood was collected and tumor size was measured, as described in the Material and Method section, prior to every injection of G418. Experiments were repeated twice and each time involved the use of at least three mice per experimental group. All luciferase activity readings from blood serum were done in triplicate.
Regulation of gene expression by a less toxic novel aminoglycoside (NB54)
In mammals, a major limitation in the usage of aminoglycosides for long-term exposure is the toxicity to renal, vestibular, and auditory systems. A novel aminoglycoside, NB54, was recently synthesized and found to be 4.7- and 2.4-fold less toxic in vitro15 and 3.6- and 8-fold less toxic in vivo than G418 and gentamicin, respectively.16,17 The potencies of NB54 and its precursor molecule, paromomycin, were assessed in the in vitro regulatory systems. Although both NB54 and paromomycin induced protein expression in HEK293 and HeLa cells, the induction by NB54 was 3–5.2-fold higher than paromomycin (Figure 5a). Next, NB54 was evaluated in comparison to G418 in the HEK293 xenograft model. Bioluminescence imaging was taken on day 4 (Figure 5b) and the changes in luciferase expression were continuously monitored by measuring luciferase activity in blood serum (Figure 5c). NB54 displayed a 448-fold induction relative to untreated, which was comparable to the 590-fold induction achieved with G418 (Figure 5c). Gene expression was “switched-off” in approximately a week for both G418 and NB54 (Figure 5c). Growth of the tumors was not hampered by the exposure to the aminoglycosides (data not shown). However, toward the end of the induction cycle, the mice administered with G418 showed signs of emaciation while NB54 exposed mice were still well-conditioned (data not shown).
Figure 5.
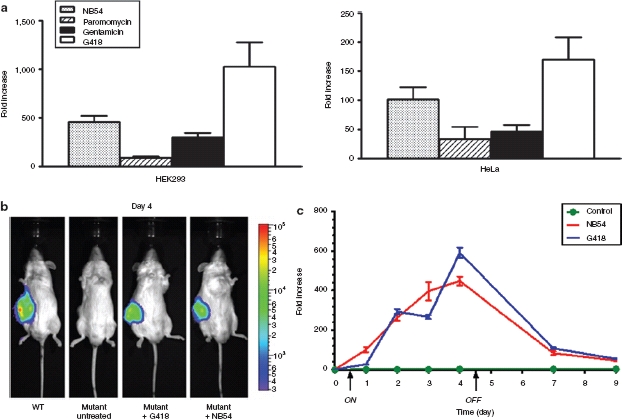
In vitro and in vivo regulation of hGLuc expression with the less toxic novel aminoglycoside NB54 (a) Fold induction of luciferase expression by various aminoglycosides in HEK293 and HeLa cells transduced with the HIV-2 lentiviral vector harboring the mutant hGLuc construct. 1 × 10⁴ cells seeded in 96-well plates were exposed to NB54 (1.0 mg/ml), paromomycin (1.0 mg/ml), gentamicin (1.0 mg/ml), and G418 (0.25 mg/ml) for 48 hours before total samples from cultured media were assayed for luciferase activity. Data was represented as fold induction relative to untreated cells. All luciferase activity experiments were done in triplicate and repeated at least twice. (b) Noninvasive bioluminescence imaging of G418 or NB54 induced luciferase expression from subcutaneously (s.c.) implanted HEK293 xenograft mice on day 4. Control and mutants represent NOD-scid IL2Rgammanull (NSG) mice injected s.c. with transduced HEK293 cells harboring the mutant hGLuc construct exposed to phosphate buffered saline, G418 and NB54, respectively. Wild type (WT) represent NSG mice injected s.c. with transduced HEK293 cells harboring the wild-type hGLuc construct. Experiments were repeated twice and each time involved the use of at least three mice per experimental group. (c) The “On” and “Off” regulation of hGLuc expression in HEK293 xenograft model. Luciferase activity was measured in relative light units (RLU) from blood serum. The graph is represented in fold induction relative to luciferase reading before drug exposure (day 0). The “ON” and “OFF” arrows on the x-axis indicate when the drugs were administered and discontinued, respectively. Blood was collected, as described in the Material and Methods, prior to every injection of G418 and NB54. Luciferase activity experiments from blood serum were done in triplicate. Error bars represent standard deviation.
Impact of different promoters on the regulation of transgene expression in vitro
One of the advantages of this regulated system is that one has the freedom to choose a promoter that is most suited to their application in terms of level of expression and specificity. Therefore, we examined regulation of transgene expression employing various promoters in vitro to study the level of induction and specificity in different cell lines. A variety of cell types were transduced with either the wild-type or mutant hGLuc expressing vector, with luciferase being driven by different internal promoters: cytomegalovirus (CMV), Rous Sarcoma Virus promoter (RSV), human ubiquitin C promoter (UbC), human synapsin 1 gene promoter (hSYN), CMV enhancer SYN hybrid promoter (E/hSYN), or rat Tα1 α-tubulin promoter (Tα1) (Figure 6a). Wild-type luciferase displayed high activities ranging from 103 to 106 RLU. In general, wild-type expression was comparable between the different cell lines, with the exception of two promoters, RSV and CMV, where luciferase expression varied by one to two logs among cell types (Figure 6b). Regulation of the mutant luciferase expression was comparable among the different promoters in HEK293 cells when induced for 48 hours with G418 and gentamicin (Figure 6c). In U87MG cells, inductions were the highest for CMV and E/hSYN promoters with fold expression of 1242 and 1897, respectively, when treated with G418 and a log less when induced with gentamicin (Figure 6d). In PC12 cells, a rat neuronal cell model, the E/hSYN promoter yielded the highest expression, at 502-fold with G418 and 143-fold with gentamicin (Figure 6e). Overall, the UbC promoter yielded the lowest induction in all three cell types (Figure 6c–e). When mutant and wild-type expressions were correlated, the highest percentages of induction, 18% and 17.2%, were obtained with the E/hSYN promoter in U87MG and PC12 cells, respectively (Table 1). It is of interest that different promoters affected the percent readthrough. It should be noted that even at the highest level of wild-type expression the fluorescent reagent was in excess, and the activity was in the linear range (data not shown). A similar finding was previously reported by Xi et al.,18 who described enhanced PTC readthrough when aminoglycosides were used in combination with drugs modifying promoter transcriptional activity. A possible explanation of this effect is discussed below.
Figure 6.

Impact of different promoters on the regulation of hGLuc expression in various cell types (a) Schematic representation of the Tat-independent, self-inactivating HIV-2 lentiviral vector containing the wild-type or mutant hGLuc gene driven by various internal promoters (Pro): cytomegalovirus (CMV), Rous Sarcoma Virus (RSV), human ubiquitin C (UbC), CMV enhancer SYN hybrid (E/hSYN), human synapsin 1 gene (hSYN) and rat α-tubulin (Tα1). (b–e) Luciferase expression in various cell lines infected with the wild-type or mutant hGLuc containing lentiviral vectors, driven by the various internal promoters. Infected cells were subjected to puromycin to obtain mass populations of transduced cells. Then 2.5 × 10⁵ cells were exposed to 150 µg/ml of G418 or 1 mg/ml of gentamicin for 48 hours before luciferase expression was measured. Wild-type was not exposed to aminoglycoside treatment and luciferase activities are represented in relative light units (RLU). Inductions of mutant hGLuc are represented as fold induction relative to untreated cells. Luciferase readings were normalized to total protein. All experiments were done in triplicate and repeated at least twice. Error bars represent standard deviation.
Table 1. Aminoglycosides induced mutant hGLuc expression, correlated to wild-type expression, driven by various promoters in HEK293, U87MG, and PC12 cell lines.

Discussion
As the gene therapy field advances, there will be applications, which will necessitate tight control of expression of a therapeutic gene with the ability to turn the transferred gene “On” and “Off”. For this to be practical, it will typically necessitate that leakiness be kept to a minimum in a mass population of transduced cells precluding the need to select for clonal or oligoclonal populations with negligible background expression. This requirement would be especially important for direct in situ gene delivery. Here, it is demonstrated that using incorporation of PTC into genes coupled with activation by nonsense suppression, leakiness can be reduced to extremely low levels, yet it is possible using an activator such as NB54 to boost the level of expression close to 500-fold in human cells in vivo. In addition, once a suitable allele under control of a promoter of choice has been constructed and tested for efficacy, gene transduction is simplified since only the gene of interest needs to be transferred without necessitating co-transfer of a constitutively expressed transactivator.
Important variables to consider when assessing the suitability of this approach and when implementing the use of this regulated system includes the position and choice of PTCs used within the gene, the inducer molecule, and the choice of promoter. A more detailed discussion of each of these parameters follows.
Position and choice of PTC
In this report PTCs were placed directly within the coding sequence of the genes of interest without appending an exogenous sequence upstream of the genes. As shown in Figure 1, the position and choice of termination codon used affected the degree of leakiness and the level of the achieved gene activation. If the protein of interest is highly toxic then UAA and UAG termination codons are preferred to achieve a tight system, even though the range of activation is not as high compared to UGA (Figure 1). However, expression can be enhanced by using a strong constitutive promoter such as CMV or RSV, unless tighter regulation is required then a tissue-specific promoter can be utilized (Figure 6). On the other hand, if a low level of leakiness can be tolerated in the range of 0.1–0.002% of wild-type expression as indicated in Figure 1, then UGA can be used in parallel with the preferred promoter and a higher level of gene activation can be attained. For instance, with G418 induction in U87MG and PC12 cells, we were able to achieve 18% and 17.2% of wild-type levels when the hybrid promoter, E/hSYN, was used (Table 1).
When deciding upon the placement of the PTCs within a gene, it is very helpful to know as much as possible about the protein one wishes to regulate. For example, it is prudent to place the PTC 5′ to sequences encoding motifs essential for protein activity since positioning 3′ to such sequence could result in the production of a trans-dominant mutant or leaky activity. In addition, one should exclude substitution of a known essential codon with the PTC. Of course, not enough may be known about the protein such that missense decoding of the PTC may lead to replacement of an essential amino acid, so it is important to follow-up with functional analyses.
It is also useful to consider the half-life of the protein being regulated. This is exemplified when comparing fold expression for opal containing alleles of hRLuc (C124X), FLuc (T191X), and hGLuc (C73X) in HEK293 cells treated with G418 at 48 hours. It was found that the induction of the hGLuc allele was 9–15-fold greater than for the hRLuc and FLuc alleles (Figures 1c and 2f). The half-lives in cell culture of hRLuc, FLuc, and hGLuc are 4.5 hours, 3 hours, and 6 days, respectively, indicating that it is a major contributing factor to the observed differences.19,20 Of note, the half-life of hGLuc is reduced to 20 minutes in the circulation in vivo. At least two other factors may influence the greater level of hGLuc induction. First, the sequence context could affect the level of induction. The finding that the cell can distinguish between a PTC and a normal termination codon underpins this entire approach and suggests that the sequence context of the termination codon is quite important. Thus, it would not be surprising if altering the position of the termination codon within the gene can affect the efficiency of readthrough. Second, as discussed in the previous paragraph the missense decoding of the PTC may affect activity. Given all of the above considerations, it is probably best to consider creating multiple PTC containing alleles of the gene of interest when establishing the system.
Inducer molecule
Numerous groups have utilized aminoglycosides, G418 and gentamicin, to rescue and alleviate human genetic diseases involving nonsense mutations in cell culture and murine models.21 In vitro experiments described here consistently showed greater levels of induction with G418 than with gentamicin (Figures 1, 2, 3d and 5a, and Table 1). G418 has yet to be used clinically due to the extensive translation infidelity it induces in mammals caused by its high affinity for the eukaryotic ribosome compared to other aminoglycosides.22 Gentamicin has been used in patients,23,24,25 but long-term exposure and high dosage can lead to nephrotoxicity and ototoxicity. Interestingly, a significant number of drug development programs are endeavoring to discover new molecules that have the potential to induce readthrough without generating high level of toxicity in mammals.26,27 A novel aminoglycoside, NB54, with a dramatically reduced toxicity profile was examined in our system and demonstrated promising induction of gene expression both in vitro and in vivo (Figure 5). In contrast to the tetracycline-, doxycycline- and ecdysone-inducible systems, the regulated system proposed here is not limited to a specific molecule. Hence, the nonsense suppression molecules being evaluated by others could be readily utilized in this post-transcriptionally regulated system, including molecules, such as negamycin—a dipeptide antibiotic,28,29 aminoglycoside analogues,15,16 and non-aminoglycosides.30
The best level of expression obtained relative to the wild-type gene was 18% (Table 1). It is anticipated that as other small molecule activators become available that this will increase. However, for many applications this level of readthrough or even less may be sufficient for therapeutic benefit, especially when one considers that the promoter employed in this system can be significantly stronger than the autologous promoter of the subject gene, so it might be possible to attain levels of expression comparable to normal levels of cellular expression.
Since this system is reliant upon chemically regulating the efficiency of readthrough, as new inducers become available, it should ultimately be possible to attain a rheostat response by using a cocktail of small molecules at various concentrations. This could allow expanding the range of regulated expression while allowing precise fine-tuning of expression. As new inducers become available, important considerations will include the toxicity and pharmacokinetic profiles. One would clearly endeavor to use the least toxic inducers and to understand before their use what type of drug interactions may arise if one is using more than one inducer simultaneously. It will also be helpful to consider the half-life of the inducers and their tissue distribution, such as, whether they pass the blood-brain barrier in cases where regulation is required in the central nervous system.
Choice of promoter
As indicated earlier, one of the strengths of the system is that one can choose the promoter to be employed in the system. In addition to using a strong promoter to increase the level of expression, it is also possible to employ a tissue specific promoter, which might lead not only to greater levels of expression in the cell type being targeted but also to lower levels of expression in cell types that are targeted inadvertently.
One surprising finding was that the promoter utilized affected the percent readthrough (Figure 6 and Table 1). At least one possible reason for this is that different promoters might cause different alterations of the messenger ribonuclear protein complexes. There is accumulating evidence that eukaryotic transcription and translation are not insulated from each other. It was recently published by Harel-Sharvit et al. that the RNA Pol II subunits Rpb4 and Rpb7 form a heterodimer that “interacts physically and functionally with components of the translation initiation factor 3, and is required for efficient translation initiation” mechanistically coupling translation to transcription.31 Harel-Sharvit et al. presented a model in which Rpb 4/7 becomes associated with the messenger ribonuclear protein complex during transcription and “remains associated with the transcript throughout its life”. In a companion “Leading Edge Preview”, Preker and Jensen referred to the mechanism as an example of “transcription-coupled imprinting of mRNAs.”32 Perhaps even more relevant to the findings here is the report of Rother and Strasser.33 They found that Ctk1, which phosphorylates Ser 2 on the C-terminal domain of RNA Pol II and is essential for transcriptional elongation, is also associated with translating polysomes enhancing translation efficiency and fidelity. Rother and Strasser posed that Ctk1 associates with the messenger ribonuclear protein complex during its genesis, in similar fashion to the model of Harel-Sharvit et al.31 Of particular interest to our findings, depletion of Ctk1 promotes readthrough of termination codons. Therefore, it is not unreasonable to envision that different promoters can alter the components of nascent messenger ribonuclear protein complexes, which then exhibit differential effects upon translation. In any event, in cases where the level of readthrough is too low, a practical consideration is altering the promoter driving expression.
In summary, the system yielded a low background and good levels of induction in the context of gene transduction with an HIV-2 derived lentiviral vector. The approach allows flexibility in control of gene expression and only requires transduction of the PTC containing allele. Moreover, once the groundwork is established, then the system, with no additional modifications, can be easily and efficiently used in vitro or in vivo concurrently with newly discovered small molecule inducers as demonstrated in this report. It is anticipated that with further improvements in the system concurrent with discovery of more and effective inducer molecules, this approach has the potential to be utilized in clinical gene therapy applications requiring regulation of transgene expression.
Materials and Methods
Cell culture and reagents. HEK293, HEK293T, HeLa, U87MG, and PC12 cells were obtained from American Type Culture Collection. HEK293, HEK293T, HeLa, and U87MG cells were cultured in minimal essential medium with GlutaMAX (Invitrogen, Carlsbad, CA) supplemented with 10% fetal bovine serum (Hyclone, Logan, UT), and 0.2 mmol/l minimal essential medium nonessential amino acid solution (Invitrogen). PC12 cells were cultured in D-MEM with GlutaMAX (Invitrogen) supplemented with 5% fetal bovine serum (Hyclone) and 10% heat-inactivated horse serum (Invitrogen). All the cells were maintained at 37 °C, 5% CO2 incubators. Zeocin (Invitrogen) and puromycin (Sigma-Aldrich, St Louis, MO) were used to select for stable mass populations of cells at a concentration of 50 µg/ml and 1 µg/ml, respectively. Gentamicin solution (Sigma-Aldrich) and Geneticin (G418; Sigma-Aldrich) was used for regulation of the inducible system. NB54 was generously provided by Dr Baasov from Technion-Israel Institute of Technology, Haifa, Israel.
Plasmid construction. The HIV-2-based transducing vectors used in this study were derived from CRU5SINCGW and have been described previously,13 hereafter the CRU5SINW backbone will be referred to as CSW. The synthetic codon optimized Renilla luciferase gene (hRLuc) was amplified from the phRL-null plasmid (Promega, Madison, WI) using PCR and cloned into the pGEM-T Easy Vector by using the pGEM-T Easy Vector Systems (Promega) to make pGEM-hRL. The C124, W156 and W219 nonsense mutations for hRLuc were each generated using the Change-IT Multiple Mutation Site Directed Mutagenesis Kit (USB, Cleveland, OH) with the pGEM-hRL wild-type as template. Then, the wild-type and mutant pGEM-hRL vectors were each digested with SbfI and NotI restriction enzymes and cloned into the CSW-Ci vector, where the internal CMV promoter and intron were already cloned, to generate CSW-CihRL wild-type and mutants. The firefly luciferase (FLuc) gene was amplified from the pGL2-Basic Vector (Promega) and cloned into pcDNA3.1/zeo (Invitrogen) with NheI and NotI enzymes to generate p3.1CFL wild-type construct. The T191: UAA, UAG, and UGA nonsense mutations for FLuc were all generated using the Change-IT Multiple Mutation Sit Directed Mutagenesis Kit with p3.1CFL wild-type as template.
The Gaussia luciferase (hGLuc) gene was obtained from the pCMV-GLuc control plasmid (New England Biolabs, Ipswich, MA). The nonsense mutation at position 73 (C73X) for hGLuc was also generated using the Change-IT Multiple Mutation Sit Directed Mutagenesis Kit with the pCMV-GLuc control plasmid as template. The wild-type and mutant pCMV-GLuc plasmids were first digested with BglII restriction enzyme, blunted followed by digestion with NotI and ligated to the CSW-IP vector, another version of CSW with IRES and puromycin resistance gene already inserted before the WPRE, in order to generate the wild-type and mutant versions of CSW-CGLIP. The RSV promoter was amplified from the pVgRxR plasmid (Invitrogen) and digested with MluI and BglII. The rat Tα1 α-tubulin (Tα1) promoter was amplified from the Tα1-LacZ plasmid (kindly provided by Dr Miller from Hospital for Sick Children, Toronto, Canada) and digested with MluI and BglII. Both RSV and Tα1 promoters were then cloned into the wild-type and mutant versions of pCMV-GLuc where the CMV promoter was removed using MluI and BamHI enzymes in order to generate wild-type and mutant versions of pRSV-GL and pTα1-GL constructs. These constructs were then digested with MluI, blunted and then digested with NotI to excise wild-type and mutant versions of RSV-GL and Tα1-GL fragments. They were then ligated to the CSW vector digested with EcoRV and NotI enzymes to generated CSW-RSVGLIP and CSW-Tα1GLIP wild-type and mutant constructs. The UbC promoter was amplified from the pUB/Bsd plasmid (Invitrogen), digested with BamHI and ligated to the wild-type and mutant versions of pCMV-GLuc where the CMV promoter was removed using BglII and BamHI enzymes in order to generate wild-type and mutant versions of pUbC-GL constructs. These constructs were then digested with EcoRV and NotI and ligated to the CSW vector digested with EcoRV and NotI to generated CSW-UbCGLIP wild-type and mutant constructs. The human synapsin 1 gene (hSYN) promoter was PCR amplified from the pxCx-Syn1-WPRE plasmid (kindly provided by Dr Uney from University of Bristol, Bristol, UK), digested with AscI, blunted and further digested with BglII. The hybrid promoter (E/hSYN) was constructed by fusing the CMV enhancer to the hSYN promoter using SOE PCR and then digested with MluI and BglII enzymes. The digested hSYN and hybrid E/hSYN promoters were ligated to the wild-type and mutant versions of pCMV-GLuc where the CMV promoter was removed using MluI and BamHI in order to generate wild-type and mutant versions of phSYN-GL and pE/hSYN-GL. These constructs were then digested with MluI, blunted and then digested with NotI to excise wild-type and mutant versions of hSYN-GL and E/hSYN-GL fragments. They were then ligated to the CSW vector and digested with EcoRV and NotI to generated CSW-hSYNGLIP and CSW- E/hSYNGLIP wild-type and mutant constructs.
The following primers were used in PCR amplification or Sit Directed Mutagenesis: hRL Fwd (5′-GCC TGC AGG ATC GAT GCC ACC ATG ACT TCG AAA GTT TAT GAT CCA G -3′) and hRL Rev (5′-C GGG ATC CGC GGC CGC TTA TTG TTC ATT TTT GAG AAC TCG-3′); hRL C124 (5′-GTG GGC CAC GAC TGG GGG GCT TGA CTG GCC TTT CAC TAC TCC-3′); hRL W156 (5′-ATT GAA TCA TGG GAT GAA TGA CCT GAT ATT GAA GAA GAT-3′); hRL W219 (5′-CGT CGT CCA ACA TTA TCA TGA CCT CGT GAA ATC CCG TTA-3′); FL Fwd (5′- GCT GGC TAG CCC TGC AGG GCC ACC ATG GAA GAC GCC AAA AAC ATA AAG -3′) and FL Rev (5′- GTG GAT CCG CGG CCG CTT ACT TAC AAT TTG GAC TTT CCG CCC TTC -3′); FL T191 UAA (5′- TCC TTT GAT CGT GAC AAA TAA CTT GCA CTG ATA ATG AAT-3′); FL T191 UAG (5′- TCC TTT GAT CGT GAC AAA TAG CTT GCA CTG ATA ATG AAT-3′); FL T191 UGA (5′- TCC TTT GAT CGT GAC AAA TGA CTT GCA CTG ATA ATG AAT-3′); hGL C73 (5′GCT GGC TGC ACC AGG GGC TGA CTG ATC TGC CTG TCC CAC3′); RSV Fwd (5′- TCC CCT CGA GTC GCG AAC GCG TAT CTG AGG GGA CTA GGG TGT GTT TAG GC -3′) and RSV Rev (5′- CTA AGA TCT GCT AGC GTT AAC GTA CCC AGC TTG GAG GTG CAC TCC AAT G -3′); Tα1 Fwd (5′- TCC CTC GCG AAC GCG TGT ATC CAG ACT CAC TCC TTT CTC CTT AC -3′) and Tα1 Rev (5′- GAT ATC AGA TCT GTT AAC GGT TGC TGC TTC GCG GCT GCC GGG TGG ATG -3′); UbC Fwd (5′- CGG GAT CCG ATA TCG CTA GCT CGA GAT CGG GAG ATC TGG CCT-3′) and UbC Rev (5′- CGG GAT CCG ATG ATT AAT TGT CAA CAC GGT CCG GTC TAA CAA-3′); CMV enhancer Fwd (5′- CAA TTG CAT GAA GAA TCT GCT TAG GGT TAG GCG TTT TGC G-3′) and CMV enhancer Rev (5′- CTC TGC AGG CGC GCC CCA TGG TAA TAG CGA TGA CTA ATA CG -3′).
Virus production and infection. Vector virus was produced using a three-plasmid calcium phosphate precipitation transfection method. Twenty-four hours after plating, HEK293T cells (2.5 × 10⁶/100 mm diameter dish) were co-transfected with 5 µg of each of the appropriate plasmids: HIV-2-based transducing vector, HIV2CGP13 and VSV-G envelope plasmid (pMD2.G; Addgene, Cambridge, MA). Viral supernatant was collected 72 hours post-transfection, filtered through a 0.45 µm filter, and concentrated by ultracentrifugation. HEK293, HeLa, U87MG and PC12 cells were infected with viral supernatants plus polybrene (8 µg/ml, Sigma-Aldrich) at a multiplicity of infection of 10. After 72 hours, the cells were exposed to puromycin (1 µg/ml) for selection of stable mass populations.
In vitro reporter assay. Puromycin-selected mass population of infected cells were seeded into six-well plates (2.5 × 10⁵ per well). After 24 hours, cells were exposed to various concentrations of G418 and gentamicin for 48 hours. Cells are then lysed with Passive Lysis Buffer (Promega) and total proteins were quantified by the Bradford method (Protein assay dye; Bio-Rad, Hercules, CA). Fifty micrograms of total protein lysate was assayed for luciferase activity according to the manufacture's protocol. Renilla Luciferase Assay System (Promega,) and Luciferase Assay System (Promega) were used for Renilla and firefly luciferase, respectively. BioLux Gaussia Luciferase Assay Kit (New England Biolabs) was used for Gaussia luciferase.
Animal experiment procedures. All animal experimental protocols were approved by the institutional IACUC and conducted in accordance with the National Research Council's Guide for the Care and Use of Laboratory Animals. Puromycin-selected mass populations of infected HEK293 or U87MG (1 × 10⁶) cells resuspended in 50 µl phosphate buffered saline (PBS) and 50 µl of Growth Factor Reduced BD Matrigel Matrix (BD Biosciences, Franklin Lakes, NJ) were injected subcutaneously into NOD scid-γ (NOD-scid IL2Rgammanull; The Jackson Laboratory, Bar Harbor, ME) mice (6–8 weeks of age). When the tumor reached palpable size, blood was collected using the submandibular bleeding method. Fifty microliters of blood mixed with 1 µl of 50 mmol/l EDTA was centrifuged and 5 µl of serum was used to measure hGLuc activity. Tumor growth was measured using a digital caliper, and tumor size was calculated using the equation: volume = 0.5 length × width2. Mice were killed when the tumor exceeded 1.5 cm or when the tumors became necrotic. For the induction of the system in vivo, G418 (60 mg/kg)5 or NB54 (160 mg/kg) in phosphate buffered saline was injected intraperitoneally into the xenografted mice daily.
In vivo imaging. Before imaging, mice were anesthetized with isoflurane and injected intraperitoneally with 200 µl (30 µg/mouse; per manufacturer's recommendation) XenoLight RediJect Coelenterazine h (Caliper Life Sciences, Hopkinton, MA). Bioluminescent images were taken using the Xenogen IVIS 200 Series Imaging System. Data acquisition and analysis were performed using Living Image v2.5 software.
Isolation of xenograft cells. The xenograft tumor (0.1–0.2 g) was placed into a cell culture dish containing 10 ml culture medium (isolation medium). Tissues were cut into small pieces (about 0.2 × 0.2 mm size) sterilely. Five milliliters isolation medium and 5 ml fresh culture medium were mixed in a 50 ml conical tube. Tissue pieces were transferred into the tube and vortexed for 5 seconds. Cell mixture was then passed through 100 µm size strainer and transferred to a new 100 mm culture dish and incubated overnight at 37 °C and 5% CO2. Medium was changed the next day and if necessary cells were split.
Acknowledgments
We sincerely thank Malvika Kaul for reviewing the manuscript. This work was supported by grant R01AI081307 (to J.P.D.) from the National Institutes of Health and by grant 2006/301 (to T.B.) from the US-Israel Binational Science Foundation.
REFERENCES
- Brinster RL, Chen HY, Warren R, Sarthy A., and, Palmiter RD. Regulation of metallothionein–thymidine kinase fusion plasmids injected into mouse eggs. Nature. 1982;296:39–42. doi: 10.1038/296039a0. [DOI] [PubMed] [Google Scholar]
- Gossen M., and, Bujard H. Tight control of gene expression in mammalian cells by tetracycline-responsive promoters. Proc Natl Acad Sci USA. 1992;89:5547–5551. doi: 10.1073/pnas.89.12.5547. [DOI] [PMC free article] [PubMed] [Google Scholar]
- Christopherson KS, Mark MR, Bajaj V., and, Godowski PJ. Ecdysteroid-dependent regulation of genes in mammalian cells by a Drosophila ecdysone receptor and chimeric transactivators. Proc Natl Acad Sci USA. 1992;89:6314–6318. doi: 10.1073/pnas.89.14.6314. [DOI] [PMC free article] [PubMed] [Google Scholar]
- Rivera VM, Clackson T, Natesan S, Pollock R, Amara JF, Keenan T.et al. (1996A humanized system for pharmacologic control of gene expression Nat Med 21028–1032. [DOI] [PubMed] [Google Scholar]
- Murphy GJ, Mostoslavsky G, Kotton DN., and, Mulligan RC. Exogenous control of mammalian gene expression via modulation of translational termination. Nat Med. 2006;12:1093–1099. doi: 10.1038/nm1376. [DOI] [PubMed] [Google Scholar]
- Harrell L, Melcher U., and, Atkins JF. Predominance of six different hexanucleotide recoding signals 3' of read-through stop codons. Nucleic Acids Res. 2002;30:2011–2017. doi: 10.1093/nar/30.9.2011. [DOI] [PMC free article] [PubMed] [Google Scholar]
- Nilsson M., and, Rydén-Aulin M. Glutamine is incorporated at the nonsense codons UAG and UAA in a suppressor-free Escherichia coli strain. Biochim Biophys Acta. 2003;1627:1–6. doi: 10.1016/s0167-4781(03)00050-2. [DOI] [PubMed] [Google Scholar]
- Feng YX, Copeland TD, Oroszlan S, Rein A, Levin JG. Identification of amino acids inserted during suppression of UAA and UGA termination codons at the gag-pol junction of Moloney murine leukemia virus. Proc Natl Acad Sci USA. 1990;87:8860–8863. doi: 10.1073/pnas.87.22.8860. [DOI] [PMC free article] [PubMed] [Google Scholar]
- Urban C, Zerfass K, Fingerhut C., and, Beier H. UGA suppression by tRNACmCATrp occurs in diverse virus RNAs due to a limited influence of the codon context. Nucleic Acids Res. 1996;24:3424–3430. doi: 10.1093/nar/24.17.3424. [DOI] [PMC free article] [PubMed] [Google Scholar]
- Zerfass K., and, Beier H. The leaky UGA termination codon of tobacco rattle virus RNA is suppressed by tobacco chloroplast and cytoplasmic tRNAs(Trp) with CmCA anticodon. EMBO J. 1992;11:4167–4173. doi: 10.1002/j.1460-2075.1992.tb05510.x. [DOI] [PMC free article] [PubMed] [Google Scholar]
- Welch EM, Barton ER, Zhuo J, Tomizawa Y, Friesen WJ, Trifillis P.et al. (2007PTC124 targets genetic disorders caused by nonsense mutations Nature 44787–91. [DOI] [PubMed] [Google Scholar]
- Howard MT, Shirts BH, Petros LM, Flanigan KM, Gesteland RF., and, Atkins JF. Sequence specificity of aminoglycoside-induced stop condon readthrough: potential implications for treatment of Duchenne muscular dystrophy. Ann Neurol. 2000;48:164–169. [PubMed] [Google Scholar]
- Mukherjee S, Lee HL, Pacchia AL, Ron Y., and, Dougherty JP. A HIV-2-based self-inactivating vector for enhanced gene transduction. J Biotechnol. 2007;127:745–757. doi: 10.1016/j.jbiotec.2006.08.004. [DOI] [PubMed] [Google Scholar]
- Tannous BA, Kim DE, Fernandez JL, Weissleder R., and, Breakefield XO. Codon-optimized Gaussia luciferase cDNA for mammalian gene expression in culture and in vivo. Mol Ther. 2005;11:435–443. doi: 10.1016/j.ymthe.2004.10.016. [DOI] [PubMed] [Google Scholar]
- Nudelman I, Glikin D, Smolkin B, Hainrichson M, Belakhov V., and, Baasov T. Repairing faulty genes by aminoglycosides: development of new derivatives of geneticin (G418) with enhanced suppression of diseases-causing nonsense mutations. Bioorg Med Chem. 2010;18:3735–3746. doi: 10.1016/j.bmc.2010.03.060. [DOI] [PubMed] [Google Scholar]
- Nudelman I, Rebibo-Sabbah A, Cherniavsky M, Belakhov V, Hainrichson M, Chen F.et al. (2009Development of novel aminoglycoside (NB54) with reduced toxicity and enhanced suppression of disease-causing premature stop mutations J Med Chem 522836–2845. [DOI] [PMC free article] [PubMed] [Google Scholar]
- Sangkuhl K, Schulz A, Römpler H, Yun J, Wess J., and, Schöneberg T. Aminoglycoside-mediated rescue of a disease-causing nonsense mutation in the V2 vasopressin receptor gene in vitro and in vivo. Hum Mol Genet. 2004;13:893–903. doi: 10.1093/hmg/ddh105. [DOI] [PubMed] [Google Scholar]
- Xi B, Guan F., and, Lawrence DS. Enhanced production of functional proteins from defective genes. J Am Chem Soc. 2004;126:5660–5661. doi: 10.1021/ja0318939. [DOI] [PubMed] [Google Scholar]
- Thorne N, Inglese J., and, Auld DS. Illuminating insights into firefly luciferase and other bioluminescent reporters used in chemical biology. Chem Biol. 2010;17:646–657. doi: 10.1016/j.chembiol.2010.05.012. [DOI] [PMC free article] [PubMed] [Google Scholar]
- Tannous BA. Gaussia luciferase reporter assay for monitoring biological processes in culture and in vivo. Nat Protoc. 2009;4:582–591. doi: 10.1038/nprot.2009.28. [DOI] [PMC free article] [PubMed] [Google Scholar]
- Zingman LV, Park S, Olson TM, Alekseev AE., and, Terzic A. Aminoglycoside-induced translational read-through in disease: overcoming nonsense mutations by pharmacogenetic therapy. Clin Pharmacol Ther. 2007;81:99–103. doi: 10.1038/sj.clpt.6100012. [DOI] [PubMed] [Google Scholar]
- Bar-Nun S, Shneyour Y., and, Beckmann JS. G-418, an elongation inhibitor of 80 S ribosomes. Biochim Biophys Acta. 1983;741:123–127. doi: 10.1016/0167-4781(83)90018-0. [DOI] [PubMed] [Google Scholar]
- James PD, Raut S, Rivard GE, Poon MC, Warner M, McKenna S.et al. (2005Aminoglycoside suppression of nonsense mutations in severe hemophilia Blood 1063043–3048. [DOI] [PubMed] [Google Scholar]
- Malik V, Rodino-Klapac LR, Viollet L, Wall C, King W, Al-Dahhak R.et al. (2010Gentamicin-induced readthrough of stop codons in Duchenne muscular dystrophy Ann Neurol 67771–780. [DOI] [PubMed] [Google Scholar]
- Wilschanski M, Yahav Y, Yaacov Y, Blau H, Bentur L, Rivlin J.et al. (2003Gentamicin-induced correction of CFTR function in patients with cystic fibrosis and CFTR stop mutations N Engl J Med 3491433–1441. [DOI] [PubMed] [Google Scholar]
- Hainrichson M, Nudelman I., and, Baasov T. Designer aminoglycosides: the race to develop improved antibiotics and compounds for the treatment of human genetic diseases. Org Biomol Chem. 2008;6:227–239. doi: 10.1039/b712690p. [DOI] [PubMed] [Google Scholar]
- Peltz SW, Welch EM, Trotta CR, Davis T., and, Jacobson A. Targeting post-transcriptional control for drug discovery. RNA Biol. 2009;6:329–334. doi: 10.4161/rna.6.3.8953. [DOI] [PubMed] [Google Scholar]
- Allamand V, Bidou L, Arakawa M, Floquet C, Shiozuka M, Paturneau-Jouas M.et al. (2008Drug-induced readthrough of premature stop codons leads to the stabilization of laminin alpha2 chain mRNA in CMD myotubes J Gene Med 10217–224. [DOI] [PubMed] [Google Scholar]
- Arakawa M, Shiozuka M, Nakayama Y, Hara T, Hamada M, Kondo S.et al. (2003Negamycin restores dystrophin expression in skeletal and cardiac muscles of mdx mice J Biochem 134751–758. [DOI] [PubMed] [Google Scholar]
- Du L, Damoiseaux R, Nahas S, Gao K, Hu H, Pollard JM.et al. (2009Nonaminoglycoside compounds induce readthrough of nonsense mutations J Exp Med 2062285–2297. [DOI] [PMC free article] [PubMed] [Google Scholar]
- Harel-Sharvit L, Eldad N, Haimovich G, Barkai O, Duek L., and, Choder M. RNA polymerase II subunits link transcription and mRNA decay to translation. Cell. 2010;143:552–563. doi: 10.1016/j.cell.2010.10.033. [DOI] [PubMed] [Google Scholar]
- Preker P., and, Jensen TH. Translation by remote control. Cell. 2010;143:501–502. doi: 10.1016/j.cell.2010.10.039. [DOI] [PubMed] [Google Scholar]
- Röther S., and, Strässer K. The RNA polymerase II CTD kinase Ctk1 functions in translation elongation. Genes Dev. 2007;21:1409–1421. doi: 10.1101/gad.428407. [DOI] [PMC free article] [PubMed] [Google Scholar]