Abstract
Elevated intracellular calcium generates rapid, profound, and irreversible changes in the nucleotide metabolism of human red blood cells (RBCs), triggered by the adenosine triphosphatase (ATPase) activity of the powerful plasma membrane calcium pump (PMCA). In the absence of glycolytic substrates, Ca2+-induced nucleotide changes are thought to be determined by the interaction between PMCA ATPase, adenylate kinase, and AMP-deaminase enzymes, but the extent to which this three-enzyme system can account for the Ca2+-induced effects has not been investigated in detail before. Such a study requires the formulation of a model incorporating the known kinetics of the three-enzyme system and a direct comparison between its predictions and precise measurements of the Ca2+-induced nucleotide changes, a precision not available from earlier studies. Using state-of-the-art high-performance liquid chromatography, we measured the changes in the RBC contents of ATP, ADP, AMP, and IMP during the first 35 min after ionophore-induced pump-saturating Ca2+ loads in the absence of glycolytic substrates. Comparison between measured and model-predicted changes revealed that for good fits it was necessary to assume mean ATPase Vmax values much higher than those ever measured by PMCA-mediated Ca2+ extrusion. These results suggest that the local nucleotide concentrations generated by ATPase activity at the inner membrane surface differed substantially from those measured in bulk cell extracts, supporting previous evidence for the existence of a submembrane microdomain with a distinct nucleotide metabolism.
INTRODUCTION
Elevated intracellular [Ca2+]i in human red blood cells (RBCs) causes ATP depletion by the irreversible conversion of adenine nucleotides to IMP (Lew, 1971; Almaraz et al., 1988; Almaraz and García-Sancho, 1989). The extent and kinetics of ATP depletion depend on the magnitude and duration of the [Ca2+]i increase, the absence or presence of metabolic substrates, and on a multiplicity of other factors (Lew, 1971; Arese et al., 1981; Till et al., 1981; Almaraz et al., 1988; Dagher and Lew, 1988; Almaraz and García-Sancho, 1989). ATP depletion is triggered by the ATPase activity of the plasma membrane calcium pump (PMCA; Schatzmann, 1966; Adunyah et al., 1982; Schatzmann, 1983; Kosk-Kosicka and Bzdega, 1988; Carafoli, 1992; Reusch et al., 1997); inhibition of the pump by vanadate prevents ATP depletion and IMP formation (Tiffert and Lew, 2001). Also, rapid calcium extraction by the addition of a calcium chelator to a suspension of Ca2+-loaded cells in the presence of ionophore instantly reverts the rate of ATP fall to that of precalcium load levels (Dagher and Lew, 1988). With the application of properly combined ionophore and Ca2+ concentrations in the medium, Ca2+ influx can be set so high that it overcomes the Ca2+ extrusion capacity of all RBCs in any given sample, thus loading the cells uniformly with pump-saturating [Ca2+]i levels at an ionophore-determined equilibrium defined by [Ca2+]i/[Ca2+]o = ([H+]i/[H+]o)2 (Ferreira and Lew, 1976; Pressman, 1976; Dagher and Lew, 1988; Lew and García-Sancho, 1989). Ionophore-mediated Ca2+ transport can be instantly blocked by the addition of cobalt in excess of Ca2+ in the medium, allowing the mean rate of pump-mediated Ca2+ extrusion to be directly measured (Dagher and Lew, 1988). The mean Ca2+ extrusion Vmax of the PMCA was found to be highly variable, generally within the range of 8 to 20 mmol per liter of packed red cells per hour (mmol/Lch). Applying the cobalt method in combination with special experimental designs, it was shown that RBCs from single donors differed by over an order of magnitude in PMCA Vmax activity (Lew et al., 2003). The coefficient of variation in Vmax among cells from a single donor was ∼50%, largely caused by an age-related decline in pump activity by unknown mechanisms (García-Sancho and Lew, 1988; Romero and Romero, 1997, 1999; Raftos et al., 2001; Lew et al., 2007; Bookchin et al., 2009). Saturated Ca2+ extrusion rates may thus vary from >60 mmol/Lch in young RBCs to <4 mmol/Lch in aged RBCs. With a Ca2+/ATP stoichiometry of 1:1, the age-related Vmax variation applies equally to PMCA-mediated Ca2+ extrusion and Ca2+ ATPase activity.
Besides the PMCA ATPase, the nucleotide changes induced by elevated [Ca2+]i in RBCs are strongly influenced by two other enzymes: the adenylate kinase (AK), which buffers the reduction in ATP levels generated by ATPase activity, and the AMP-deaminase (AMPDA), which catalyzes the irreversible conversion of AMP to IMP. The combined set of reactions mediated by this three-enzyme system is
In human RBCs, AK and AMPDA have maximal activities in the order of 1–2 mol/Lch, over two orders of magnitude higher than the Ca2+ ATPase. Thus, AK activity maintains the distribution of [ATP], [ADP], and [AMP] within RBCs at levels determined by its equilibrium dissociation constant, KAK = [ATP] × [AMP]/[ADP]2 = ∼0.9 (Whittam, 1964). AMPDA, on the other hand, is a highly regulated enzyme, and although its Vmax in RBCs is comparable with that of the AK, its actual activity level is far lower in most conditions, essentially nil in physiological conditions, because of the powerful inhibitory effects of 2,3-diphosphoglyceric acid (DPG), the normal low [Ca2+]i (a powerful stimulator at higher concentrations; Almaraz et al., 1988), and the normal low concentration of its substrate, AMP (Askari, 1966; Askari and Rao, 1968; Almaraz et al., 1988; Almaraz and García-Sancho, 1989). AMPDA is activated by AMP following a sigmoid activation kinetics best fitted with a cubic power function with three hypothetical sites of equal affinity (KAMP = ∼50 µM). 2,3-DPG is the main allosteric inhibitor of AMPDA; ATP competes with 2,3-DPG, relieving this inhibition with sigmoid kinetics. Because in the substrate-free conditions analyzed here, 2,3-DPG remained essentially constant for the brief duration of the experiments (Alvarez et al., 1988), ATP may be effectively described as an allosteric activator of the enzyme. When RBCs undergo rapid ATP depletion in the combined presence of a metabolic substrate and a glycolytic inhibitor (inosine and iodoacetamide, for instance; Lew, 1971), ATP is stoichiometrically converted to IMP, even in the absence of Ca2+ (Lew, 1971; Plagemann et al., 1985). In this condition, although the inhibitory effect of 2,3-DPG persists, the inhibition-relieving effects of ATP, while ATP was declining, proved sufficient to allow AMPDA-mediated IMP formation. Calcium was shown to be a powerful but indirect activator of AMPDA, effective after a small delay, by antagonizing an as yet unidentified endogenous inhibitor (Almaraz and García-Sancho, 1989).
Although ATP depletion and IMP accumulation have been well documented in the past, the precise time course of the Ca2+-induced nucleotide changes and the extent to which the three-enzyme system can account for them remain to be determined. This is the aim of the present study. We investigated the Ca2+-induced changes in ATP, ADP, AMP, and IMP in human RBCs using a state-of-the-art photodiode array detector HPLC system that provides the full absorbance spectrum of each peak, thus allowing its instant identification. The observed nucleotide changes were compared with those predicted by a model incorporating our knowledge of the kinetic behavior of the three-enzyme system. The comparison brought to light unexpected insights on possible dynamic differences between nucleotide concentrations in cell cytoplasm and in submembrane microdomains, supporting earlier proposals by Hoffman and co-workers (Parker and Hoffman, 1967; Proverbio and Hoffman, 1977; Hoffman, 1997; Hoffman et al., 2009).
MATERIALS AND METHODS
Preparation of cells
Venous blood from healthy volunteers was drawn into heparinized syringes after informed written consent. The cells were immediately washed four times by centrifugation (2,000 g for 5 min) and resuspension in ∼5 vol of solution A containing 90 mM KCl, 60 mM NaCl, 10 mM HEPES-Na, pH 7.5 at 37°C, 0.2 mM MgCl2, and 0.1 mM Na-EGTA. The reason for the high K+ concentration in solution A was to prevent significant volume changes in the Ca2+-loaded RBCs after activation of the Ca2+-sensitive K+ channels (Kcnn4, Gardos channels; Gardos, 1958; Ferreira and Lew, 1976; Lew and García-Sancho, 1989; Tiffert et al., 2005); the high K+ concentration in the medium sets the K+ concentration gradient across the RBC membrane very near the equilibrium potential for K+, preventing net KCl and water shifts in the K+-permeabilized cells. After each spin, the supernatant and top cell layer containing white cells and platelets were removed. For nucleotide measurements, the washed cells were suspended at 20% hematocrit in solution A. CaCl2 was added from a concentrated stock to a final concentration of 120 µM in the cell suspension. The suspension was incubated at 37°C with continuous magnetic stirring. At t = 0, the ionophore A23187 was added to this suspension, to a final concentration of 20 µM (to give 100 µmol/liter of cells assuming full partition in the cells; Simonsen and Lew, 1980; Simonsen et al., 1982). Samples for nucleotide measurements by HPLC were taken before and after ionophore addition, at the times indicated in the figures.
Processing of samples for nucleotide measurements
Using plastic-tip dispensers, 0.8-ml samples from the 20% hematocrit cell suspension were delivered deep into a microcentrifuge tube of 1.5-ml nominal capacity containing 0.3 ml of ice-cold 15% perchloric acid (PCA). The sample was mixed by sucking and delivering once or twice and was kept in the ice bath until convenient to spin. After a 2-min spin at 14,000 rpm in a refrigerated microfuge (model 5402; Eppendorf) set at 4°C, the tube was transferred back to the ice bath for further processing at convenient times. 0.8 ml PCA supernatant was transferred to a second ice-cold microfuge tube containing a 40-µl aqueous solution of methyl orange 0.05% (rose color). 100 µl of ice-cold 3 M K2CO3 was then added to neutralize the PCA and mixed over vortex (yellow color), and CO2 was allowed to be released before closing the tube. The tube was centrifuged for 4 min at 14,000 rpm in the refrigerated microfuge and kept on ice. About 0.8 ml perchlorate supernatant was aspirated into a syringe using a thin needle, the needle was exchanged for a 0.2-µm filter (Millipore), the syringe contents were delivered through the filter into a new microfuge tube, and the neutralized, filtered sample was kept frozen until injected into the HPLC chromatography column. To test whether all the nucleotides had been extracted in the supernatant, dried PCA and perchlorate pellets from original cell samples were washed in minimal volumes. The optical densities at 250 nm (inosine peak) and 259 nm (adenine peak) in the wash supernatants were negligible, confirming optimal extraction in the original supernatants.
Calculation of the nucleotide content of cells
The nucleotide content of the cells, in micromoles/liter of cells (µmol/Lc), was estimated from the dilution factors during sample processing, from the recorded area under the chromatographic peaks, and from the slope of the calibration curves obtained as reported for Fig. 2. For an approximate estimate of the concentration of nucleotides in cell water (µmol/Lcw), the mean water content of the cells was assumed to be 0.75 Lcw/Lc (Lew and Bookchin, 1986; Lew et al., 1991). For model experiment comparisons, it is the pattern of nucleotide concentration changes that counts, not the precise value of the nucleotide concentrations, which can vary by as much as 30% in RBC samples from different healthy donors.
Figure 2.
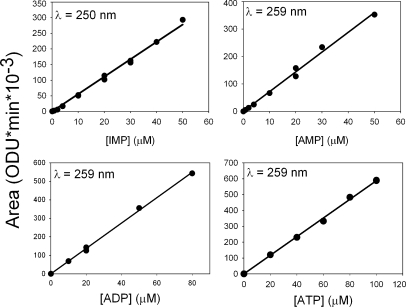
Calibration curves of ATP, ADP, AMP, and IMP. The recorded peak area values (in ODUs × minutes × 10−3) at 259 nm for adenine nucleotides and at 250 nm for IMP are plotted as a function of nucleotide concentrations dissolved in solution A. The range of concentrations covered matched those in the RBC samples. Data are from 13 experiments, like that illustrated in Fig. 1, with different nucleotide additions.
Photodiode array detector HPLC settings
The system used comprised a photodiode array detector (model 990; Waters), a solvent delivery system (model 501; Waters), and an automated gradient controller (model 680; Waters). The eluent from the chromatography column (Partisil SAX Radial-PAK cartridge, 8 mm × 10 cm; Waters) flowed through a quartz cell of 8-µl vol and 10-mm path length, driven by a pressure gradient of 150 psi. Incident white light from a deuterium lamp, transmitted through the flow cell, was focused onto a diffraction grating, separating wavelengths from 190 to 600 nm with 2-nm resolution. The photodiode discharge was proportional to the intensity of the transmitted light. The collective diode recharge currents at each wavelength were converted into light absorption spectra identifying the nucleotide in each detected peak. Operation of the system was fully automated and software controlled, recording absorbance values (in ODU) at set wavelengths (250 and 259 nm), peak areas (in ODU × minutes × 10−3), and absorbance spectra for each peak set between wavelengths of 220 and 300 nm.
The three-enzyme model
Modeling was required to test whether our current understanding of the Ca2+ effects on red cell nucleotide metabolism was sufficient to account for the experimentally observed behavior. The model was designed to optimize comparison between predicted and observed changes in cell ATP, ADP, AMP, and IMP concentrations after Ca2+ loads in the absence of glycolysis. It encodes our current knowledge of the kinetics of the three relevant enzymes and the known effects of Ca2+ on the PMCA ATPase and AMPDA, as briefly reviewed in the Introduction. In the model, the only ATPase activity considered is that mediated by the PMCA. ATPase contributions from the Na pump or other sources were neglected because within the short duration of the present experiments, the measured decline in ATP in Ca2+-free cells was minimal (Dagher and Lew, 1988), Ca2+ loads like those imposed here cause substantial Na pump inhibition (Brown and Lew, 1983), and because in preliminary experiments, ouabain failed to elicit a detectable change in Ca2+-induced ATP decline, even at the saturating external K+ levels for the Na pump applied in these experiments. The model equations and the numerical computations are detailed in the Appendix.
RESULTS
Nucleotide measurements
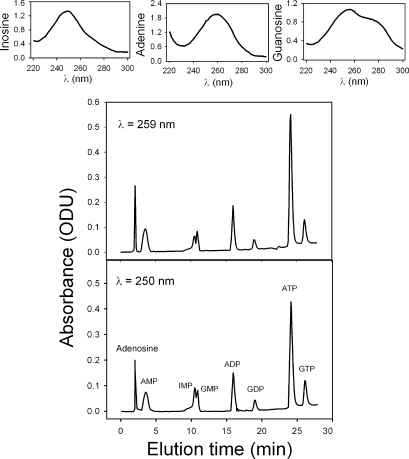
Fig. 1 reports the optical absorbance of nucleotides dissolved in medium A at 250- and 259-nm wavelengths as a function of elution time. The top panel of Fig. 1 shows the typical spectra obtained for each of the three types of nucleotides tested in this run: inosine, adenosine, and guanosine nucleotides.
Figure 1.
Elution times and UV absorption spectra of inosine, adenosine, and guanosine nucleotides in the diode array HPLC system used for the current experiments. The optical absorbance at 250- and 259-nm wavelengths is reported as a function of elution time. The nucleotides were dissolved in medium A, at concentrations within the ranges shown on the x axis of Fig. 2, to match those extracted from the RBC samples. Typical spectra obtained for each of the three types of nucleotides tested in this run are shown at the top of the figure. Results are typical of 13 similar experiments with different nucleotide additions.
Fig. 2 shows the calibration curves derived from the measurements illustrated in Fig. 1 for the four relevant nucleotides in this study. The recorded peak area values at 259 nm for adenine nucleotides and at 250 nm for IMP are plotted as a function of nucleotide concentrations. The range of concentrations covered matched those in the RBC samples, and it can be seen that linear regressions adequately fit the experimental points over such ranges.
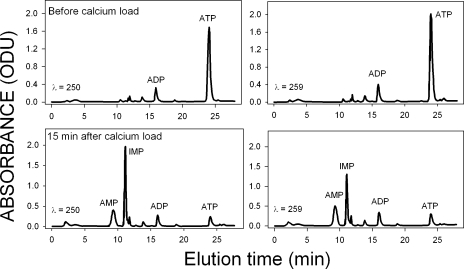
Fig. 3 shows representative chromatograms at 250 nm (left) and 259 nm (right) of nucleotides from RBC samples. Peak identities were determined by elution times and spectral characteristics. The figure illustrates the rapid and dramatic changes induced by Ca2+ loads on cell nucleotides in the absence of metabolic substrates. Before the Ca2+ load (Fig. 3, top), AK-imposed equilibrium is with a distribution following ATP >> ADP >> AMP; the AMP peak was hardly visible on this scale, although with an area clearly detectable above background, and the IMP peak area was near zero in all the samples before Ca2+ loading. 15 min after the onset of the Ca2+ load, much of the ATP had been converted to AMP and IMP, with a slight increase in ADP concentration.
Figure 3.
Nucleotide chromatograms at 250 nm and 259 nm from RBC samples, before and 15 min after a sustained PMCA-saturating calcium load. Left, 250 nm; right, 259 nm; top, before calcium load; bottom, 15 min after calcium load. RBCs were incubated in the absence of metabolic substrates. Results are representative of three identical experiments with blood from two donors.
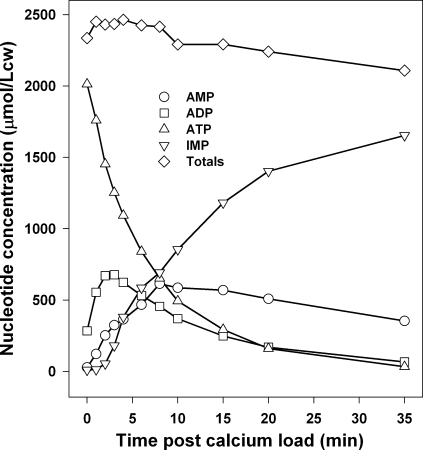
Fig. 4 shows the detailed time course of the Ca2+-induced nucleotide concentration changes in RBCs suspended in substrate-free medium A. This result was typical of three identical experiments with RBCs from two donors. Although the initial ATP concentration varied slightly in the three experiments, the pattern of variation was identical for all three samples and also to that recorded with lower time resolution and precision in earlier work (Arese et al., 1981; Till et al., 1981; Almaraz et al., 1988). It is important to stress that for valid comparisons with model predictions, pattern conservation is the relevant condition, irrespective of the minor differences in initial ATP levels among RBC samples.
Figure 4.
Time course of Ca2+-induced nucleotide concentration changes in RBCs suspended in substrate-free media. Results are representative of three identical experiments with RBCs from two donors containing slightly different initial ATP concentrations (donor 1, 2.01 and 2.11 mmol/Lcw; donor 2, 1.73 mmol/Lcw). The decline in the total nucleotide concentration is attributed to the breakdown of IMP to hypoxanthine at a rate of ∼0.2 mmol/Lch in the present experimental conditions.
It can be seen (Fig. 4) that Ca2+ entry initially caused a rapid fall in ATP, a rapid but limited accumulation of ADP, a slower increase in AMP, and a delayed, large, and progressive accumulation of IMP. Whereas the fall in ATP and the rise in IMP were monotonic throughout, the changes in ADP and AMP were biphasic, slow reductions after the large initial increases.
This general pattern can be interpreted as follows. The sudden Ca2+ load has two major effects: it activates the Ca2+ ATPase to Ca2+-saturating levels and sets the Ca2+-dependent component of AMPDA activity to the [Ca2+]i level applied in these experimental conditions (Almaraz et al., 1988; Almaraz and García-Sancho, 1989). The initial high ATP concentration exerts its maximal antagonistic effect on the inhibition of AMPDA by 2,3-DPG, which remains fairly steady at its normal high physiological level of ∼5 mmol/Lc (Askari and Rao, 1968; Alvarez et al., 1988). However, the low initial AMP concentration keeps the initial AMPDA activity to a minimum. ATPase activity initiates a steep reduction in ATP. In the absence of AK activity, all ATP would be converted to ADP. AK activity sharply limits this conversion and transfers much of the ADP back to ATP and AMP to comply with the instant validity of the AK-imposed equilibrium [ATP] × [AMP]/[ADP]2 = 0.9 throughout the experiment. The resulting increase in AMP concentration activates AMPDA, leading to a slightly delayed increase in IMP concentration. The subsequent time course of the AMP and IMP concentration changes is determined by the opposing effects on AMPDA activity of AMP accumulation (stimulatory) and ATP decline (inhibitory), by the fall in ATP on the activity of the Ca2+ ATPase, and by the instant buffering effects of AK on the adenine nucleotides. It is this complex and delicate balance that requires modeling to understand its mechanism, as its complexity is beyond intuitive grasp.
The three-enzyme model: Search for best-fit parameters
In its simplest formulation, the model interprets the Ca2+-induced nucleotide concentration changes as if taking place in a single cell, equivalent to the condition of a perfectly uniform cell population. We consider first the assumptions required to fit the experimental results for the perfect homogeneity case. The effect of the well-documented age heterogeneity of PMCA Vmax is considered next.
Homogeneity.
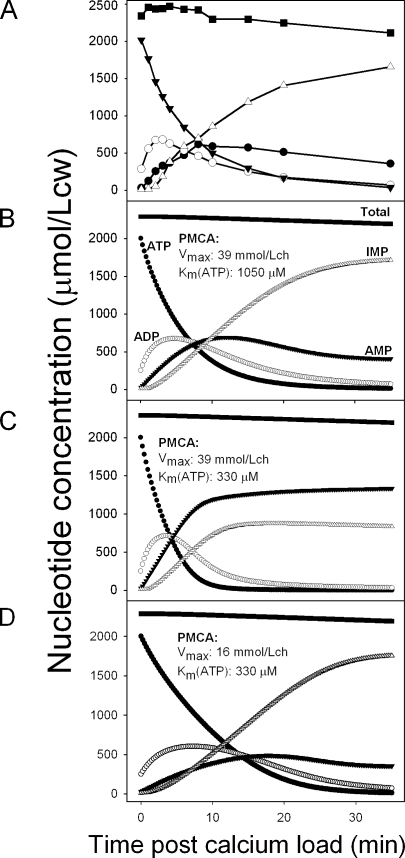
Simulations were systematically performed to explore a wide range of parameter values for the Ca2+ ATPase and AMPDA, within and outside measured ranges (unpublished data). Comparisons between the experimental results and model simulations are shown in Fig. 5. The observed pattern of Ca2+-induced nucleotide changes is reproduced in Fig. 5 A for easy comparison. Only those results with PMCA Km(ATP) and Vmax values close to those in Fig. 5 B approximated the experimentally observed pattern of Ca2+-induced nucleotide variation. No other combination of parameter values of ATPase and AMPDA under AK-controlled equilibrium provided satisfactory fits. Best fits were obtained with a Km(ATP) of the ATPase of >1 mM, at least threefold higher than that measured for the isolated calcium ATPase (Garrahan and Rega, 1978; Mualem and Karlish, 1979; Muallem and Karlish, 1981, 1983; Garrahan et al., 1982), and with a mean ATPase Vmax of ∼40 mmol/Lch, about twice the highest mean Ca2+ extrusion rates measured in intact RBCs (Dagher and Lew, 1988; Lew et al., 2003). Selected misfit examples are shown in Fig. 5 (C and D) to illustrate the effects of different combinations of previously measured (Vmax = ∼16 mmol/Lch and Km(ATP) = ∼0.3 mM) and best-fit parameter values (Vmax = ∼39 mmol/Lch and Km(ATP) = ∼1.05 mM) and to aid in the analysis and interpretation of the results (see Discussion).
Figure 5.
Comparison between patterns of calcium-induced nucleotide changes observed experimentally and predicted by the three-enzyme-model. (A) The experimentally observed pattern shown in Fig. 4 is reproduced to aid direct visual comparisons. (B–D) Selected model-derived patterns using the Ca2+ ATPase Vmax and Km(ATP) parameter values shown in the figures and the default values reported in the Appendix for all the other parameters of the system. The rate of IMP breakdown to hypoxanthine, which is responsible for the decline in total nucleotide concentration, was set at 0.2 mmol/Lch in all simulations. (B) Best-fit parameter values for pattern reproduction. (C) Pattern rendered when using experimentally determined Km(ATP) values at high Vmax. (D) Pattern rendered when using Vmax–Km(ATP) values within measured ranges.
Heterogeneity.
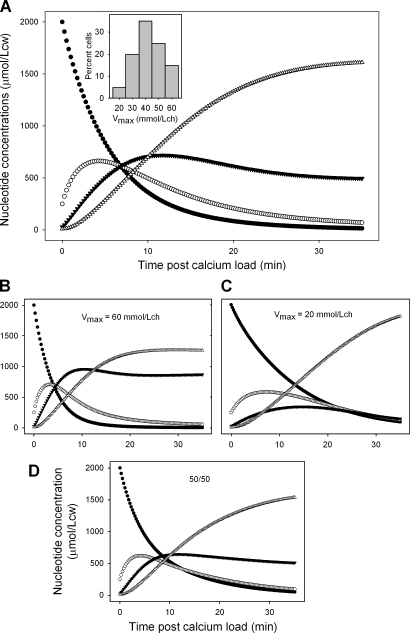
Preliminary simulations exploring distributions of different parameters indicated that the only ones that yielded patterns of nucleotide change approximating the one observed were those in which the single distributed parameter was the Vmax of the PMCA ATPase at a Km(ATP) ≥1 mM (Fig. 6). The Vmax distribution illustrated in Fig. 6 A (inset) follows the slightly skewed pattern that was previously described (Lew et al., 2003). However, the simulations in Fig. 6 (B–D) provide an example of extreme heterogeneity, with one half of the cells having a Vmax of 60 mmol/Lch and the other half having a Vmax of 20 mmol/Lch. It illustrates how very different patterns of nucleotide change in each subpopulation (Fig. 6, B and C) can deliver the observed pattern for the mean (Fig. 6 D) as long as the only parameter varied in the RBC population is the Vmax of the ATPase (at Km(ATP) = 1.0 mM), with the mean Vmax kept at ∼40 mmol/Lch.
Figure 6.
Predicted patterns of mean nucleotide changes in RBCs with distributed values of the Ca2+ ATPase VPmax, at Km(ATP) = 1.05 mM. (A) Mean pattern obtained with the VPmax distribution shown in the inset. (B) Pattern corresponding to a VPmax of 60 mmol/Lch. (C) Pattern corresponding to a VPmax of 20 mmol/Lch. (D) Mean pattern resulting from an equal mix (50/50) of the patterns in B and C. The mean VPmax in both A and D is 40 mmol/Lch. Closed circles, ATP; open circles, ADP; closed triangles, AMP; open triangles, IMP.
The conclusion from the results in Figs. 5 and 6 is that for both homogeneous and heterogeneous conditions, good fits with the three-enzyme model require PMCA Vmax–Km(ATP) values substantially above previously measured ranges for these parameters.
DISCUSSION
The aim of the current investigation was to explore the extent to which the effects of elevated intracellular Ca2+ on the nucleotide metabolism of human RBCs in the absence of glycolysis could be accounted for by a model of the three-enzyme system, which incorporates our current understanding of the mechanism behind these effects. Although the overall pattern of Ca2+-induced nucleotide changes has been described before, the lower precision of the nucleotide-measuring methods used and the lower sampling frequency in the earlier measurements were not adequate for a proper comparison between experimental results and model predictions. The HPLC measurements reported here in Fig. 4 allowed this comparison and also confirmed the general pattern described in earlier work (Arese et al., 1981; Till et al., 1981; Almaraz et al., 1988).
Simulations with the three-enzyme model consistently showed that the experimentally observed time course of nucleotide changes can only be reproduced when using unrealistically high parameters of PMCA function, 1 mM or higher for the Km(ATP) instead of the measured 0.33 mM (Mualem and Karlish, 1979; Muallem and Karlish, 1981; Rega and Garrahan, 1986) and ∼40 mmol/Lch for the mean Ca2+-saturated Vmax of the ATPase instead of measured values from ∼8 to 20 mmol/Lch (Dagher and Lew, 1988). To seek an understanding of how measured parameters fail to explain the data, it is necessary to analyze the model predictions for the activities of the enzymes that determine the time course and magnitude of the nucleotide changes.
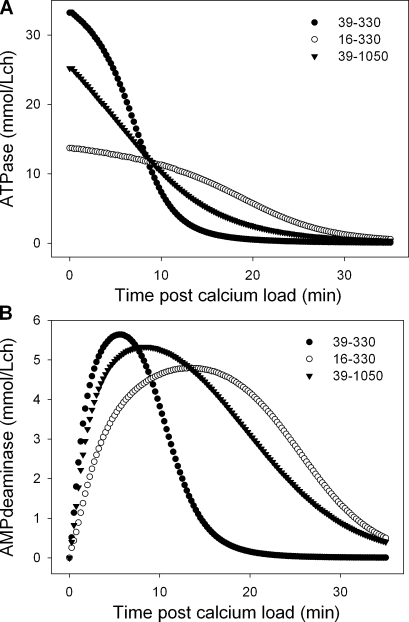
The time course of changes in ATPase and AMPDA activities predicted by the model in the conditions of Fig. 5 (B–D) is shown in Fig. 7. The analysis focuses on the Vmax and Km(ATP) of the Ca2+ ATPase. The Vmax–Km(ATP) pairs corresponding to each of the curves are indicated in the figures. It can be seen that for all parameter combinations, the Ca2+ ATPase activity declines with time (Fig. 7 A), as the ATP concentration falls (Fig. 4), and that the AMPDA activity changes along a biphasic pattern, early stimulation followed by late decline (Fig. 7 B).
Figure 7.
Predicted changes in Ca2+ ATPase and AMPDA activities as a function of time after calcium load for different values of paired Vmax–Km(ATP) parameters. (A) Ca2+ ATPase. (B) AMPDA. The paired Vmax–Km(ATP) values corresponding to each symbol (curve) are indicated in each panel.
Let us consider first the two conditions with an identical Vmax of 39 mmol/Lch and different Km(ATP) values of 0.33 and 1.05 mM. The Km(ATP) influences the initial ATPase activity. At an initial ATP concentration of ∼2 mmol/Lcw and a Km(ATP) of 1.05 mM, the ATPase is only at a 64% saturation level with ATP, setting the initial ATPase activity level at 25 mmol/Lch (Fig. 7 A, triangles). With a Km(ATP) of 0.33 mM, saturation reaches 85%, and initial ATPase activity is 33 mmol/Lch (Fig. 7 A, closed circles). The higher ATPase activity at a Km(ATP) of 0.33 mM causes ATP to fall faster than with a Km(ATP) of 1.05 mM (compare ATP curves in Fig. 5, B and C). Deaminase activity, which is dependent on the inhibition-relieving effect of ATP, declines faster the faster the fall in ATP (Fig. 7 B). The time course and pattern of decline in deaminase activity is also powerfully influenced by the rate of AMP formation, which is in turn controlled by AK and ATPase activities. The combined effects on deaminase activity decline result in reduced IMP formation and a higher accumulation of AMP (Fig. 5 C) relative to the best-fit pattern (Fig. 5 B), yielding patterns of nucleotide change at variance with those observed.
In the simulation with a realistic Vmax–Km(ATP) pair (16–330; Figs. 5 D and 7), the low ATPase activity (Fig. 7 A) causes a more gradual decline in ATP than in the other two conditions (Fig. 5, compare D with B and C), allowing deaminase activity to be sustained for longer (Fig. 7 B) with slower ADP formation, delayed and reduced AMP accumulation, and sustained IMP production relative to the observed pattern, resulting in a striking mismatch with the data.
This analysis shows that fitting the documented pattern of Ca2+-induced nucleotide changes with a model incorporating the known kinetics of the three-enzyme system imposes a restricted choice on the value of the two relevant parameters of PMCA function, well outside the range of experimentally determined values. The conclusion is that, as formulated, the model fails to account for the experimental results. It may be possible that the Km(ATP) of the Ca2+ ATPase in intact RBCs is indeed higher than that measured in isolated membrane preparations or resealed ghosts, but no such doubts can be entertained about the Vmax discrepancy, which was directly measured in intact RBCs (Dagher and Lew, 1988). Is there a way by which an ATPase with realistic Km(ATP)–Vmax values can be interpreted by the model as if operating with the elevated Km(ATP)–Vmax parameter values required for good fits?
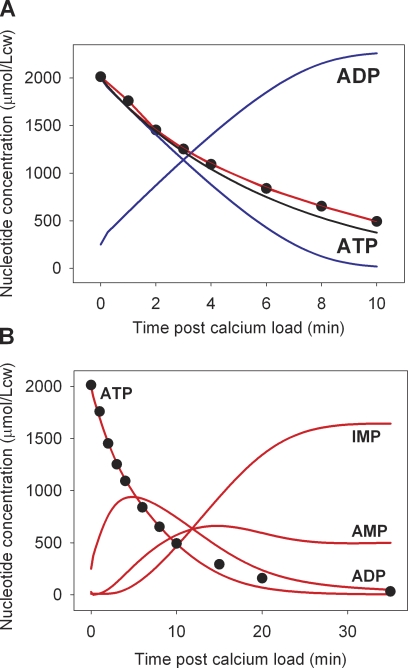
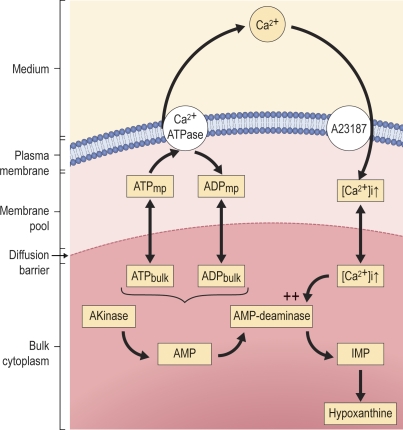
After the seminal observations of Parker and Hoffman (1967), a large body of evidence accumulated in support of the existence in human RBCs of a membrane compartment with a distinct ATP pool (perhaps ATP + ADP pool), diffusionally restricted from bulk cell nucleotides (Parker and Hoffman, 1967; Proverbio and Hoffman, 1977; Mercer and Dunham, 1981; Low et al., 1993; Hoffman, 1997; Hoffman et al., 2009). The membrane ATP pool, sustained by membrane-bound glycolytic enzymes, is considered the immediate source of energy for the sodium and calcium pumps. When depleted by pump activity, the membrane ATP pools can be refilled by glycolytic flow from membrane-bound glycolytic enzymes or by diffusion from the bulk cytoplasmic ATP pool. In the microdomain of the membrane nucleotide pool (mp), which is inaccessible to AK and to other soluble enzymes, Ca2+ ATPase activity would generate local concentrations of ADP and ATP such that (ADP/ATP)mp >> (ADP/ATP)bulk, as illustrated in Fig. 8 A (blue curves) for an imaginary isolated pool. The [ATP]mp/[ATP]bulk and [ADP]mp/[ADP]bulk concentration gradients would drive net diffusional flows of ATP into the pool and of ADP out of the pool. The three-enzyme model, as currently designed (see Appendix), ignores the two compartments and reads the resulting kinetics as if generated by a high Vmax–Km(ATP) ATPase (Fig. 5 B and Fig. 6). A proper test of the membrane pool interpretation of the current results requires extension of the three-enzyme model to incorporate the diffusion dynamics of the membrane and cytoplasmic nucleotide pools, for which much additional experimental information would be required, extensions beyond the scope of the present study.
Figure 8.
Model tests of the membrane pool interpretation of the data using ATPase parameters within measured ranges. Note the different timescales of the x axes in A and B. Red curves report the result of model simulations run with the introduction of delay factors of the form KAK(t) = KAK × (1 − exp[−k × t]) and VDA(t) = VDA × (1 − exp[−k × t]) for access of pool ATP and ADP to AK and AMPDA activities, respectively. Allowed ATPase VPmax values were ≤20 mmol/Lch, and allowed KPATP values were between 0.2 and 0.4 mM. The simulations sought values of VPmax, KPATP, and k that would provide a good fit to the measured Ca2+-induced ATP decline as reported in Fig. 4 (reproduced as closed circles here). The values of VPmax, KPATP, and k offering the fit shown by the red curves were 20 mmol/Lch, 0.3 mM, and 0.17 min−1, respectively. (A) Comparison of model-estimated ATP decline rates with experimentally measured points (closed circles). The blue curves report the ATP and ADP concentration changes that would be generated within an isolated pool by an ATPase with the 20–0.3-VPmax–KPATP parameter values. The black curve reproduces the best fit to the ATP decline rendered by the original three-enzyme model, as shown in Fig. 5 B. (B) Overall nucleotide concentration change pattern predicted by the delay-extended three-enzyme model with the given ATPase parameters.
However, a proof of principle of the viability of the membrane pool interpretation of the current results may be obtained from a rudimentary model analysis of global delay times that may be expected for ATP and ADP equilibration between membrane pool and bulk cell cytoplasm. The question may be formulated as follows: if we assume that the ATPase activity is restricted to a membrane pool inaccessible to AK and AMPDA activities, could the incorporation of delayed access of pool ATP and ADP to cytoplasmic AK and AMPDA in the three-enzyme model allow a Ca2+ ATPase operating within the range of experimentally determined mean values of VPmax and KPATP account for the measured Ca2+-induced ATP fall and for the overall pattern of nucleotide concentration changes? To answer this question, we incorporated in the model exponential delay factors of the form KAK(t) = KAK × (1 − exp[−k × t]) and VDA(t) = VDA × (1 − exp[−k × t]) for the pool nucleotides to access AK and AMPDA activities, respectively, and explored whether acceptable parameter values for ATPase and k could be found that would provide good fits to the observed rate of Ca2+-induced ATP decline (Fig. 8 A) and to the overall nucleotide change pattern (Fig. 8 B).
With the search restricted to VPmax values ≤20 mmol/Lch, a good fit to the measured ATP decline rate was obtained with a VPmax of 20 mmol/Lch, a KPATP of 0.3 mM, and a k value of 0.17 min−1, equivalent to a t1/2 of 0.693/0.17 ∼4 min (Fig. 8, closed circles and red curves). This fit compares well with the best fit obtained for the single compartment model with the 39-VPmax, 1.0-KPATP ATPase (Fig. 8 A, black curve). The delay correction, with realistic pump parameters, also provided an acceptable approximation to the observed nucleotide change pattern (Fig. 8 B). The surprisingly long half-time delay of ∼4 min, several orders of magnitude longer than that expected from unrestricted diffusion in water, suggests that the putative nucleotide pool serving the membrane transporters is somehow physically fenced off from the bulk cytoplasm, severely restricting the rate of nucleotide equilibration between the two compartments. A representation of the pool properties suggested by the analysis of the present results and by previous results in the literature (Hoffman, 1997; Hoffman et al., 2009) is shown in Fig. 9. This crude analysis then supports the plausibility of a pool explanation of the current results and prompts a search for additional intact-cell responses that could be reinterpreted as resulting from membrane pool function.
Figure 9.
A model of the membrane pool interpretation of the effects of elevated [Ca2+]i on the nucleotide metabolism of RBCs in the absence of glycolytic substrates. The model portrays events related to the specific experimental protocol applied in this study. Addition of a high concentration of the Ca2+ ionophore A23187 established rapid Ca2+ equilibration across the RBC membrane, with saturating [Ca2+]i levels for the PMCA. The nucleotide pool available to the Ca2+ ATPase is diffusionally restricted from the bulk cell cytoplasm so that Ca2+ ATPase activity generated a sustained [ADP]/[ATP] concentration ratio that was higher within the membrane pool than in the bulk cell cytoplasm. The AK and AMPDA enzymes are assumed to be excluded from the membrane pool and confined to the cytoplasm. AMPDA activity is highly stimulated by elevated [Ca2+]i. The combined activity of the three enzymes (Ca2+ ATPase within the membrane pool and AK and AMPDA within the cytoplasmic compartment) generates ADP, AMP, and IMP at the expense of declining ATP along the time course and pattern documented in Fig. 4, with the minor decline in the total nucleotide content of the cells attributed to irreversible hypoxanthine formation from IMP. The likely physical localization of the functionally defined diffusion barrier in the space between inner membrane surface and cytoskeletal mesh, as suggested in previous depictions of the membrane pool (Hoffman, 1997), was left out of the diagram because the present results do not contribute any additional information on this point.
The response of intact red cells to Ca2+ permeabilization stress is one possible example. When a small Ca2+ influx is suddenly set up by addition of Ca2+ ionophores to RBCs suspended in a medium containing Ca2+, a Ca2+ uptake peak is generated; the sharp initial increase in Ca2+ content is followed by an exponential decline to a new pump–leak steady state with half-times of ∼3 min (Ferreira and Lew, 1976; Scharff et al., 1983; Scharff and Foder, 1986; García-Sancho and Lew, 1988). Further additions of ionophore or Ca2+ elicit further peaks until the set Ca2+ influx overcomes the pump capacity of all the cells. Although the peaks were shown to occur with a marked heterogeneity of Ca2+ content among the cells (García-Sancho and Lew, 1988), a subpopulation of cells always exhibited a biphasic response, consisting of an initial rapid but limited net Ca2+ uptake followed by slow Ca2+ extrusion. One rather elegant explanation advanced for this phenomenon was based on the kinetics of Ca2+-dependent calmodulin binding and activation of the pump (Scharff et al., 1983; Scharff and Foder, 1986). However, this explanation was at variance with subsequent findings that the native configuration of the pump in the membrane was dimeric (Cavieres, 1984) and that in such a configuration pump kinetics conformed to that of a calmodulin-bound pump even in the absence of calmodulin (Kosk-Kosicka and Bzdega, 1988; Kosk-Kosicka and Bzdega, 1990; Kosk-Kosicka et al., 1990). The monomers were shown to be joined through the calmodulin binding site, functioning with the kinetics of a high-Vmax, high-Ca2+ affinity pump (Carafoli, 1994). The submembrane ATP pool offers an alternative to the calmodulin interpretation of the peak response: pump activation by the sudden increase in Ca2+ influx depletes the membrane ATP pool, momentarily and partially, allowing a reduced net Ca2+ gain. As the pool is replenished by ATP diffusion from the cytoplasm, the pump regains the extrusion capacity of a fully ATP-supplied pump capable of sustaining an increased pump–leak balance. Although the time resolution of the early measured peak responses was poor (Ferreira and Lew, 1976), peak decline half-times were clearly within the time domain of ∼4 min found for the t1/2 of pool-bulk equilibration. Thus, as pointed out by Hoffman (1997), ATP pools in intact RBCs may function as an energy reserve for sustained ion pumping during periods of transient stress.
APPENDIX
The three-enzyme model, equations, and numerical computations
The equations and equation parameter values determine the behavior of the system in time. Its initial state is defined by the values of the nucleotide concentrations at t = 0. Initial inputs therefore require entry of parameter values and initial nucleotide concentrations. The system parameters are listed as follows, with default values corresponding to those providing the best fit of the pattern observed for the experimental protocol investigated here: VPmax: Ca2+-saturated maximal mean ATPase activity, 39 mmol/Loc; KPATP: Km for ATP on the ATPase, 1.05 mM; VDA: maximal AMPDA activity set by the prevailing 2,3-DPG and [Ca2+]i levels, 8 mmol/Lch; KDAATP: effective Km for ATP on the AMPDA at physiological 2,3-DPG levels, 25 µM; KDAAMP: Km for AMP on AMPDA, 50 µM; VH: rate of IMP to hypoxanthine conversion, responsible for total nucleotide decline, set to match the observed decline rate (Fig. 4), 0.2 mmol/Lch; and KAK: AK equilibrium dissociation constant, 0.9.
After a sudden increase in RBC [Ca2+]i (t = 0) to saturating PMCA levels, the model computes the evolution in time of the nucleotide concentrations. In the numerical computations, iteration time intervals, Δt, of between 0.2 and 1 s rendered results differing by <0.1%.
Model equations
Ca2+ ATPase (P).
For [ATP] and [ADP] at t = t − Δt:
and (Δ[ADP])P = −(Δ[ATP])P. Then, [ATP]t = + (Δ[ATP])P and
AMPDA (DA).
For [ATP] and [AMP] at t = t − Δt, neglecting basal activity when [ATP] → 0 at physiological 2,3-DPG levels (Almaraz and García-Sancho, 1989) gives
and (Δ[AMP])DA = −(Δ[IMP])DA. Then, [AMP]t = + (Δ[AMP])DA and [IMP]t = + (Δ[IMP])DA. Total nucleotide decline through IMP → hypoxanthine conversion (H) gives (Δ[IMP])H = −VHΔt. The new IMP concentration at t = t is now [IMP]t = [IMP]t + (Δ[IMP])H.
AK equilibrium (AK).
In each Δt interval, AK equilibrium imposes a change in adenine nucleotide concentration, z, such that 2([ADP] − z) ↔ ([ATP] + z) + ([AMP] + z). The quantity z can be computed from the equilibrium condition
by solving the quadratic equation in z:
using the temporary concentrations for [ATP]t, [ADP]t, and [AMP]t defined above and the solution z = −b/2 + ([b/2]2 − c)0.5.
The new adenine nucleotide concentrations at t = t are now given by [ATP]t = [ATP]t + z, [ADP]t = [ADP]t − 2z, and [AMP]t = [AMP]t + z. Total nucleotide concentration at t = t is [N]t = [ATP]t + [ADP]t + [AMP]t + [IMP]t. This completes the computations within each Δt, ready for the next iteration step. The frequency of data outputs is set to optimize model experiment comparisons.
Acknowledgments
The authors wish to thank the Wellcome Trust for funds and the reviewers for their insightful criticisms and suggestions.
Edward N. Pugh Jr. served as editor.
Footnotes
Abbreviations used in this paper:
- AK
- adenylate kinase
- AMPDA
- AMP-deaminase
- DPG
- diphosphoglyceric acid
- PCA
- perchloric acid
- PMCA
- plasma membrane calcium pump
- RBC
- red blood cell
References
- Adunyah E.S., Niggli V., Carafoli E. 1982. The anticalmodulin drugs trifluoperazine and R24571 remove the activation of the purified erythrocyte Ca2+-ATPase by acidic phospholipids and by controlled proteolysis. FEBS Lett. 143:65–68 10.1016/0014-5793(82)80274-3 [DOI] [PubMed] [Google Scholar]
- Almaraz L., García-Sancho J. 1989. Activation by calcium of AMP deaminase from the human red cell. FEBS Lett. 244:417–420 10.1016/0014-5793(89)80575-7 [DOI] [PubMed] [Google Scholar]
- Almaraz L., García-Sancho J., Lew V.L. 1988. Calcium-induced conversion of adenine nucleotides to inosine monophosphate in human red cells. J. Physiol. 407:557–567 [DOI] [PMC free article] [PubMed] [Google Scholar]
- Alvarez J., García-Sancho J., Herreros B. 1988. All or none cell responses of Ca2+-dependent K channels elicited by calcium or lead in human red cells can be explained by heterogeneity of agonist distribution. J. Membr. Biol. 104:129–138 10.1007/BF01870925 [DOI] [PubMed] [Google Scholar]
- Arese P., Bosia A., Pescarmona G.P., Till U. 1981. The connection between ionophore-mediated Ca2+-movements and intermediary metabolism in human red cells. II. Site and mode of glycolytic activation during Ca2+-loading. Cell Calcium. 2:509–524 10.1016/0143-4160(81)90010-5 [DOI] [Google Scholar]
- Askari A. 1966. Modifying effects of anions on the alkali-cation-activated AMP deaminase of human erythrocyte. Mol. Pharmacol. 2:518–525 [PubMed] [Google Scholar]
- Askari A., Rao S.N. 1968. Regulation of AMP deaminase by 2,3-diphosphoglyceric acid: a possible mechanism for the control of adenine nucleotide metabolism in human erythrocytes. Biochim. Biophys. Acta. 151:198–203 [DOI] [PubMed] [Google Scholar]
- Bookchin R.M., Etzion Z., Lew V.L., Tiffert T. 2009. Preserved function of the plasma membrane calcium pump of red blood cells from diabetic subjects with high levels of glycated haemoglobin. Cell Calcium. 45:260–263 10.1016/j.ceca.2008.11.001 [DOI] [PubMed] [Google Scholar]
- Brown A.M., Lew V.L. 1983. The effect of intracellular calcium on the sodium pump of human red cells. J. Physiol. 343:455–493 [DOI] [PMC free article] [PubMed] [Google Scholar]
- Carafoli E. 1992. The Ca2+ pump of the plasma membrane. J. Biol. Chem. 267:2115–2118 [PubMed] [Google Scholar]
- Carafoli E. 1994. Biogenesis: plasma membrane calcium ATPase: 15 years of work on the purified enzyme. FASEB J. 8:993–1002 [PubMed] [Google Scholar]
- Cavieres J.D. 1984. Calmodulin and the target size of the (Ca2+ + Mg2+)-ATPase of human red-cell ghosts. Biochim. Biophys. Acta. 771:241–244 10.1016/0005-2736(84)90539-X [DOI] [PubMed] [Google Scholar]
- Dagher G., Lew V.L. 1988. Maximal calcium extrusion capacity and stoichiometry of the human red cell calcium pump. J. Physiol. 407:569–586 [DOI] [PMC free article] [PubMed] [Google Scholar]
- Ferreira H.G., Lew V.L. 1976. Use of ionophore A23187 to measure cytoplasmic Ca buffering and activation of the Ca pump by internal Ca. Nature. 259:47–49 10.1038/259047a0 [DOI] [PubMed] [Google Scholar]
- García-Sancho J., Lew V.L. 1988. Heterogeneous calcium and adenosine triphosphate distribution in calcium-permeabilized human red cells. J. Physiol. 407:523–539 [DOI] [PMC free article] [PubMed] [Google Scholar]
- Gardos G. 1958. The function of calcium in the potassium permeability of human erythrocytes. Biochim. Biophys. Acta. 30:653–654 10.1016/0006-3002(58)90124-0 [DOI] [PubMed] [Google Scholar]
- Garrahan P.J., Rega A.F. 1978. Activation of partial reactions of the Ca2+-ATPase from human red cells by Mg2+ and ATP. Biochim. Biophys. Acta. 513:59–65 10.1016/0005-2736(78)90111-6 [DOI] [PubMed] [Google Scholar]
- Garrahan P.J., Rossi R.C., Rega A.F. 1982. The interaction of K+, Na+, Mg2+, and ATP with the (Na,K)-ATPase. Ann. NY Acad. Sci. 402:239–252 10.1111/j.1749-6632.1982.tb25745.x [DOI] [PubMed] [Google Scholar]
- Hoffman J.F. 1997. ATP compartmentation in human erythrocytes. Curr. Opin. Hematol. 4:112–115 10.1097/00062752-199704020-00006 [DOI] [PubMed] [Google Scholar]
- Hoffman J.F., Dodson A., Proverbio F. 2009. On the functional use of the membrane compartmentalized pool of ATP by the Na+ and Ca++ pumps in human red blood cell ghosts. J. Gen. Physiol. 134:351–361 10.1085/jgp.200910270 [DOI] [PMC free article] [PubMed] [Google Scholar]
- Kosk-Kosicka D., Bzdega T. 1988. Activation of the erythrocyte Ca2+-ATPase by either self-association or interaction with calmodulin. J. Biol. Chem. 263:18184–18189 [PubMed] [Google Scholar]
- Kosk-Kosicka D., Bzdega T. 1990. Effects of calmodulin on erythrocyte Ca2(+)-ATPase activation and oligomerization. Biochemistry. 29:3772–3777 10.1021/bi00467a025 [DOI] [PubMed] [Google Scholar]
- Kosk-Kosicka D., Bzdega T., Wawrzynow A., Scaillet S., Nemcek K., Johnson J.D. 1990. Erythrocyte Ca2+-ATPase: activation by enzyme oligomerization versus by calmodulin. Calcium Binding Proteins in Normal and Transformed Cells. Pochet R., Lawson D.E.M., Heizmann C.W., Plenum Press, NY: 169–174 [DOI] [PubMed] [Google Scholar]
- Lew V.L. 1971. On the ATP dependence of the Ca2+ -induced increase in K+ permeability observed in human red cells. Biochim. Biophys. Acta. 233:827–830 10.1016/0005-2736(71)90185-4 [DOI] [PubMed] [Google Scholar]
- Lew V.L., Bookchin R.M. 1986. Volume, pH, and ion-content regulation in human red cells: analysis of transient behavior with an integrated model. J. Membr. Biol. 92:57–74 10.1007/BF01869016 [DOI] [PubMed] [Google Scholar]
- Lew V.L., García-Sancho J. 1989. Measurement and control of intracellular calcium in intact red cells. Methods in Enzymology: Biomembranes, Part T: Cellular and Subcellular Transport: Eukaryotic (Nonepithelial) Cells. Vol. 173. Fleischer S., Fleischer B., Academic Press, Inc., San Diego, CA: 100–112 [DOI] [PubMed] [Google Scholar]
- Lew V.L., Freeman C.J., Ortiz O.E., Bookchin R.M. 1991. A mathematical model of the volume, pH, and ion content regulation in reticulocytes. Application to the pathophysiology of sickle cell dehydration. J. Clin. Invest. 87:100–112 10.1172/JCI114958 [DOI] [PMC free article] [PubMed] [Google Scholar]
- Lew V.L., Daw N., Perdomo D., Etzion Z., Bookchin R.M., Tiffert T. 2003. Distribution of plasma membrane Ca2+ pump activity in normal human red blood cells. Blood. 102:4206–4213 10.1182/blood-2003-06-1787 [DOI] [PubMed] [Google Scholar]
- Lew V.L., Daw N., Etzion Z., Tiffert T., Muoma A., Vanagas L., Bookchin R.M. 2007. Effects of age-dependent membrane transport changes on the homeostasis of senescent human red blood cells. Blood. 110:1334–1342 10.1182/blood-2006-11-057232 [DOI] [PMC free article] [PubMed] [Google Scholar]
- Low P.S., Rathinavelu P., Harrison M.L. 1993. Regulation of glycolysis via reversible enzyme binding to the membrane protein, band 3. J. Biol. Chem. 268:14627–14631 [PubMed] [Google Scholar]
- Mercer R.W., Dunham P.B. 1981. Membrane-bound ATP fuels the Na/K pump. Studies on membrane-bound glycolytic enzymes on inside-out vesicles from human red cell membranes. J. Gen. Physiol. 78:547–568 10.1085/jgp.78.5.547 [DOI] [PMC free article] [PubMed] [Google Scholar]
- Mualem S., Karlish S.J.D. 1979. Is the red cell calcium pump regulated by ATP? Nature. 277:238–240 10.1038/277238a0 [DOI] [PubMed] [Google Scholar]
- Muallem S., Karlish S.J.D. 1981. Studies on the mechanism of regulation of the red-cell Ca2+ pump by calmodulin and ATP. Biochim. Biophys. Acta. 647:73–86 10.1016/0005-2736(81)90296-0 [DOI] [PubMed] [Google Scholar]
- Muallem S., Karlish S.J.D. 1983. Catalytic and regulatory ATP-binding sites of the red cell Ca2+ pump studied by irreversible modification with fluorescein isothiocyanate. J. Biol. Chem. 258:169–175 [PubMed] [Google Scholar]
- Parker J.C., Hoffman J.F. 1967. The role of membrane phosphoglycerate kinase in the control of glycolytic rate by active cation transport in human red blood cells. J. Gen. Physiol. 50:893–916 10.1085/jgp.50.4.893 [DOI] [PMC free article] [PubMed] [Google Scholar]
- Plagemann P.G.W., Wohlhueter R.M., Kraupp M. 1985. Adenine nucleotide metabolism and nucleoside transport in human erythrocytes under ATP depletion conditions. Biochim. Biophys. Acta. 817:51–60 10.1016/0005-2736(85)90067-7 [DOI] [PubMed] [Google Scholar]
- Pressman B.C. 1976. Biological applications of ionophores. Annu. Rev. Biochem. 45:501–530 10.1146/annurev.bi.45.070176.002441 [DOI] [PubMed] [Google Scholar]
- Proverbio F., Hoffman J.F. 1977. Membrane compartmentalized ATP and its preferential use by the Na,K-ATPase of human red cell ghosts. J. Gen. Physiol. 69:605–632 10.1085/jgp.69.5.605 [DOI] [PMC free article] [PubMed] [Google Scholar]
- Raftos J.E., Edgley A., Bookchin R.M., Etzion Z., Lew V.L., Tiffert T. 2001. Normal Ca2+ extrusion by the Ca2+ pump of intact red blood cells exposed to high glucose concentrations. Am. J. Physiol. Cell Physiol. 280:C1449–C1454 [DOI] [PubMed] [Google Scholar]
- Rega A.F., Garrahan P.J. 1986. The Ca2+ Pump of Plasma Membranes. CRC Press, Boca Raton, FL: 173 pp [Google Scholar]
- Reusch R.N., Huang R., Kosk-Kosicka D. 1997. Novel components and enzymatic activities of the human erythrocyte plasma membrane calcium pump. FEBS Lett. 412:592–596 10.1016/S0014-5793(97)00863-6 [DOI] [PubMed] [Google Scholar]
- Romero P.J., Romero E.A. 1997. Differences in Ca2+ pumping activity between sub-populations of human red cells. Cell Calcium. 21:353–358 10.1016/S0143-4160(97)90028-2 [DOI] [PubMed] [Google Scholar]
- Romero P.J., Romero E.A. 1999. The role of calcium metabolism in human red blood cell ageing: a proposal. Blood Cells Mol. Dis. 25:9–19 10.1006/bcmd.1999.0222 [DOI] [PubMed] [Google Scholar]
- Scharff O., Foder B. 1986. Delayed activation of calcium pump during transient increases in cellular Ca2+ concentration and K+ conductance in hyperpolarizing human red cells. Biochim. Biophys. Acta. 861:471–479 10.1016/0005-2736(86)90456-6 [DOI] [PubMed] [Google Scholar]
- Scharff O., Foder B., Skibsted U. 1983. Hysteretic activation of the Ca2+ pump revealed by calcium transients in human red cells. Biochim. Biophys. Acta. 730:295–305 10.1016/0005-2736(83)90346-2 [DOI] [PubMed] [Google Scholar]
- Schatzmann H.J. 1966. ATP-dependent Ca++-extrusion from human red cells. Experientia. 22:364–365 10.1007/BF01901136 [DOI] [PubMed] [Google Scholar]
- Schatzmann H.J. 1983. The red cell calcium pump. Annu. Rev. Physiol. 45:303–312 10.1146/annurev.ph.45.030183.001511 [DOI] [PubMed] [Google Scholar]
- Simonsen L.O., Lew V.L. 1980. The correlation between ionophore A23187 content and calcium permeability of ATP-depleted human red blood cells. Membrane Transport in Erythrocytes: Relations between Function and Molecular Structure: Proceedings of the Alfred Benzon Symposium 14 Held at the Premises of the Royal Danish Academy of Sciences and Letters, Copenhagen, 26–30 August 1979. Lassen U.V., Ussing H.H., Wieth J.O., Munksgaard, Copenhagen: 208–212 [Google Scholar]
- Simonsen L.O., Gomme J., Lew V.L. 1982. Uniform ionophore A23187 distribution and cytoplasmic calcium buffering in intact human red cells. Biochim. Biophys. Acta. 692:431–440 10.1016/0005-2736(82)90394-7 [DOI] [PubMed] [Google Scholar]
- Tiffert T., Lew V.L. 2001. Kinetics of inhibition of the plasma membrane calcium pump by vanadate in intact human red cells. Cell Calcium. 30:337–342 10.1054/ceca.2001.0241 [DOI] [PubMed] [Google Scholar]
- Tiffert T., Lew V.L., Ginsburg H., Krugliak M., Croisille L., Mohandas N. 2005. The hydration state of human red blood cells and their susceptibility to invasion by Plasmodium falciparum. Blood. 105:4853–4860 10.1182/blood-2004-12-4948 [DOI] [PMC free article] [PubMed] [Google Scholar]
- Till U., Petermann H., Wenz I., Arese P. 1981. The connection between ionophore-mediated Ca2+-movements and intermediary metabolism in human red cells. I. Relationships between Ca2+-loading, ATP-consumption and glycolytic flux. Cell Calcium. 2:495–507 10.1016/0143-4160(81)90009-9 [DOI] [Google Scholar]
- Whittam R. 1964. Transport and Diffusion in Red Blood Cells. Williams & Wilkins, Baltimore, MD: 228 pp [Google Scholar]


