Abstract
Some flax varieties respond to nutrient stress by modifying their genome and these modifications can be inherited through many generations. Also associated with these genomic changes are heritable phenotypic variations 1,2. The flax variety Stormont Cirrus (Pl) when grown under three different nutrient conditions can either remain inducible (under the control conditions), or become stably modified to either the large or small genotroph by growth under high or low nutrient conditions respectively. The lines resulting from the initial growth under each of these conditions appear to grow better when grown under the same conditions in subsequent generations, notably the Pl line grows best under the control treatment indicating that the plants growing under both the high and low nutrients are under stress. One of the genomic changes that are associated with the induction of heritable changes is the appearance of an insertion element (LIS-1) 3, 4 while the plants are growing under the nutrient stress. With respect to this insertion event, the flax variety Stormont Cirrus (Pl) when grown under three different nutrient conditions can either remain unchanged (under the control conditions), have the insertion appear in all the plants (under low nutrients) and have this transmitted to the next generation, or have the insertion (or parts of it) appear but not be transmitted through generations (under high nutrients) 4. The frequency of the appearance of this insertion indicates that it is under positive selection, which is also consistent with the growth response in subsequent generations. Leaves or meristems harvested at various stages of growth are used for DNA and RNA isolation. The RNA is used to identify variation in expression associated with the various growth environments and/or t he presence/absence of LIS-1. The isolated DNA is used to identify those plants in which the insertion has occurred.
Keywords: Plant Biology, Issue 47, Flax, genome variation, environmental stress, small RNAs, altered gene expression
Protocol
1. Growth of flax under inducing conditions.
5" pots are filled with soil and firmed.
Three seeds per pot are planted ¼ inch deep and the soil firmed over the seeds.
- The pots are then watered with 100ml of the appropriate nutrient solutions
- The non-inducing control (C) conditions use a 1/10th strength Miracle-Gro every week. The high nutrient condition (NPK treatment) had full strength Miracle Grow applied weekly. Low nutrient - plants only had tap water applied throughout their growth. (Durrant 1971, Cullis 1980).
The plants are grown under natural light during the summer. During the winter they are grown under sodium lights with a 16/8 hour light/dark cycle.
At weekly intervals leaves and meristems are collected.
The plant material is quick frozen in liquid nitrogen.
Results
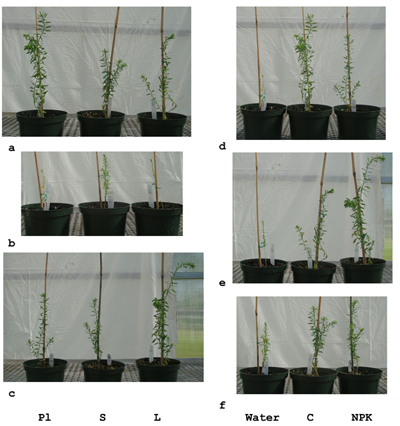
The three genotypes grow at different relative rates depending on the conditions (Figure 1). Therefore under control conditions the Pl line grows best with L being more vigorous than S (Figure 1a). Under low nutrients (water), S grows better than either L or Pl (Figure 1b). Under high nutrient (NPK) L grows better than Pl which only grows slightly better than S (Figure 1c). A comparison between each of the lines grown under the three differing treatments is shown in Figure 1 d - f. Pl grows best under control conditions (Figure 1d), L best under high nutrient (Figure 1e) and S similarly under both high nutrient and control conditions (Figure 1f).
These data show that the three lines can be differentiated based on their growth under the three environments. Of note is that Pl grows best under the control conditions while L grows best under the NPK conditions (under which it was induced). S grows about the same in all three conditions, that is, it is not able to take advantage of improved nutrient conditions but is better able to grow under very low nutrient conditions.
The growth parameters that are relevant to the differentiation of the plants include the plant height (and associated with this the internode length, that is the distance between each leaf), the leaf size and the degree of branching. For Pl under control conditions the plant is tall with branches and the leaves are large and dark green. Under low nutrients the plant is very short, the distance between each leaf is also very short and the leaves are small and light green. The leaves at the tip are darker green than those lower down the stem. Under high nutrients the plant looks very similar to that under control conditions except that both the main stem and the side shoots are shorter than in the control plants. For the large genotroph the plants look very similar to those of Pl except that the most vigorous growth in under high nutrients. Again under low nutrients the plant is very short and has light green leaves. The S genotroph grows similarly in all three environments although the leaves are lighter green under the low nutrients. However, in the low nutrient conditions the S genotroph is much more vigorous than either of the Pl or L lines.
2. RNA and DNA extractions from flax meristems and leaves are done separately. The Roche total RNA prep kit was used for the RNA extractions and the Qiagen DNeasy Plant DNA prep kit was used for the DNA extractions.
RNA Extraction
3 meristems plus some surrounding leaves are moved from storage cryovial into eppendorf tube and placed into liquid nitrogen until ready to be ground.
Sterile sand is added to tube and tissue is ground using a micropestle until fine.
400 ul lysis/binding buffer from Roche total RNA prep kit is added and tissue is further ground until no clumps are visible.
Sample is vortexed for 15 sec to aid lysis and then spun for 1 min at 13,000 rpm to collect sand and any debris.
Supernatant is added to spin column and the rest of the RNA prep kit instructions are followed as directed.
DNAse treatment
1/10 RNA sample volume of 10X DNAse buffer is added.
30 units of DNAse is added and reaction is incubated at 37°C for 30 min and 70°C for 5 min.
Reverse Transcription
Applied Biosystems RNA to cDNA kit is used as per directions, reaction incubated at 37°C for 1 hour and 95°C for 5 minutes.
The cDNA is then used in PCR or for qPCR
qPCR
qPCR was performed using an ABI Step One system. All assays were performed in triplicate on each run. The actin gene was used as a copy number control as the best available housekeeping gene.
The appropriate primer pair was added to each tube in 1μl.
The cDNA was diluted to the appropriate concentration and 9μl added to each tube
10μl of the 2x Power SYBR Green PCR MasterMix (ABI) and was added to each tube
- The program amplification program was:
- 10 minutes at 95°C
- 40 cycles of 15sec at 95°C, 1 min at 60°C
The relative expression levels were determined by the value of 2(CTunknown - CTactin).
DNA preparation
Buffer AP1 from Qiagen DNeasy Plant DNA prep kit is added to 6 leaves with sterile sand in a microfuge tube. The tissue is ground with micropestle until no clumps are visible.
The kit instructions are followed as directed.
Results
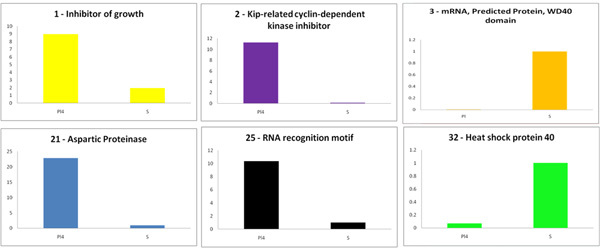
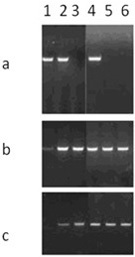
PCR amplification from the DNA isolated from leaves at various positions along the stem demonstrates that the appearance of LIS-1 occurs while the plants are growing under inducing conditions (4). The qPCR results show that the presence of LIS-1 (or other genomic changes associated with the induction) affects the expression of genes in the immediate vicinity of LIS-1 (Figure 2). The six genes shown in Figure 2 are all differentially expressed in Pl and S with four having higher expression in PL (without LIS-1) and two having higher expression in S (which does have LIS-1). Panel 1 and 2 are the two genes closest to the insertion point of LIS-1. The expression of these gene s in the large genotroph (which has had changes induced but does not have LIS-1) and the expression under different growth conditions will be needed to determine any causal relationship between LIS-1 and the expression changes.
 Figure 1. Pl, L and S grown under three different nutrient regimes. Panels a - control, b - low nutrients and c - NPK. d - Pl, e - S, f - L. Panels d - f from left to right: low nutrients, control and NPK. D - Pl, e - L, F - S.
 Figure 2. Gene expression around the point of insertion of LIS-1. Gene 1 (Inhibitor of growth) is immediately 5' to LIs1 and the gene 2 (Kip-related cyclin-dependent kinase inhibitor id 3" of LIS-1. The other genes are all along the same scaffold (~500kb) built from the complete flax genome sequence. Please click here to see a larger figure.
 Figure 3. PCR amplifications of DNAs extracted from individual leaves of plants of Stormont Cirrus grown under low nutrient conditions. The PCR products were separated on a 2% agarose-TBE gel. The uninserted site is shown in Panel a, the two ends of the inserted site are shown in Panels b and c. Leaf samples 1 - 6 were isolated at weekly intervals with sample 1 being the earliest after sowing.
Discussion
Flax appears to have an inherently unstable genome. A number of commercial fiber flax varieties rapidly become non-uniform when grown for a few generations. The same observations do not appear to hold true for the oil flax varieties. Therefore there appears to be an association between the selection for fiber quality and genome instability. The environmentally induced heritable changes in flax were originally identified through the investigation of the agronomic observations of the growth of the fiber crop. These repeatable observations of specific phenotypic and genomic variations raises the question of how environmental stress can influence the suite of genomic rearrangements that can occur. The repeated appearance of LIS-1 in response to particular environments is consistent with this mutation being directly or indirectly selected. The growth of the lines induced by various treatments also indicates an improved performance under the relevant inducing conditions. The changes in expression also associated with the presence of LIS-1 again indicates that this insertion affect plant performance. The video presentation provides a forum for observing the plant phenotypic changes in a manner impossible to convey through traditional printed material.
Disclosures
No conflicts of interest declared.
References
- Durrant A. The environmental induction of heritablel change in Linum. Heredity. 1962;17:27–61. [Google Scholar]
- Cullis CA. Molecular aspects of the environmental induction of heritable changes in flax. Heredity. 1977;38:129–154. [Google Scholar]
- Chen Y, Schneeberger RG, Cullis CA. A site-specific insertion sequence in flax genotrophs induced by the environment. New Phytol. 2005. pp. 167–171. [DOI] [PubMed]
- Chen Y, Lowenfeld R, Cullis CA. An environmentally induced adaptive (?) insertion event in flax. Int. J. Genet. Mol. Biol. 2009;1:38–47. [Google Scholar]


