Abstract
Electric fields, generated by active transport of ions, are present in many biological systems and often serve important functions in tissues and organs. For example, they play an important role in directing cell migration during wound healing. Here we describe the manufacture and use of ultrasensitive vibrating probes for measuring extracellular electric currents. The probe is an insulated, sharpened metal wire with a small platinum-black tip (30-35 μm), which can detect ionic currents in the μA/cm2 range in physiological saline. The probe is vibrated at about 200 Hz by a piezoelectric bender. In the presence of an ionic current, the probe detects a voltage difference between the extremes of its movement. A lock-in amplifier filters out extraneous noise by locking on to the probe's frequency of vibration. Data are recorded onto computer. The probe is calibrated at the start and end of experiments in appropriate saline, using a chamber which applies a current of exactly 1.5 μA/cm2. We describe how to make the probes, set up the system and calibrate. We also demonstrate the technique of cornea measurement, and show some representative results from different specimens (cornea, skin, brain).
Protocol
1. Probe Manufacture
Blank probes are purchased from World Precision Instruments (elgiloy/stainless parylene-coated microelectrodes) (see 'Table of specific reagents and equipment' below). The probe is cut 25-30 mm behind the tip and about 5 mm of parylene insulation at the cut end scraped away with a scalpel (#11 blade) to ensure a good connection. The probe is mounted in a gold R30 connector using electrically-conductive silver-loaded epoxy (e.g. Rite-Lok SL65) [*see note below]. The probe is stored overnight at room temperature to allow the epoxy to harden. Next, the probe tip is plated with gold and then platinum, using a nano-amp power supply. The probe tip is rinsed in acetone and connected to the negative output of a nano-amp power source. The probe tip is viewed under a dissecting microscope (x40) and placed first in gold plating solution (potassium dicyanoaurate (0.2% w/v KAu(CN)2 in distilled water (dH2O)). A reference wire connected to the positive output and placed in solution completes the circuit. A current of 5 nA is applied for 5 min, then increased to 20 nA until the tip is about half the desired final size (about 10-15 μm). The probe tip is rinsed in dH2O and then placed in platinizing solution (chloroplatinic acid hydrate; 1% w/v H2PtCl6 * 6H2O) plus lead(II) acetate trihydrate (0.1% w/v Pb(CH3CO2)2 * 3H2O in dH2O). A current of 250 nA is applied for 5 min, then increased to 500 nA until the tip is about 80% of the desired final size. The current is increased to 1 μA and applied in 1 sec bursts until the final tip diameter is obtained (about 30-35 μm). Finally, the tip is rinsed in dH2O. Probes can be store at room temperature indefinitely. If probes are damaged, the gold R30 connectors can be re-used. [* Note: Some probe systems have the probe mounting connected directly to the amplifier to carry the signal. Other systems have a separate mounting point and signal connector. In the latter case, a short (2-3 cm) wire with an R30 connector at one end is soldered to the first R30 connector prior to mounting the probe (see Figure 2A).]
2. Probe System
The probe is attached to a piezo-electric bender mounted on a 3-dimensional micro-positioner (Figure 1). Probe vibration is controlled by the vibrating probe power supply which also allows adjustment of vibration amplitude and frequency. The probe power supply sends a reference signal to the lock-in amplifier, which also displays the vibration frequency and phase angle. It is also useful to connect an oscilloscope so one has a quick visual reference of probe vibration. The signal from the probe goes to the lock-in amplifier. The probe and sample to be measured can be viewed with a dissecting microscope (magnification x6 to x40) with fiber-optic illumination. During calibration and sample measurements, a reference and a ground (earth) wire must be in the solution (see Figure 2B).The amplifier is connected to a computer via an analog-digital (i/o) interface. Data is recorded using Strathclyde Electrophysiology Software's Whole Cell Program (WinWCP).
Lock-in amplifier settings: Sensitivity [200 μV], Dynamic Resolution [normal], Offset [on], Expand [x1], Time Constant: pre [10 s], post [0.1 s]. If a faster response is required, the pre Time Constant can be reduced to 3 s. The offset control is used to bring the probe trace to near the center of the screen. If large responses are expected, the trace can be moved up or down.
WCP software settings: Record Duration [204.8 s], Samples Per Channel [1024], Sampling Interval [0.2 s], Voltage Range [+/- 0.2 V]. If large currents are anticipated, the Voltage Range can be increased to 1 V or 5 V.
3. Probe Settings
New probes have to be tested and their unique frequency and phase angle determined. The new probe is placed in the calibration chamber containing physiological saline (Figure 2B). The power supply is turned on and the frequency turned up until the maximum vibration is observed. This is the resonant frequency of the probe. Using the probe at this frequency can cause instability and produce noise in the recording, so the probe is 'de-tuned' by subtracting 10 Hz to give the probe's working frequency (typically 150-200 Hz). The vibration amplitude is adjusted so that the probe vibration distance is the same as the tip diameter, so that when the probe is vibrated a 'double image' of the probe tip is seen (see Figure 2B). To determine the phase angle, the probe is placed in saline in the calibration chamber and a current of 1.5 μA/cm2 applied repeatedly. The phase angle on the lock-in amplifier is adjusted until there is no response. Adding or subtracting 90° to this angle gives the maximum response, and this angle is the probe's working phase angle. The frequency and phase angle for each probe are noted for future use. During an experiment, it is important that these settings of frequency, amplitude and phase angle are not changed, as this will alter the probe's response. For convenience, when the current is flowing 'South-to-North', this should produce an upward deflection (termed here 'peak') in the recording trace, and current flowing 'North-to-South' should show a downward deflection (see Figure 3A). If this is the wrong way, then adding 180° to the phase angle will fix it by flipping the responses round. See Reid et al.1 for detailed information on the theory behind probe function, calibration, etc.
Calibration: The response of the probe to a 'standardized' current of exactly 1.5 μA/cm2, applied to the probe in a calibration chamber, is used to calculate the current in the sample (see Figure 2B, 3A). Prior to sample measurement, the probe is calibrated in appropriate solution, e.g. BSS+ Artificial Tear Solution for cornea. Current is applied in two directions: South-North and North-South, producing an upward and a downward deflection, respectively, equivalent to outward and inward currents, depending on the orientation of the sample. The probe trace should have a stable baseline and low noise (compare Figs. 3A and 3B). The probe is calibrated at the end of the experiment in used solution to compensate for osmolality change due to evaporation. When analyzing data, measurements from the first half of the experiment can be calculated using the starting calibration values, and measurements from the second half calculated using the end calibration.
Sample Measurement: A chamber may have to be designed to hold and immobilize the sample. For example, Figure 3C shows Petri dishes with wire loops to hold eyes for cornea measurements. The dish containing physiological saline is placed under the dissecting microscope and the area of interest on the sample placed in focus in the field of view. The probe is then placed in solution and orientated parallel to the sample surface and also in focus so it is on the same level as the point on the sample to be measured. The probe is moved as far as is convenient (e.g. 1-2 cm) away from the sample, the vibration turned on (and the computer software set to record) to establish a stable (horizontal) baseline (see Figure 4A). The probe is then moved into measuring position, about 50 μm from the surface. When the new ('peak') value is stable, the probe is moved back to reference position and the trace returns to baseline. This can be repeated at regular time points to produce timelapse data, or the sample moved/rotated slightly and repeated at different positions to yield spatial current mapping data (see Figure 4B, 5B).
Data Analysis: Data are analyzed using WinWCP (see Figure 5A). The horizontal red 'zero' line is moved up or down so it is parallel to the trace baseline prior to the measuring peak. The vertical green measuring line is moved across to the trace baseline. The output reading in green at the bottom of the green line should be close to zero (e.g. 0.00012). This number shows the differnce between the point where the red and green lines cross, and the blue trace. The red line is then moved up until it is parallel with the top of the peak. The green output reading is the size of the peak in mV. The data for all measurement peaks, and the calibration data, are put into a Microsoft Excel spreadsheet template (see Table 1). Relevent information such as the date, probe number, voltage range (VR), solution used, measuring positions, time-points, etc. can also be put in the spreadsheet. The current direction (into or out of the sample: 'i/o') is noted, and inward currents are also given a negative value in the 'peak' column. The current in the right-hand column is calculated using the formula: current=peak*(1.5/calibration) where 1.5 is the current in μA/cm2 applied at calibration. Thus: 'unw1'=12.45*(1.5/56.12)= 0.33276907 μA/cm2.
4. Secrets to Success
As in all electrophysiology, proper grounding (earthing) of vital equipment helps to eliminate noise. Thus, at least the micro-positioner and the chassis of the microscope should be earthed, and maybe also the light source (see Figure 1). The user can also be a source of static electricity, so earthing via a wrist-band can prevent instability of the probe in some cases, but is not always necessary. A Faraday cage is not necessary, as the lock-in amplifier filters out all frequencies (e.g. 60Hz from power grid) apart from the frequency the probe is vibrating at. A vibration isolation table is useful but not essential. A solid, stable bench or table works just as well. Apart from the basic information in the Excel spreadsheet (see above) it is useful to record in one's lab-book additional useful information such as changes in temperature, drug additions, etc. If photographs are taken down the microscope, note the magnification. If relevant, it is also useful to draw a sketch of the sample(s) showing position and/or orientation of probe measurements (see Figure 6).
Challenging steps
Probe making: there must be a good electrical connection between the probe and the R30 connector. If nothing happens at the electroplating stage, then this is probably the cause.
Calibration: use appropriate saline or culture medium for the sample you will be measuring. Don't over- or under-fill the calibration chamber as this can alter the response. The surface of the liquid should be flat across the top of the chamber.
Sample measurements: Plan in advance, e.g. do you need to make a special chamber to hold/mount the sample (see Figure 3C)? When measuring from a sample, the probe should be orientated with the long axis parallel to the sample surface, so that the probe's direction of vibration (and thus direction of current being measured) is perpendicular to the sample surface (for example, see Figure 4B). The sample can be moved and/or rotated for measurements at different positions. It is important to maintain a consistent distance between the probe and the sample surface when measuring. The current measured is proportional to the distance from the sample surface; as the probe moves away from the sample surface, the current drops by the inverse square law. That is, when measuring a current generated at the sample surface, the current detected is inversely proportional to the square of the distance from the surface. An eyepiece graticule can be used to judge the distance between the probe and the sample surface.
Troubleshooting
Problem: no response at calibration. Solution: check saline is contacting both electrodes. Check battery in constant current calibrator.
Problem: small response. Solution: clean probe in dH2O and/or acetone. Check phase angle.
Problem: noise or unstable baseline (see Figure 3B). Solution: Check earthing wires.
Problem: trace jumps off screen. Solution: do not allow probe tip to touch sample.
5. Representative Results
Figure 3A shows a good example of a calibration trace. Note the stable (horizontal) baseline, low noise and large response. As a comparison, Figure 3B shows a noisy trace with unstable baseline. Current measurements at different positions at a mouse cornea wound are shown in Figure 4B. The top panel shows the probe positions, the middle panel shows the probe traces as recorded on the computer and the lower panel is a graph of the currents at the different positions, showing a profile of wound current. Figure 5B shows measurements at a mouse skin wound made at regular time intervals to produce data on the wound current time-course.
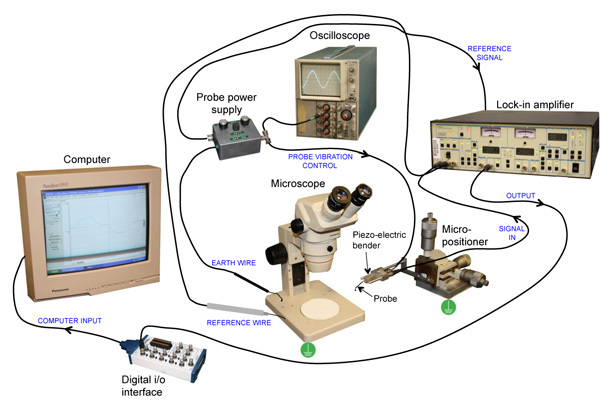 Figure 1. Vibrating probe system. See text for detailed description. Blue text describes the function of the connecting wires. Green symbols show earthing points.
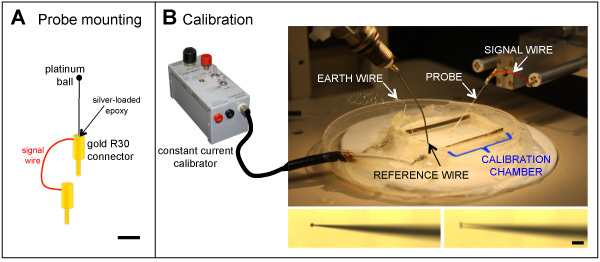 Figure 2. A. Probe mounting. The probe is glued into a gold R30 connector with silver-loaded epoxy, prior to electroporating. In some systems, a second connector with a short wire to carry the signal is soldered on. Scale bar 3 mm. The platinum ball is not to scale. B. Probe calibration. The constant current calibrator (left) applies a current of 1.5 μA/cm2 to the probe in the calibration chamber (right). Lower left: close-up of a probe. When the probe is vibrated (lower right), the amplitude is adjusted so a double-image of the tip is seen. Scale bar 100 μm.
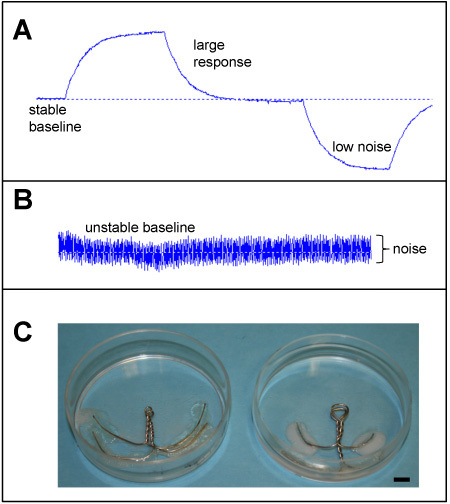 Figure 3. A. Probe calibration trace. Example of a good probe calibration trace, with stable baseline, low noise and large response. Current flowing South-to-North gives an upward deflection, and current flowing North-to-South produces a downward deflection. B. An unstable, noisy probe trace. C. Chambers made for mounting mouse (left) or rat (right) eyes for cornea measurements. Scale bar 5mm.
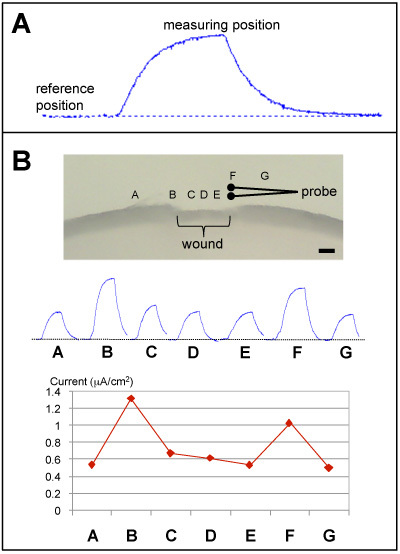 Figure 4. Prove measurement examples. A. A stable baseline is established with the probe in reference position 1-2 from the sample. When the probe is moved to measuring position near the sample, it detects a current and the trace deflects upwards (outward current). B. Measurements at different positions across a mouse cornea would. Probe is orientated parallel to the surface, so vibration is perpendicular. Upward peaks show outward currents. Maximum current is seen at the wound edges (positions B & F). The schematic of the probe is shown at measuring position F (right wound edge). Scale bar 300 μm.
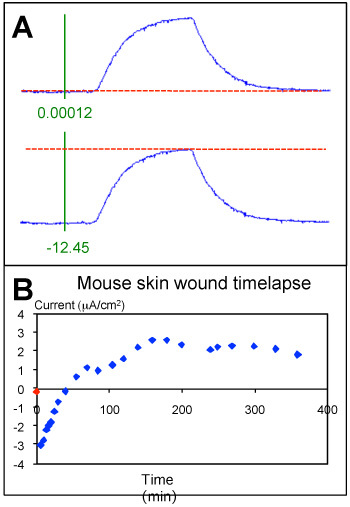 Figure 5. A. Analyzing probe traces. Upper panel: the red zero line is moved up or down so it is parallel with the trace baseline, then the green measuring line is moved across to the baseline so the output reading in green is close to zero (0.00012). Lower panel: the red line is then moved up until it is parallel with the top of the trace peak, and the output reading gives the size of the peak in mV (12.45). Current is calculated from this using the calibration data (see Table 1). B. Mouse skin wound timelapse data. Current before wounding is shown at time zero (red symbol). Measurements were made at the same position at a mouse skin wound at regular timepoints after wounding. After initial transient inward currents (below zero), the current reversed and the outward currents (positive) rose slowly and plateaued.
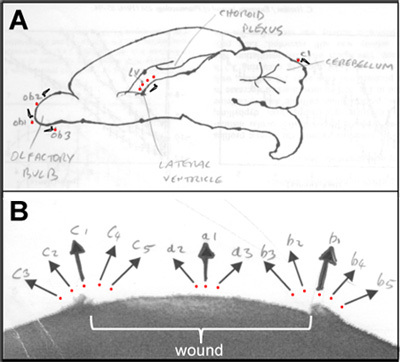 Figure 6. Lab-book sketches showing probe measuring positions. A. Rat brain; red dots show measuring positions and probe symbols show probe orientation. B. Rat cornea wound; red dots show measuring positions and arrows show direction of current measured.
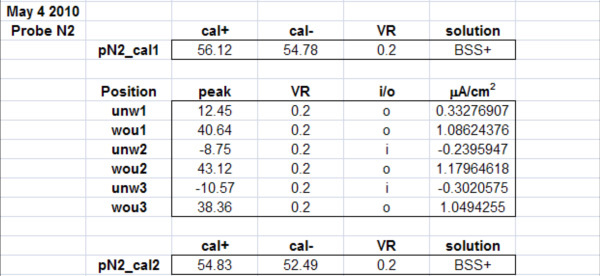 Table 1. Example of Excel spreadsheet for storing and quantifying probe data. pN2_cal1 = starting calibration; cal+ and cal- = calibration values in mV; VR = voltage range, peak = sample measurements in mV, i/o = flow of current (into or out of sample).
Discussion
We describe a low cost, basic, but highly sensitive vibrating probe system for measuring non-invasively electric current in a variety of biological systems.
Possible Modifications
If platinum/iridium electrodes (World Precision Instruments; cat # PTM23B20) are used instead of stainless steel, then the gold plating stage can be eliminated.
Applications
We have used the vibrating probe to measure electric current in: rat cornea2; rat lens3,4; mouse skin5; Xenopus tadpole6; human skin7; human cornea8; Zebrafish embryo1; Dictyostelium1; rat brain1. The vibrating probe was first described by Jaffe and Nuccitelli9. A computer-controlled probe which measures current in two dimensions has also been described10. Relevant interesting reviews are also included11-13.
Disclosures
No conflicts of interest declared.
Acknowledgments
We are grateful to Professor Richard Borgens, Center for Paralysis Research, Purdue University, for help in assembling the vibrating probe system. This study was supported by NEI grant NIH 1R01EY019101 to MZ and BR, and in part by grants from the California Institute of Regenerative Medicine RB1-01417, NSF MCB-0951199, and by an Unrestricted Grant from Research to Prevent Blindness, UC Davis Ophthalmology.
References
- Reid B, Nuccitelli R, Zhao M. Non-invasive measurement of bioelectric currents with a vibrating probe. Nat. Protoc. 2007;2:661–9282. doi: 10.1038/nprot.2007.91. [DOI] [PubMed] [Google Scholar]
- Reid B, Song B, McCaig CD, Zhao M. Wound healing in rat cornea: the role of electric currents. FASEB J. 2005;19:379–386. doi: 10.1096/fj.04-2325com. [DOI] [PMC free article] [PubMed] [Google Scholar]
- Lois N, Reid B, Song B, Zhao M, Forrester JV, McCaig CD. Electric currents and lens regeneration in the rat. Exp. Eye Res. 2010;90:316–323. doi: 10.1016/j.exer.2009.11.007. [DOI] [PubMed] [Google Scholar]
- Wang E, Reid B, Lois N, Forrester JV, McCaig CD, Zhao M. Electrical inhibition of lens epithelial cell proliferation: an additional factor in secondary cataract. FASEB J. 2005;19:842–844. doi: 10.1096/fj.04-2733fje. [DOI] [PMC free article] [PubMed] [Google Scholar]
- Guo A, Song B, Reid B, Gu Y, Forrester JV, Jahoda C, Zhao M. Effects of physiological electric fields on migration of human dermal fibroblasts. J. Invest. Derm. 2010 doi: 10.1038/jid.2010.96. [DOI] [PMC free article] [PubMed] [Google Scholar]
- Reid B, Song B, Zhao M. Electric currents in Xenopus tadpole tail regeneration. Dev. Biol. 2009;335:198–207. doi: 10.1016/j.ydbio.2009.08.028. [DOI] [PubMed] [Google Scholar]
- Zhao M, Song B, Pu J, Wada T, Reid B. Electrical signals control wound healing through phosphatidylinositol-3-OH kinase-γ. 2006;442:457–460. doi: 10.1038/nature04925. [DOI] [PubMed] [Google Scholar]
- Reid B, EO Graue-Hernandez, Mannis MJ, Zhao M. Modulating endogenous electric currents in human corneal wounds - a novel approach of bioelectric stimulation without electrodes. Cornea. 2010 doi: 10.1097/ICO.0b013e3181f7f2de. Forthcoming. [DOI] [PMC free article] [PubMed] [Google Scholar]
- Nuccitelli R. An ultrasensitive vibrating probe for measuring steady extracellular currents. J. Cell Biol. 1974;63:614–628. doi: 10.1083/jcb.63.2.614. [DOI] [PMC free article] [PubMed] [Google Scholar]
- Hotary KB, Nuccitelli R, Robinson KR. A computerized 2-dimensional vibrating probe for mapping extracellular current patterns. J. Neurosci. Meth. 1992;43:55–67. doi: 10.1016/0165-0270(92)90067-n. [DOI] [PubMed] [Google Scholar]
- Nuccitelli R. Endogenous ion currents and DC electric fields in multicellular animal tissues. Bioelectromagnetics Supplement. 1992;1:147–157. doi: 10.1002/bem.2250130714. [DOI] [PubMed] [Google Scholar]
- Levin M. Bioelectric mechanisms in regeneration: Unique aspects and future perspectives. Seminars in Cell Dev. Biol. 2009;20:543–556. doi: 10.1016/j.semcdb.2009.04.013. [DOI] [PMC free article] [PubMed] [Google Scholar]
- Zhao M. Electric fields in wound healing - An overriding signal that directs cell migration. Seminars in Cell Dev. Biol. 2009;20:674–682. doi: 10.1016/j.semcdb.2008.12.009. [DOI] [PubMed] [Google Scholar]


