Abstract
The Thoracic Oncology Program Database Project was created to serve as a comprehensive, verified, and accessible repository for well-annotated cancer specimens and clinical data to be available to researchers within the Thoracic Oncology Research Program. This database also captures a large volume of genomic and proteomic data obtained from various tumor tissue studies. A team of clinical and basic science researchers, a biostatistician, and a bioinformatics expert was convened to design the database. Variables of interest were clearly defined and their descriptions were written within a standard operating manual to ensure consistency of data annotation. Using a protocol for prospective tissue banking and another protocol for retrospective banking, tumor and normal tissue samples from patients consented to these protocols were collected. Clinical information such as demographics, cancer characterization, and treatment plans for these patients were abstracted and entered into an Access database. Proteomic and genomic data have been included in the database and have been linked to clinical information for patients described within the database. The data from each table were linked using the relationships function in Microsoft Access to allow the database manager to connect clinical and laboratory information during a query. The queried data can then be exported for statistical analysis and hypothesis generation.
Keywords: Medicine, Issue 47, Database, Thoracic oncology, Bioinformatics, Biorepository, Microsoft Access, Proteomics, Genomics
Protocol
1. University Clinical Research Protocols:
Two university protocols were developed for the purposes of this initiative. The first protocol allows for the prospective procurement of tissues from lung cancer, esophageal cancer, carcinoid tumor, thymoma, and mesothelioma patients. The protocol also allows blood and other bodily fluids to be collected from patients for biomarker studies. The protocol permits researchers to obtain clinical information from the patient source of such specimens via chart abstraction and to store both specimen and clinical data in a protected database.
The second protocol is similar to the first except that it allows researchers to access previously banked tissues and other samples obtained during the course of a patient's cancer diagnosis and treatment. Patients who have consented to surgery at the University of Chicago and who have signed this protocol are eligible.
2. Clinical Data Collection Protocol:
Patients being seen at the University of Chicago Medical Center for treatment of the aforementioned malignancies were included in this protocol.
Eligible patients were identified by their treating oncologist and were consented by a member of the clinical team trained in the two protocols.
Once consented, a patient's medical history information was obtained via chart abstraction and was entered into the database by a member of the clinical support team.
3. Specimen Collection Protocol:
Tissue samples
Tissues containing a known or suspected malignancy obtained during a patient's standard clinical care via biopsy or surgery were included in this protocol. No additional tissue, outside of what was necessary for a patient's diagnostic workup, was obtained.
After surgical removal of the sample necessary for the preparation of permanent sections, the residual tissue was placed on ice.
A tissue procurement technician transported the residual sample on ice to the pathology department.
Residual tissues were weighed, measured, transferred to storage, labeled, and properly documented according to the standard operating procedure.
Long-term storage of the specimens was maintained in a -80°C freezer in the pathology department.
In order to access tissue samples from patients who had already undergone surgery for a thoracic malignancy, lists of patients maintained by collaborating surgeons and radiation oncologists were referenced. In this manner patients of interest were identified. Their tumor tissue samples could be retrieved from the department of pathology if consent was obtained.
Blood samples
During clinically indicated blood draws, the protocol also allowed for an additional two to six tubes of blood in a 5 mL green top (Heparin) tube, one 10mL purple top tube (EDTA germline DNA) and one 10 mL red top (Serum) tube of blood.
Up to six samples at different time points were taken, with the date of the blood draw annotated.
Blood samples were centrifuged at 2000 rpm for 10 minutes.
Plasma and serum components were aliquoted in cryovial tubes in 1 mL portions.
For the collection of white blood cells, the upper 1-2 mL of the interface/red blood cell fraction were resuspended with 1-2 mL of cell preservation medium (MEM EBS media + 10% fetal cal serum+ 5% DMSO).
All samples were frozen slowly in an isopropyl freezing box at 70-80°C for 16-24 hours then transferred to a -70°C to -80°C storage box.
All samples were labeled with a bar-coded unique identifier and appropriately documented in the sample procurement form by a lab technician.
Other body fluids:
Fluid not collected for clinical use could be collected and stored under this protocol. Sputum samples were collected and sent for cytology. Sputum samples were stored on ice at 4°C while being transferred.
Sputum samples were then transferred to 15 mL Falcon tubes and centrifuged at 1400 rpm for 10 minutes.
The supernatant was aliquoted in 4 mL portions in 6mL cyrovials. Cyrovials were placed in a freezer, on dry ice, or in an isopropyl freezing box to be subsequently frozen to a -70°C to -80°C. After 16-24 hours, samples were transferred to a -70°C to -80°C storage box.
All samples were labeled with a bar-coded unique identifier and appropriately documented in the sample procurement form by a lab technician.
4. Building the Informatics Infrastructure:
After evaluating a number of database management programs, Microsoft Access was selected as the program to house clinical and laboratory data for the Thoracic Oncology Program Database Project based on its operability and ability to link related sets of data.
A team of clinicians, basic science researchers, a biostatistician, and a bioinformatics expert was convened to identify variables of interest to capture within the database.
The team identified data elements related to patient demographics, cancer characterization, epidemiological factors, and specimen annotation based on the needs of thoracic oncology researchers and referring to standards set regarding Common Data Elements (CDEs) by the National Cancer Institute.
The team developed a coding scheme to make data analyzable for research purposes. When possible, data was coded using numeric variables so as to reduce the amount of free-text entered into the database.
Variables of interest were divided among seven different tables within Microsoft Access to capture varied aspects of related information.
5. Designing the Contents of Each Table:
Seven primary tables were created: 1) Patients table, 2) Sample Data table, 3)TMA table, 4) DNA Specimens table, 5) Chest Oncology Conference table, 6) Cell Line table, and the 7) C. elegans table.
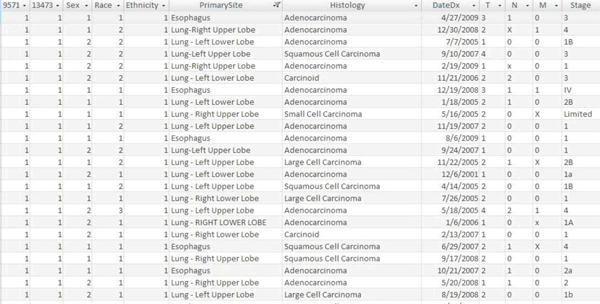
The Patients table was designed as the only table within the database to house clinically relevant information about the patients, their cancer, their clinical course, their risk factors, and their outcome (Fig 1). The intent of this particular design was to limit redundancy within the database.
The Sample Data table links pathological specimens to their patient sources. Each sample is given a sample pathology number and this number is related to the patient's medical record number. Multiple specimens may be obtained from each individual and so the table also includes information about the date the specimen was obtained and the type of specimen collected: initial tumor, recurrent tumor, or autopsy specimen.
The TMA table has been used thus far to capture protein expression data for 63 unique proteins. A TMA can be used to characterize the distribution of differentially expressed proteins in tumor and non-tumor tissue by using antibodies to localize proteins (Fig 2). Protein expression is represented by a score of 0, 1, 2, or 3 based on the pathologist's impression of the intensity and percentage of TMA staining. When percent staining is measured, a score of 0 indicates no staining, 1 indicates less than 11% staining, 2 indicates less than 50% staining, and 3 indicates greater than 50% staining. When intensity is measured, a score is assigned based on the relative amount of staining, also on a scale of 0 to 3. In some cases, IHC slides are also scanned at high resolution and staining intensity is quantified by Automated Cellular Imaging System (ACIS) imaging software in parallel to the pathologist's scoring. However, for both techniques, a higher score indicates greater protein expression. In addition, the TMA table annotates the location of the TMA punch for future reference. Furthermore, the database includes the source of the tissue (tumor, normal, lymph node, metastatic tissue), the location within the sample (center, edge), the histology of the cancer, and the medical record number to link this information back to the Patients table.
The DNA Specimens table lists all the DNA stored within the laboratory. DNA samples are linked to their patient source via the patient's medical record number. Basic information about the specimen is captured to describe the source of the sample, including the location and the histology of the tumor. The purpose of this table is to describe the genetic alterations which have been characterized within the specimen using polymerase chain reaction, standard DNA sequencing, and mutational analyses. The table also captures variables such as amino acid changes, nucleotide changes, homozygosity, synonymity, and the gene in which the mutation has occurred. Examples of genes which have been studied include Paxillin, cCbl, EGFR, p53, KRAS, cMet, and EphB4. The investigator who has characterized the mutations is also listed.
The fifth table within the database is the Chest Oncology Conference table. The chest oncology conference is a weekly meeting of medical oncologists, thoracic surgeons, pathologists, radiologists, radiation oncologists, and other members of the thoracic oncology clinical team who meet to develop coordinated patient treatment plans. The purpose of this table is to list the patients who have been discussed at the conference as part of their standard of care. Information regarding the availability of pathological specimens for each patient is also captured in this table.
The sixth table is the Cell Lines table. This is a free standing table within the database because it is not linked to any of the other tables. It describes the cell lines that have been utilized in the laboratory for research purposes. The table captures the amino acid changes, nucleotide changes, the homozygosity and synonymity of mutations, and the location of mutations within cell line DNA.
The seventh table is the C. elegans table and it is also a free standing table. This table lists orthologous receptor tyrosine kinases and includes the needle score, which is a measure of similarity with human proteins.
6. Establishing Relationships Among Tables:
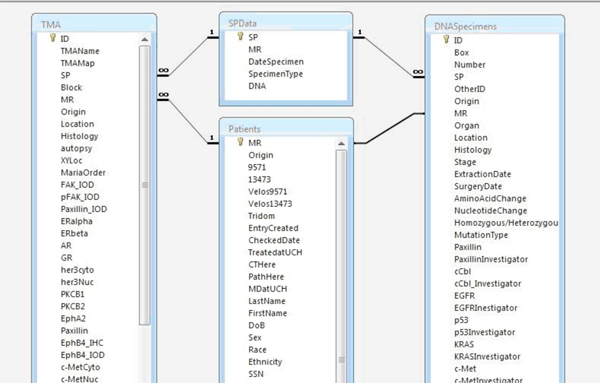
Each table is assigned a primary key, which serves as a unique identifier for each entry within the table. By definition, a unique identifier value cannot be repeated. For example, within the Patients table, the primary key is the medical record number since a MRN can only signify one unique individual. Within the Sample Data table, the primary key is the sample pathology (SP) number. As the TMA and DNA Specimens tables did not have unique identifiers, a dummy number was established as the primary key. The TMA and DNA tables were then linked to the other tables using the MRN and the SP numbers, respectively. This ensures that each TMA punch and DNA specimen are linked back to both specific information on the sample and clinical information from the donating patient.
In Microsoft Access, individual tables are linked via their primary keys such that logical relationships are established (Fig 3). These relationships are necessary to generate queries where data is gathered from multiple tables.
7. Querying:
Performing a query of related sets of data is relatively simple within Microsoft Access. A query can be designed by selecting the "query design option" under the create tab.
Tables including the fields of interest are selected and displayed.
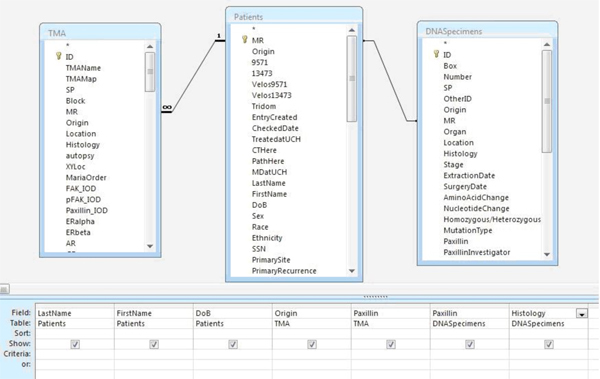
Variables from the tables of interest are selected and, if necessary, can be filtered based on the researcher's criteria of interest (Fig 4).
The query can then be run, resulting in the desired fields listed in spreadsheet form.
8. Exporting Data:
Once a query has been generated, the data can be exported. While most researchers prefer the data to be in the form of a Microsoft Excel spreadsheet, data can be exported to a number of other programs using the export menu under the "external data" tab. Data can be saved using the appropriate file extension.
When the data is exported for statistical purposes, a prescribed set of variables are included in the export so that a comprehensive analysis can be done to control for covariates.
9. Importing Data:
Importing the data requires a perfect match between the format of the imported data and the format of the table in Access. The variables of interest within the table to import must have the same names as the Access table. The spelling must be exact and there cannot be spaces where spaces do not exist in the Access table.
Once symmetry between the two tables is attained, the user has the ability to use an append or update query to import the data into Access. An append query will allow the user to add new rows of data into the Access database. For example, if information is available about patients that were not already in the database, an append query could be used to add those patients. However, if new data is available on patients or specimens that need to be modified, an update query must be performed on those entries.
10. Updating the Database:
Members of the database project have prescribed roles in ensuring that the database is kept current. One full-time employee is tasked with regularly populating and updating the database with clinical information based on patients who have been consented in clinic.
Another full time employee, serving as the data manager, is charged with obtaining laboratory data as it becomes available and inputting this information into the database with an update or append query.
Research assistants who are trained in the protocol are responsible for performing a systematic update of the database every six months to obtain the most recent data available. This is particularly important for fields such as vital status and date of last contact, as these fields have a direct impact on survival analyses performed on the data.
11. Access to the Database:
The database is only accessible to individuals who are HIPAA compliant and are included under the IRB protocol. Access is further reduced to individuals trained in Microsoft Access and who have direct responsibilities for updating or modifying the data.
Researchers who have contributed to the database may request information from the database from the data manager, but they themselves are not permitted to access the data directly.
The data manager provides de-identified information to the requesting researchers by removing variables such as the medical record number and the patient's name when generating an export query.
12. Representative Results:
A researcher may be interested in knowing the clinical significance of over-expression of the protein Paxillin in non-small cell lung cancer. As this researcher has generated a great deal of TMA data in the database for Paxillin, the data manager approves the researcher's request to access clinical information to correlate with the laboratory data. The data manager runs a query where he combines both the Patients Table and the TMA Table. Variables of interest from the Patients table include the patient's date of birth, their race, the histology of their cancer, the stage of their cancer, their date of diagnosis, their vital status, their date of death, and their date of last contact. Using these variables, such as age at diagnosis and stage, important confounders can be accounted for and controlled. From the TMA table, important information such as the tumor type and the protein expression can be ascertained.
As the two tables are linked via the medical record number, patient information from individuals whose tumors have been studied for Paxillin expression are included in the output. The results can be filtered so that only patients with non-small cell lung cancer are displayed. The results can be further refined based on the needs of the researcher.
These results can be exported for primary data analysis by the biostatistician and the results are then shared with the researcher.
Project home page: Access Database template and Standard Operating Procedure are available at: http://www.ibridgenetwork.org/uctech/salgia-thoracic-oncology-access-template
License: Freely available for academic and non-profit use.
Restrictions to use by non-academics: Commercial users require a license. For questions regarding commercial uses, please contact The University of Chicago's Office of Technology and Intellectual Property (UChicagoTech) at (773) 702-1692 or www.tech.uchicago.edu
 Figure 1. A screenshot of the Access Database depicting a section of the Patients Table.
 Figure 2. Schematic depicting a tissue microarray (TMA)2
 Figure 3. Screenshot depicting relationships established among tables within the Access database. Tables are linked via primary keys.
 Figure 4. Sample query for Paxillin mutation, TMA results, and clinical variables.
Disclosures
No conflicts of interest declared.
Acknowledgments
This work was supported by NIH grants 5R01CA100750-07, 5R01CA125541-04, 3R01CA125541-03S1, 5R01CA129501-03, 3R01CA129501-02S1 to RS
References
- Adamski J, Finnegan K. Boston: Course Technology; 2007. New Perspectives on Microsoft Office Access. [Google Scholar]
- Giltnane J, Rimm D. Technology Insight: Identification of biomarkers with tissue microarray technology. Nat Clin Pract Oncol. 2004;1:104–111. doi: 10.1038/ncponc0046. [DOI] [PubMed] [Google Scholar]


