Abstract
Quantitative analysis of Ca2+ fluctuations in the endoplasmic/sarcoplasmic reticulum (ER/SR) is essential to defining the mechanisms of Ca2+-dependent signaling under physiological and pathological conditions. Here, we developed a unique class of genetically encoded indicators by designing a Ca2+ binding site in the EGFP. One of them, calcium sensor for detecting high concentration in the ER, exhibits unprecedented Ca2+ release kinetics with an off-rate estimated at around 700 s−1 and appropriate Ca2+ binding affinity, likely attributable to local Ca2+-induced conformational changes around the designed Ca2+ binding site and reduced chemical exchange between two chromophore states. Calcium sensor for detecting high concentration in the ER reported considerable differences in ER Ca2+ dynamics and concentration among human epithelial carcinoma cells (HeLa), human embryonic kidney 293 cells (HEK-293), and mouse myoblast cells (C2C12), enabling us to monitor SR luminal Ca2+ in flexor digitorum brevis muscle fibers to determine the mechanism of diminished SR Ca2+ release in aging mice. This sensor will be invaluable in examining pathogenesis characterized by alterations in Ca2+ homeostasis.
Keywords: biosensor, calcium signaling, imaging
Ca2+ is the most ubiquitous signaling molecule in living organisms, regulating numerous biological functions. The endoplasmic/sarcoplasmic reticulum (ER/SR) lumen, which occupies less than 10% of cell volume, stores >90% of intracellular Ca2+ and is pivotal in controlling Ca2+ signaling (1–3). A Ca2+ indicator to monitor ER/SR Ca2+ concentration with fast-release kinetics, especially in excitable cells, is thus highly desirable (4–7).
The initial measure of ER Ca2+ dynamics was achieved using the Ca2+ dye Mag-fura-2 in plasma membrane-permeabilized live cells (8). In contrast to Ca2+ dyes, fluorescent protein (FP)-based Ca2+ indicators with genetically encoded chromophores can detect Ca2+ signaling in subcellular organelles with high spatial and temporal resolution (9). They consist of a Ca2+-modulated protein, either calmodulin or troponin C (9–11), coupled to a single FP to generate sensors, such as GCaMP (an abbreviation of the fusion protein containing the calmodulin-binding domain from the myosin light chain kinase also called M13 peptide, the circularly permutated green fluorescent protein, and the calmodulin) (12–14), or dual FPs, such as Cameleon (9). Modifying Cameleon at its Ca2+ binding loops or calmodulin's peptide interaction surface generated several ER/SR sensors (9, 15–17), which have been applied to excitable cells with some limitations (18). Directly monitoring fast ER/SR Ca2+ dynamics in excitable cells is still new territory.
The need for better Ca2+ sensors targeted to cellular compartments with a high putative Ca2+ concentration, such as the ER/SR, is pressing. We need a fast and accurate way to monitor ER Ca2+ concentration, particularly new Ca2+ sensors that overcome current limitations to answer long-standing questions, such as how fast ER Ca2+ depletion occurs in response to physiological stimulation and how to identify specific Ca2+ pathways involved in disease states. Peak cytosolic Ca2+ transients evoked by sarcolemmal depolarization have been shown to decrease with age; however, whether this decrease can be explained by altered ER Ca2+ concentration or Ca2+ release is unknown because of the limitations of current Ca2+ sensors.
Here, we created a single-wavelength Ca2+ sensor with sufficient dynamic range. The sensor's optical properties and Ca2+ binding affinity are modulated by charged residues introduced into EGFP as Ca2+ binding ligands. Ca2+ binding results in enhanced fluorescence, fast off-rate kinetics, and reproducible signals from cell to cell. This sensor enabled a direct demonstration that impaired ER Ca2+ release occurs in the absence of significant changes in resting ER Ca2+ concentration attributable to aging.
Results and Discussion
Ca2+-Induced Changes in the Calcium Sensor for Detecting High Concentration in the ER's Optical Properties.
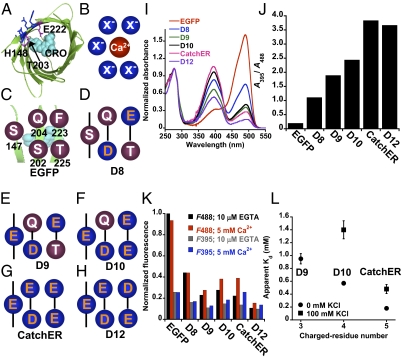
The model structure of our designed Ca2+ sensor, the calcium sensor for detecting high concentration in the ER (CatchER), was based on the scaffold protein EGFP. The binding site is adjacent to the chromophore (right on top of the Y66 phenolic oxygen) and next to H148, T203, and E222 (Fig. 1A); its fluorescence sensitivity may be attributable to hydrogen-bond interaction (19, 20). The X-ray crystal structure shows mutated residue side chains protruding from the protein surface, providing access to solvents (21, 22). This putative Ca2+ binding site is formed by residues 147, 202, 204, 223, and 225, which confer Ca2+-preferred geometric properties (Fig. 1B). Five variants were created by introducing charged residues in these positions (Fig. 1 D–H).
Fig. 1.
Proposed schematic structure and in vitro optical properties of designed Ca2+ biosensor variants. (A) Truncated structure of WT EGFP (1EMA) with the chromophore (CRO) highlighted as cyan spheres. Residue 147, 202, 204, 223, and 225 side chain (blue), protruding from the surface in close proximity to the chromophore, were mutated to form the Ca2+ binding ligands. Key residues H148, T203, and E222, involved in proton interaction with the chromophore, were located near the designed Ca2+ binding site. (B) Spatial distribution of the five residues (blue) that are responsible for Ca2+ chelation. (C) Spatial organization of these residues and their relationship with the chromophore in the EGFP molecule, which shows nonacidic residues. (D–H) Constructs D8, D9, D10, CatchER, and D12 show replacement at residues S147, S202, Q204, F223, and T225, respectively. (I) Absorbance spectra of WT EGFP and Ca2+ sensors D8–D12, with a normalized absorbance peak at 280 nm. The designed proteins exhibited a major absorbance peak at 398 nm and a lower peak at 490 nm. (J) Absorbance intensity ratio at 395 nm and 488 nm for all designed sensors and WT EGFP. The ratio increased with the number of negatively charged residues introduced. (K) Change in fluorescence intensity of EGFP variants in response to Ca2+ recorded at 510-nm emission and 488/395-nm excitation with either 10 μM EGTA (black/gray bars) or 5 mM Ca2+ (red/blue bars). The protein concentration of all variants was determined by an extinction coefficient of 21,890 cm−1⋅M−1 at 280 nm. EGFP emission maxima at 510 mm excited at 488 nm in the presence of 10 μM EGTA were normalized to 1.0. (L) Correlation between the number of negatively charged residues and apparent Ca2+ Kds for D9, D10, and CatchER, measured by fluorescence titration in 10 mM Tris buffer (pH 7.4) in the presence (■) and absence (•) of 100 mM KCl.
CatchER (D11) and its variants (D8–D10 and D12) were bacterially expressed and purified using established methods (23–25). Introducing acidic ligand residues added an absorption maximum of 398 nm at the expense of the 490-nm peak (Fig. 1I). This EGFP feature is associated with predominance of the anionic chromophore. The ratio of absorption maxima of 395 nm to that of 488 nm increases from 0.2 for EGFP with no charged residue to 2.3 for D10 with four acidic residues (Fig. 1J). A fluorescence maximum of 510 nm excited at 488 nm parallels the absorbance maxima (Fig. S1 A–L).
Ca2+ binding to CatchER and its variants D9 and D10 increased absorbance at 490 nm and decreased absorbance at 398 nm (Fig. S1 C–E and M), suggesting that Ca2+ binding increases the anionic chromophore. In contrast, a 510-nm emission maximum increased when excited at both 395 and 488 nm (Fig. S1 I–K and M). Among all variants, CatchER had the largest fluorescence enhancement (∼80%) on Ca2+ binding (Fig. 1K and Fig. S1N) and attained ∼50% of EGFP fluorescence intensity. D8's fluorescence response is negligible, possibly because it has few ligand residues and low Ca2+ binding affinity.
Metal binding assisted chromophore formation, as shown by a 0.7-unit decrease in CatchER's pKa in the presence of Ca2+ (Fig. S2A) for a value of 6.9, which is closer to that for EGFP. Ca2+ binding reverses changes in fluorescence properties associated with adding charged ligand residues, presumably because it neutralizes the excess negative charge while enhancing fluorescence when excited at 488 and 395 nm. Taken together, these results suggest a unique mechanism for CatchER involving a concomitant recovery of fluorescence and a switch in the chromophore's ionic form.
Metal Binding Properties.
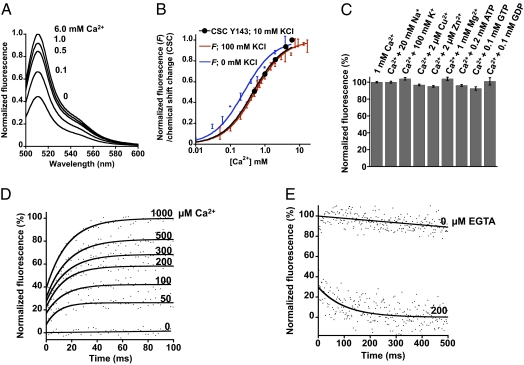
Several lines of evidence support a simple CatchER-Ca2+ stoichiometry reaction. The Job Plot suggests that Ca2+ forms a 1:1 complex with CatchER (Fig. S2), and the fluorescence change in response to Ca2+ titration can be fitted to a 1:1 binding equation (Fig. 2B). The equilibrium dialysis experiments using myoglobin (noncalcium-binding protein), EGFP (noncalcium-binding protein), CatchER, and α-lactalbumin [Ca2+-binding protein with reported Kd = 10−9 M (26)] with Ca2+ demonstrate that CatchER binds Ca2+ with weak affinity (Fig. S3).
Fig. 2.
Optical characterization of CatchER in vitro. (A) Emission spectra in response to increased Ca2+ concentrations. (B) Apparent CatchER Kd determined by fluorescence response in the presence (red) or absence (blue) of 100 mM KCl or by a main chain chemical shift change of residue Y143 in HSQC spectra in the presence of 10 mM KCl (black). Titration results were fitted to a 1:1 binding mode. (C) Fluorescence responses of various physiological molecules: 20 mM Na+, 100 mM K+, 2 μM Cu2+, 2 μM Zn2+, 1 mM Mg2+, 0.2 mM ATP, 0.1 mM GTP, and 0.1 mM GDP in the presence of 1 mM Ca2+. Values were normalized to 1 mM Ca2+ in the absence of other metals. The fluorescence was recorded with emission maxima at 510 nm excited at 488 nm. (D) Stopped-flow fluorescence using 10 μM CatchER at various Ca2+ concentrations recorded at 395-nm excitation. CatchER's fluorescence response in 0 mM Ca2+ was measured as the baseline. (E) Stopped-flow traces showing decreased fluorescence on rapid mixture of Ca2+-loaded CatchER with 200 μM EGTA. All measurements were conducted in 10 mM Tris (pH 7.4) at 25 °C. A 455-nm long-pass filter was applied to collect emission fluorescence with maximal emission at 510 nm.
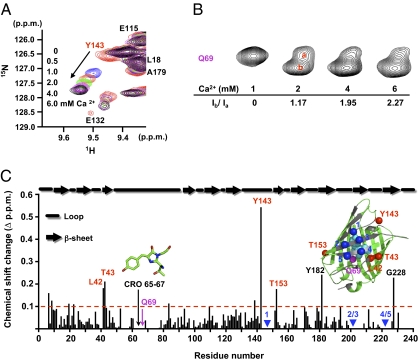
Ca2+-induced chemical shift changes of several residues close to the designed CatchER's Ca2+ binding site (Fig. 3 A and C) can also be fitted to a 1:1 binding process, with Kd values consistent with those determined by fluorescence change. CatchER exhibits the strongest Ca2+ binding affinity, with an apparent Kd of 0.18 ± 0.02 mM, whereas D9 has the weakest, with an apparent Kd of 0.95 ± 0.08 mM in 10 mM Tris (pH 7.4) (Fig. 1L). CatchER's dissociation constant increases to 0.48 ± 0.07 mM in the presence of 100 mM KCl, consistent with Ca2+ electrostatic interaction. Na+, K+, Cu2+, Zn2+, Mg2+, ATP, GTP, and GDP cannot compete with Ca2+ for binding CatchER (Fig. 2C), which demonstrates its good selectivity.
Fig. 3.
Structural properties of CatchER assessed with NMR. (A) Representative chemical shift of cross-peak Y143 at [Ca2+] = 0, 0.5, 1, 2, 4, and 6 mM. Overlaid 2D [1H-15N] HSQC spectra of 0.3 mM CatchER in response to Ca2+. (B) Q69 chemical shift perturbation induced by Ca2+ titration. A minor peak was separated from the original single peak after adding 2 mM Ca2+, and the ratio of integration of peak b to peak a increased from 0 to 2.27 as the Ca2+ concentration increased from 1 to 6 mM. (C) Combined chemical shift changes in combining a backbone amide proton and nitrogen between the Ca2+-saturated and Ca2+-free forms. Ca2+ influences the residues interacting with the chromophore or close to the designed Ca2+ binding site. In addition, Y182, highly accessible to solvents, and G228 in the flexible C terminal exhibited more than a 0.2-ppm change in chemical shift. The secondary structure of CatchER, according to EGFP, was labeled at the top. All data were recorded at 37 °C using a 600-MHz NMR spectrometer with 300-μM 15N-labeled samples in 10 mM Tris, 10 mM KCl (pH 7.4).
In Vitro Kinetic Properties of CatchER.
First, we used a stopped-flow spectrophotometer to record fluorescence changes on mixing 10 μM CatchER with various Ca2+ concentrations. Baseline corresponded to CatchER mixed with Ca2+-free buffer. From 40–60% of the initial fluorescence increase occurred within the lag-time of the stopped-flow spectrophotometer (i.e., 2.2 ms; Fig. 2D). A plot of ΔF, the amplitude of the fluorescence change, as a function of Ca2+ concentration yielded a hyperbolic pattern, where the Kd value of 0.19 ± 0.02 mM (Fig. S1O) was in reasonable agreement with the Kd value of 0.18 ± 0.02 mM determined by fluorescence equilibrium titration in the same condition (Fig. 1L). The observed rate constants were independent of [Ca2+] between 50 and 1,000 μM, with an average value of 73 ± 16 s−1.
Second, we measured the CatchER/Ca2+ off-rate by directly monitoring changes in the fluorescence signal after equilibrating 10 μM CatchER with 10 μM Ca2+ plus EGTA. About 70% of the fluorescence change was completed within the instrument lag-time (2.2 ms), consistent with very fast Ca2+ release. If two half-lives would be required to complete 75% of a first-order process of the type required for Ca2+ release from CatchER, the dissociation rate constant koff value of ∼700 s−1 can be estimated from the data in Fig. 2E (SI Materials and Methods). To our knowledge, CatchER exhibits the fastest off-rate of all reported Ca2+ sensors.
Structural Analysis of Ca2+-CatchER Interaction by High-Resolution NMR.
After introducing the designed Ca2+ binding site, residues, such as Y143 or T153 near binding sites or V68 around the chromophore, exhibited more than a 1.5-ppm change, whereas most residues had less than a 0.4-ppm change in alpha carbon Cα chemical shift between CatchER and EGFP (27) (Fig. S4C). This finding suggests that adding charged ligand residues changes local chromophore conformation, reduces fluorescence, and shifts the chromophore's ionic state toward its neutral state.
Using dynamic NMR, we determined that the designed Ca2+ sensor remains monomeric in solution (Fig. S5). Ca2+ binding leads to significant chemical shift changes in the heteronuclear single quantum coherence (HSQC) spectra of the T153, Y143, L42, and T43 residues located near the designed Ca2+ binding site (Fig. 3C). Note that the main chain of Y143 close to the designed site showed the largest shift. These chemical shifts were fitted to a 1:1 binding equation with a Kd value in agreement with that determined by fluorescence measurements (Fig. 2B), suggesting high correlation between these residues. On the other hand, residues R96, Q94, F165, and V61, which protrude toward the chromophore but away from the designed Ca2+ binding site, showed no significant chemical shift changes (Fig. S4), indicating that Ca2+ binds specifically to the designed site.
NMR can further reveal Ca2+-induced chromophore change, despite the lack of chromophore signal in the HSQC spectra. Q69 is buried inside the protein and forms hydrogen bonds with the chromophore. Its single resonance gradually becomes two with the addition of Ca2+ (Fig. 3B), suggesting that Ca2+ binding converts Q69 from a fast-exchange state to two different slow-exchange conformations. The hydrogen bond formed between E222's carboxyl group and the chromophore's phenolic oxygen is crucial to its fluorescence intensity; this residue forms a main-chain hydrogen bond with L42 in the reported WT EGFP X-ray structure (PDB ID code 1EMA) (21). L42 also exhibits a significant Ca2+-induced chemical shift change. From absorbance and fluorescence studies and high-resolution NMR, we can attribute the enhancement in Ca2+-induced fluorescence with fast kinetics to a local conformational change close to the designed Ca2+ binding site, which slows down the chemical exchange between two chromophore ionic states (kindle fluorescence by metal binding). Additionally, the fluorescence change via direct metal interaction is likely to be faster than indirect interactions via conformational changes. Ca2+ binding-induced fluorescence changes also bypass the slow rate between ionic states, as we observed for G1 (24), which sets our designed sensor apart from GCaMP, although both exhibit a similar fluorescence enhancement at 488 nm in response to Ca2+.
ER Ca2+ Concentration and Release in Various Cell Types.
CatchER was fused with the calreticulin signal peptide and KDEL at the scaffold EGFP N or C terminus, respectively, to target it to the ER (Fig. 4C). Confocal microscopy of CatchER and the ER-tracker DsRed2-ER colocalized in HEK-293 and C2C12 cells, further confirming CatchER's targeting specificity to the ER (Fig. S6).
Fig. 4.
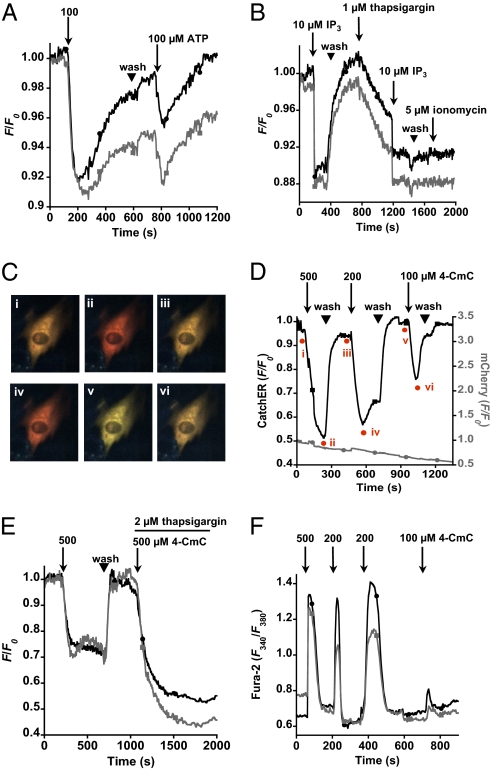
C2C12 myoblast ER Ca2+ dynamics monitored with CatchER. (A) Two representative fluorescence responses (shown in black and gray lines, respectively), evoked by 100 μM ATP (pH 7.0) twice (arrow) and separated by Ringer buffer washout (▼), to intact myoblasts. (B) Same batch of cells was permeabilized with 25 μM digitonin in intracellular buffer applied for 3 min and sequentially treated with IP3 (arrow), intracellular buffer washout (wash; ▼), thapsigargin (arrow), IP3 (arrow), wash (▼), and ionomycin (arrow). (C) (i–vi) Representative fluorescent imaging of C2C12 coexpressing CatchER (green) and mCherry-ER (red) measured in D. (D) CatchER (black) and mCherry-ER (gray) fluorescence response to 4-CmC application. Time points of corresponding imaging in C are marked in red. (E) 4-CmC evoked Ca2+ release in the absence and presence of thapsigargin. (F) 4-CmC evoked cytosolic Ca2+ changes detected by Fura-2.
To determine CatchER's Ca2+ binding affinity, we exposed permeabilized C2C12 myoblasts to increasing Ca2+ concentrations as described (6, 28). CatchER's Kd was 1.07 ± 0.26 mM in baby hamster kidney cells (BHK-21) cells and 1.09 ± 0.20 mM in C2C12 cells (Fig. S7C). The fluorescence intensity at the end of the experiment was fully recovered to the value before calibration (Fig. S7 A and B), which demonstrates that CatchER was not washed out in permeabilized BHK-21 and C2C12 cells, further supporting its targeting to and retention in the ER. A discrepancy in the Kd measured in test tubes and in situ is usual for both synthetic and genetically encoded indicators (29). The resting ER Ca2+ concentration in HeLa, HEK-293, and C2C12 cells was 396 ± 13 μM (n =7), 742 ± 134 μM (n = 5), and 813 ± 89 μM (n = 11), respectively, in agreement with reported ER Ca2+ concentrations of 100–900 μM using several Cameleon-based ER sensors (16, 30–32).
We measured ER Ca2+ release evoked by ATP in intact C2C12 myoblast cells (Fig. 4A), and the same cell batches were permeabilized by digitonin to detect inositol triphosphate (IP3)-induced Ca2+ signaling (Fig. 4B). Fluorescence recovered when IP3 was washed away, and adding thapsigargin slowed the decrease in ER Ca2+ concentration. Again adding IP3 caused fluorescence to decrease rapidly to the plateau as before, and no recovery was observed after washing, suggesting that thapsigargin completely inhibited the sarco/endoplasmic reticulum Ca2+-ATPase (SERCA) pumps.
CatchER can detect Ca2+ release through the ryanodine receptor elicited by 4-chloro-m-cresol (4-CmC) in intact cells. In contrast, no drug-related response was observed for mCherry coexpressed in the ER (Fig. 4C and D). Cytosolic Ca2+ was monitored in C2C12 myoblasts using Fura-2 (33) (Fig. 4F). The 4-CmC elicited a concentration-dependent SR Ca2+ depletion, whereas adding 500 μM 4-CmC and 2 μM thapsigargin together induced full SR Ca2+ depletion (Fig. 4E). CatchER reports ER Ca2+ release in excitable and nonexcitable cells, such as HeLa and HEK-293, in response to ATP, histamine, thapsigargin, and cyclopiazonic acid (Fig. S7 E–G and J).
SR Ca2+ Release in Adult and Aging Skeletal Muscle.
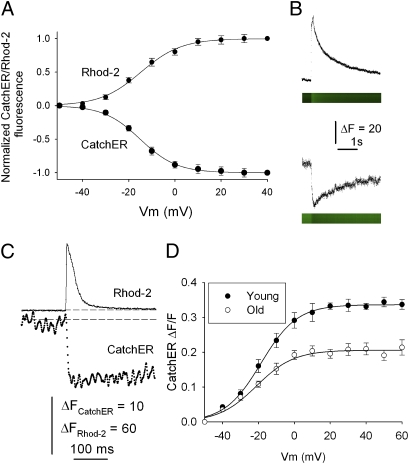
To test the in vivo Ca2+ sensing capability, we first recorded mouse muscle SR Ca2+ release 3–4 wk after in vivo electroporation of CatchER into flexor digitorum brevis myofibers in comparison to Cameleon-based SR sensor (Fig. S8 and Table S1). The voltage-dependent maximal increase or decrease in fluorescence occurred on Ca2+ binding to Rhod-2 or dissociation from CatchER (Fig. 5 A and B), respectively (SI Materials and Methods). CatchER detects SR Ca2+ depletion in response to an action potential (Fig. 5C). It enabled a direct demonstration that resting SR Ca2+ concentrations are similar in young and old mice, although SR Ca2+ release diminishes significantly in old mice (Fig. 5D). Impaired SR Ca2+ release but preserved SR Ca2+ content supports the excitation-contraction uncoupling mechanism in aging muscle fibers (34).
Fig. 5.
SR and cytosolic Ca2+ transients recorded in CatchER-expressing mouse flexor digitorum brevis (FDB) fibers loaded with Rhod-2/EGTA. (A) Normalized SR and cytosolic fluorescence transients elicited by 100-ms command pulses at various voltages in FDB fibers under patch-clamp. Normalized Rhod-2/EGTA and CatchER fluorescence, recorded in the same fiber, were plotted arbitrarily as positive (increased cytosolic Ca2+ concentration) and negative (decreased SR Ca2+ concentration) signals, respectively, to compare their relative amplitude and voltage dependence. Data points were fitted to a Boltzmann equation of the form: F = Fmax/[1 + exp(VF1/2 − Vm)/K], where F is the fluorescence intensity, Fmax is the maximal fluorescence, V1/2 is the fluorescence half-activation potential, Vm is the membrane potential, and K is the steepness of the curve. VF1/2 and K values were −14.7 mV and 8.7, respectively, for Rhod-2 and −15.1 mV and 7.9, respectively, for CatchER (n = 7). The amplitude of the signal was measured from onset (average of the first 10 points immediately before applying the command pulse) to peak (Rhod-2) or nadir (CatchER). A steep increase in Ca2+ flux into the cytosolic compartment (Rhod-2) in response to 100-ms pulses (at various voltages ranging from −30 to +40 mV) was observed concomitant with a decrease in the SR lumen (CatchER). The fluorescence changes were voltage-dependent, reaching a plateau at about +20 mV. (B) Representative Rhod-2/EGTA (Upper) and CatchER (Lower) intensity profiles and their confocal line scans in response to 100-ms/40-mV pulses are displayed. (C) CatchER and Rhod-2 fluorescence in response to a single 0.5-ms pulse under field stimulation and displayed in the same time scale. Dashed lines indicate basal fluorescence. (D) Voltage-dependence of SR luminal CatchER fluorescence recorded in young and old mouse muscle fibers. Fmax, VF1/2, and K values (expressed as mean ± SEM) were 0.34 ± 0.03, −18.6 ± 0.5, and 10.1 ± 0.5 for young mice (n = 21) and 0.20 ± 0.04 (P < 0.01), −21.1 ± 1.3 (not significant), and 10.4 ± 1.15 (not significant) for old mice (n = 24), respectively. Basal SR Ca2+ concentration (mean ± SEM) was 512 ± 46 μM (n = 11) and 573 ± 55 μM (n = 8) (not significant) for young and old mice, respectively. The conversions of fluorescence data into Ca2+ concentration is described in SI Materials and Methods.
Conclusion
In conclusion, spectroscopic, kinetic, and structural studies show that CatchER has several unique merits, including a previously undescribed kindle mechanism, tunable and optimal metal binding affinity without complicated cooperative binding activity, an unprecedented off-rate, and a simple calibration equation. Its designed calcium binding domain negligibly perturbs natural SR Ca2+ signaling, and its intrinsic low Ca2+ binding affinity eliminates the possibility of Ca2+ buffering capacity. CatchER, the smallest genetically encoded Ca2+ biosensor, allowed us to examine SR Ca2+ in various cell types and to define the aging-related coupling of sarcolemmal excitation and SR Ca2+ release without a decrease in Ca2+ concentration in myofibers.
Supplementary Material
Acknowledgments
We thank Dan Adams, Bob Whohulter, Florence Reddish, Yubin Zhou, Ning Chen, Hsiau-wei Lee, Michael Gross, Chen Zhang, Yusheng Jiang, Malcolm Delgado, Aldebaran Hofer, and Stephen Finnegan for their critical review and assistance, and Ramon Jimenez-Moreno for performing D1ER experiments. This work is supported, in part, by National Institutes of Health Grants GM081749 and EB007268 and a Georgia State University Brain and Behavior seed grant (to J.J.Y.), as well as by a Georgia State University Brain and Behavior fellowship (to S.T.). It is also supported, in part, by National Institutes of Health Grants AG13934, AG33385, and AG15820; Muscular Dystrophy Association Grant 33149 (to O.D.); and Wake Forest University Pepper Older Americans Independence Center Grant P30-AG21332.
Footnotes
The authors declare no conflict of interest.
*This Direct Submission article had a prearranged editor.
This article contains supporting information online at www.pnas.org/lookup/suppl/doi:10.1073/pnas.1103015108/-/DCSupplemental.
References
- 1.Clapham DE. Calcium signaling. Cell. 2007;131:1047–1058. doi: 10.1016/j.cell.2007.11.028. [DOI] [PubMed] [Google Scholar]
- 2.Berridge MJ. Inositol trisphosphate and calcium oscillations. Biochem Soc Symp. 2007;74:1–7. doi: 10.1042/BSS0740001. [DOI] [PubMed] [Google Scholar]
- 3.Hogan PG, Lewis RS, Rao A. Molecular basis of calcium signaling in lymphocytes: STIM and ORAI. Annu Rev Immunol. 2010;28:491–533. doi: 10.1146/annurev.immunol.021908.132550. [DOI] [PMC free article] [PubMed] [Google Scholar]
- 4.Golovina VA, Blaustein MP. Spatially and functionally distinct Ca2+ stores in sarcoplasmic and endoplasmic reticulum. Science. 1997;275:1643–1648. doi: 10.1126/science.275.5306.1643. [DOI] [PubMed] [Google Scholar]
- 5.Launikonis BS, et al. Confocal imaging of [Ca2+] in cellular organelles by SEER, shifted excitation and emission ratioing of fluorescence. J Physiol. 2005;567:523–543. doi: 10.1113/jphysiol.2005.087973. [DOI] [PMC free article] [PubMed] [Google Scholar]
- 6.Rudolf R, Magalhães PJ, Pozzan T. Direct in vivo monitoring of sarcoplasmic reticulum Ca2+ and cytosolic cAMP dynamics in mouse skeletal muscle. J Cell Biol. 2006;173:187–193. doi: 10.1083/jcb.200601160. [DOI] [PMC free article] [PubMed] [Google Scholar]
- 7.Jaepel J, Blum R. Capturing ER calcium dynamics. Eur J Cell Biol. 2011;90:613–619. doi: 10.1016/j.ejcb.2011.02.010. [DOI] [PubMed] [Google Scholar]
- 8.Hofer AM, Machen TE. Technique for in situ measurement of calcium in intracellular inositol 1,4,5-trisphosphate-sensitive stores using the fluorescent indicator mag-fura-2. Proc Natl Acad Sci USA. 1993;90:2598–2602. doi: 10.1073/pnas.90.7.2598. [DOI] [PMC free article] [PubMed] [Google Scholar]
- 9.Miyawaki A, et al. Fluorescent indicators for Ca2+ based on green fluorescent proteins and calmodulin. Nature. 1997;388:882–887. doi: 10.1038/42264. [DOI] [PubMed] [Google Scholar]
- 10.Heim N, Griesbeck O. Genetically encoded indicators of cellular calcium dynamics based on troponin C and green fluorescent protein. J Biol Chem. 2004;279:14280–14286. doi: 10.1074/jbc.M312751200. [DOI] [PubMed] [Google Scholar]
- 11.Mank M, et al. A genetically encoded calcium indicator for chronic in vivo two-photon imaging. Nat Methods. 2008;5:805–811. doi: 10.1038/nmeth.1243. [DOI] [PMC free article] [PubMed] [Google Scholar]
- 12.Nakai J, Ohkura M, Imoto K. A high signal-to-noise Ca2+ probe composed of a single green fluorescent protein. Nat Biotechnol. 2001;19:137–141. doi: 10.1038/84397. [DOI] [PubMed] [Google Scholar]
- 13.Wang Q, Shui B, Kotlikoff MI, Sondermann H. Structural basis for calcium sensing by GCaMP2. Structure. 2008;16:1817–1827. doi: 10.1016/j.str.2008.10.008. [DOI] [PMC free article] [PubMed] [Google Scholar]
- 14.Tian L, et al. Imaging neural activity in worms, flies and mice with improved GCaMP calcium indicators. Nat Methods. 2009;6:875–881. doi: 10.1038/nmeth.1398. [DOI] [PMC free article] [PubMed] [Google Scholar]
- 15.Palmer AE, et al. Ca2+ indicators based on computationally redesigned calmodulin-peptide pairs. Chem Biol. 2006;13:521–530. doi: 10.1016/j.chembiol.2006.03.007. [DOI] [PubMed] [Google Scholar]
- 16.Palmer AE, Jin C, Reed JC, Tsien RY. Bcl-2-mediated alterations in endoplasmic reticulum Ca2+ analyzed with an improved genetically encoded fluorescent sensor. Proc Natl Acad Sci USA. 2004;101:17404–17409. doi: 10.1073/pnas.0408030101. [DOI] [PMC free article] [PubMed] [Google Scholar]
- 17.Ishii K, Hirose K, Iino M. Ca2+ shuttling between endoplasmic reticulum and mitochondria underlying Ca2+ oscillations. EMBO Rep. 2006;7:390–396. doi: 10.1038/sj.embor.7400620. [DOI] [PMC free article] [PubMed] [Google Scholar]
- 18.Jiménez-Moreno R, Wang ZM, Messi ML, Delbono O. Sarcoplasmic reticulum Ca2+ depletion in adult skeletal muscle fibres measured with the biosensor D1ER. Pflugers Arch. 2010;459:725–735. doi: 10.1007/s00424-009-0778-4. [DOI] [PMC free article] [PubMed] [Google Scholar]
- 19.Barondeau DP, Kassmann CJ, Tainer JA, Getzoff ED. Structural chemistry of a green fluorescent protein Zn biosensor. J Am Chem Soc. 2002;124:3522–3524. doi: 10.1021/ja0176954. [DOI] [PubMed] [Google Scholar]
- 20.Tsien RY. The green fluorescent protein. Annu Rev Biochem. 1998;67:509–544. doi: 10.1146/annurev.biochem.67.1.509. [DOI] [PubMed] [Google Scholar]
- 21.Ormö M, et al. Crystal structure of the Aequorea victoria green fluorescent protein. Science. 1996;273:1392–1395. doi: 10.1126/science.273.5280.1392. [DOI] [PubMed] [Google Scholar]
- 22.Yang W, et al. Design of a calcium-binding protein with desired structure in a cell adhesion molecule. J Am Chem Soc. 2005;127:2085–2093. doi: 10.1021/ja0431307. [DOI] [PubMed] [Google Scholar]
- 23.Heim R, Tsien RY. Engineering green fluorescent protein for improved brightness, longer wavelengths and fluorescence resonance energy transfer. Curr Biol. 1996;6:178–182. doi: 10.1016/s0960-9822(02)00450-5. [DOI] [PubMed] [Google Scholar]
- 24.Zou J, et al. Developing sensors for real-time measurement of high Ca2+ concentrations. Biochemistry. 2007;46:12275–12288. doi: 10.1021/bi7007307. [DOI] [PubMed] [Google Scholar]
- 25.Ziman AP, Ward CW, Rodney GG, Lederer WJ, Bloch RJ. Quantitative measurement of Ca2+ in the sarcoplasmic reticulum lumen of mammalian skeletal muscle. Biophys J. 2010;99:2705–2714. doi: 10.1016/j.bpj.2010.08.032. [DOI] [PMC free article] [PubMed] [Google Scholar]
- 26.Bryant DT, Andrews P. High-affinity binding of Ca2+ to bovine alpha-lactalbumin in the absence and presence of EGTA. Biochem J. 1984;220:617–620. doi: 10.1042/bj2200617. [DOI] [PMC free article] [PubMed] [Google Scholar]
- 27.Khan F, Stott K, Jackson S. 1H, 15N and 13C backbone assignment of the green fluorescent protein (GFP) J Biomol NMR. 2003;26:281–282. doi: 10.1023/a:1023817001154. [DOI] [PubMed] [Google Scholar]
- 28.Tour O, et al. Calcium Green FlAsH as a genetically targeted small-molecule calcium indicator. Nat Chem Biol. 2007;3:423–431. doi: 10.1038/nchembio.2007.4. [DOI] [PMC free article] [PubMed] [Google Scholar]
- 29.Contreras L, Drago I, Zampese E, Pozzan T. Mitochondria: The calcium connection. Biochim Biophys Acta. 2010;1797:607–618. doi: 10.1016/j.bbabio.2010.05.005. [DOI] [PubMed] [Google Scholar]
- 30.Yu R, Hinkle PM. Rapid turnover of calcium in the endoplasmic reticulum during signaling. Studies with cameleon calcium indicators. J Biol Chem. 2000;275:23648–23653. doi: 10.1074/jbc.M002684200. [DOI] [PubMed] [Google Scholar]
- 31.Arnaudeau S, Kelley WL, Walsh JV, Jr, Demaurex N. Mitochondria recycle Ca2+ to the endoplasmic reticulum and prevent the depletion of neighboring endoplasmic reticulum regions. J Biol Chem. 2001;276:29430–29439. doi: 10.1074/jbc.M103274200. [DOI] [PubMed] [Google Scholar]
- 32.Foyouzi-Youssefi R, et al. Bcl-2 decreases the free Ca2+ concentration within the endoplasmic reticulum. Proc Natl Acad Sci USA. 2000;97:5723–5728. doi: 10.1073/pnas.97.11.5723. [DOI] [PMC free article] [PubMed] [Google Scholar]
- 33.Grynkiewicz G, Poenie M, Tsien RY. A new generation of Ca2+ indicators with greatly improved fluorescence properties. J Biol Chem. 1985;260:3440–3450. [PubMed] [Google Scholar]
- 34.Wang ZM, Messi ML, Delbono O. L-Type Ca2+ channel charge movement and intracellular Ca2+ in skeletal muscle fibers from aging mice. Biophys J. 2000;78:1947–1954. doi: 10.1016/S0006-3495(00)76742-7. [DOI] [PMC free article] [PubMed] [Google Scholar]
Associated Data
This section collects any data citations, data availability statements, or supplementary materials included in this article.


