Abstract
The proteome undergoes complex changes in response to disease, drug treatment, and normal cellular signaling processes. Characterization of such changes requires methods for time-resolved protein identification and imaging. Here we describe the application of two reactive methionine (Met) analogues, azidohomoalanine (Aha) and homopropargylglycine (Hpg), to label two protein populations in fixed cells. Reactive lissamine rhodamine (LR), 7-dimethylaminocoumarin (DMAC), and Bodipy-630 (BDPY) dyes were prepared and examined for use in selective dye-labeling of newly synthesized proteins in Rat-1 fibroblasts. The LR and DMAC, but not BDPY, fluorophores were found to enable selective, efficient labeling of subsets of the proteome; cells labeled with Aha and Hpg exhibited fluorescence emission 3- to 7-fold more intense than that of control cells treated with Met. We also examined simultaneous and sequential pulse-labeling of cells with Aha and Hpg. After pulse-labeling, cells were treated with reactive LR and DMAC dyes, and labeled cells were imaged by fluorescence microscopy and analyzed by flow cytometry. The results of these studies demonstrate that amino acid labeling can be used to achieve selective two-color imaging of temporally defined protein populations in mammalian cells.
Metabolic labeling provides a powerful approach to the characterization of changes in the cellular proteome. Proteins in complex biological mixtures can be labeled with ketones1–4, azides5–8, or alkynes9–11 and subsequently affinity-tagged through a variety of bioorthogonal transformations1, 2, 6, 12–16. Metabolic labeling strategies have enabled the identification of proteins containing many different post-translational modifications, including glycosylation17–19, phosphorylation20, 21, farnesylation22, and fatty acylation23–25.
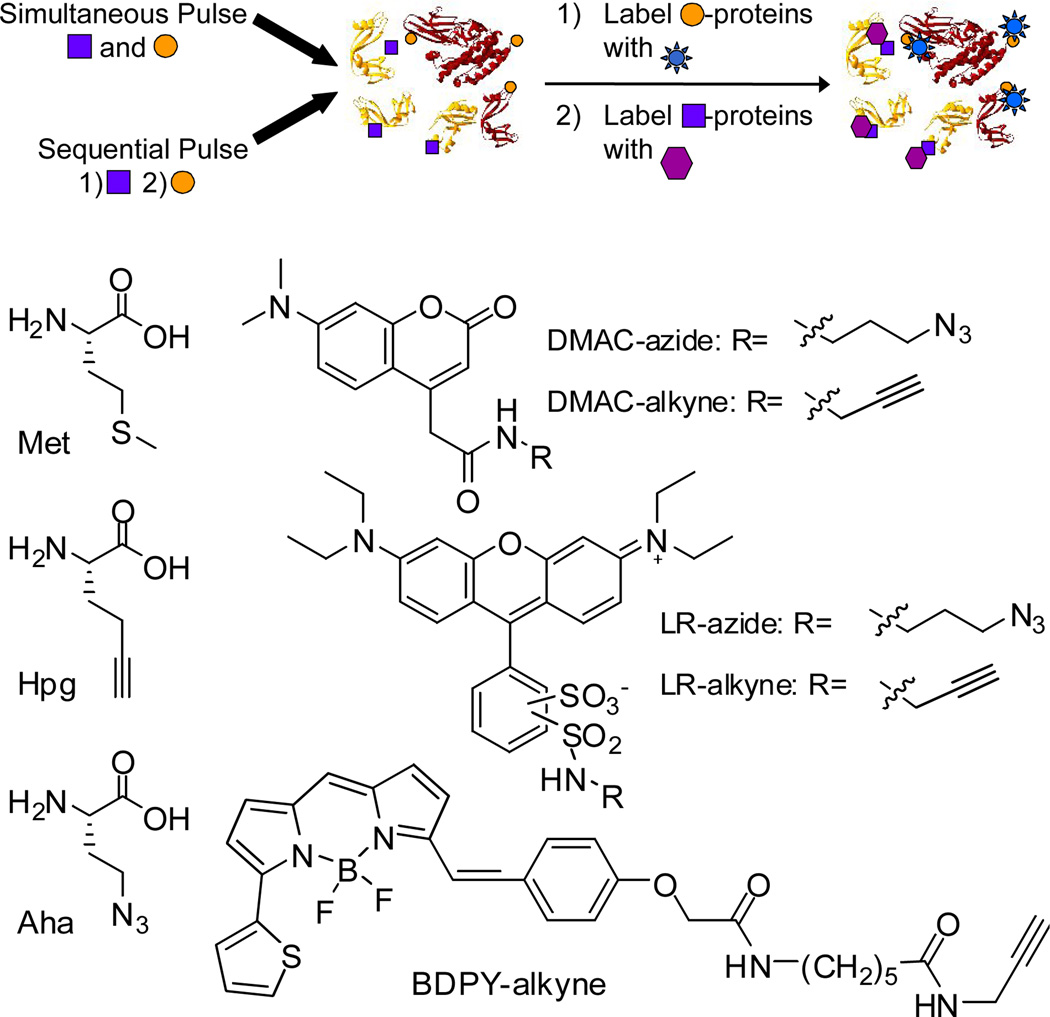
Similarly, reactive amino acid analogues can be used to track spatial and temporal changes in protein synthesis26–31. In previous work, the Met analogues Aha and Hpg were used both to identify32 and to visualize33 temporally defined subsets of the proteome (Scheme 1). The amino acid tagging method is reminiscent of conventional pulse-labeling with radioactive amino acids; the endogenous cellular machinery places a reactive Met analogue at sites normally occupied by Met within polypeptide chains. The newly synthesized proteins, which contain either Aha or Hpg, are then labeled with a fluorophore or affinity purification tag by selective copper-catalyzed azide-alkyne ligation14, 15.
Scheme 1.
Two-dye labeling strategy and structures of Met, Hpg, Aha, and the reactive fluorophores.
Fluorescent proteins or tetracysteine tags can be genetically fused to proteins to enable microscopic analysis of one or more pre-selected proteins inside cells34–36. Genetic fusions have been used to image many cellular processes, including organelle dynamics37, 38 and biogenesis39, protein phosphorylation40, and protein trafficking36, 41. Recently Tsien and coworkers described a new method, “TimeSTAMP”, which can define the age of genetically modified proteins by clever use of drug-controlled, protease cleavage of epitope tags 42.
Two-color labeling of protein populations in cells can provide new insight into global processes that rely on spatial and temporal control of protein synthesis31, such as bacterial infection43, cancer44, or secretion45, 46. The method described here relies on the simultaneous or sequential addition of two distinct reactive metabolites to enable the fluorescent tagging of two protein populations within cells (Scheme 1). The first demonstration of two-dye labeling of metabolically tagged cells was described in 2007 by Chang and coworkers47, who used flow cytometry to show that cells treated with two reactive sugars could be labeled with distinct fluorophores.
Here we report selective fluorophore-labeling of two temporally defined sets of proteins in mammalian cells. We prepared three types of reactive, spectrally distinct fluorophores based on the rhodamine, coumarin, and bodipy dye scaffolds (Scheme 1). The reactive fluorophores were prepared by coupling 3-azidopropylamine48 or propargylamine to commercially available amine-reactive dyes. The combined use of two reactive fluorophores (e.g., LR and DMAC) to dye-label proteins displaying Aha or Hpg enables two-color fluorescence imaging of cells. We used fluorescence microscopy to evaluate each fluorophore for selective dye-labeling of a single population of newly synthesized proteins in Rat-1 fibroblasts. Cells were pulse-labeled for 3 h in media supplemented with 1 mM amino acid (Aha, Hpg, or Met). Cells were also pre-treated with the protein synthesis inhibitor anisomycin (aniso) prior to pulse-labeling to determine the contribution to labeling from free amino acid. After pulse-labeling, cells were washed, fixed, and blocked before dye-labeling. Cells were dye-labeled in PBS (pH 7.5) containing 1 mM CuSO4, 1 mM triscarboxyethylphosphine (TCEP), 100 µM tris((1-benzyl-1H-1,2,3-triazol-4-yl)methyl)amine (TBTA)8, 49, and an optimized concentration of each reactive dye: 10 µM DMAC-alkyne; 50 µM LR-alkyne; 10 µM BDPY-alkyne; 50 µM DMAC-azide; 50 µM LR-azide. Cells were washed before imaging on a confocal fluorescence microscope.
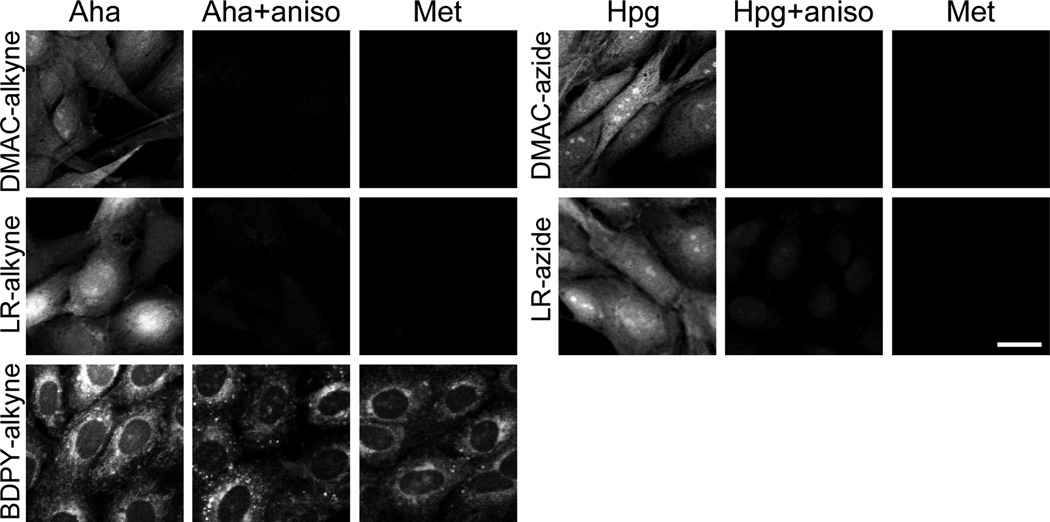
The reactive DMAC and LR fluorophores each provided bright, selective labeling of newly synthesized proteins inside cells (Figure 1). The dyes had access to both the nucleus and cytoplasm, and both types of fluorophore appeared to brightly stain the protein-rich nucleoli50. We did not observe dye-specific accumulation in any particular organelles (e.g., mitochondria or lysosomes.) Both of the DMAC dyes and the LR-azide dye enabled consistent staining of cells, while the LR-alkyne gave more varied levels of labeling among different cells in a population. We recommend use of LR-azide, rather than LR-alkyne, for this reason.
Figure 1.
Selective dye-labeling of newly synthesized proteins using azide or alkyne fluorophores. Confocal fluorescence imaging of Rat-1 fibroblasts grown for 3 h in media containing 1 mM Met, 1 mM Aha, or 1 mM Hpg. Control cells were pre-treated with the protein synthesis inhibitor anisomycin (aniso) prior to pulse-labeling. Cells were dye labeled with 10 µM DMAC-alkyne, 50 µM LR-alkyne, 10 µM BDPY-alkyne, 50 µM DMAC-azide, or 50 µM LR-azide. Scale bar represents 20 µm. Corresponding DIC images can be found in the Supporting Information (Figure S1).
Flow cytometry was used to determine the extent of fluorescence enhancement. Cells treated with Aha or Hpg for 5 h were characterized by a mean fluorescence 3- to 7-fold higher than that of cells pulse-labeled with Met (see Supporting Information, Figure S2). Addition of anisomycin to cells prior to addition of the reactive analogue reduced the mean fluorescence intensity to the level observed for the Met controls.
Flow cytometry suggested that BDPY-alkyne also labels newly synthesized proteins with good selectivity; Aha-treated cells exhibited a 6.5-fold enhancement in mean fluorescence compared to Met-treated cells (Figure S2). In contrast, imaging experiments revealed two problems. First, we observed large differences in the level of staining from cell to cell. Second, and more problematic, is the fact that the dye stained the same cytoplasmic structures in control cells treated with Met or with [Aha+aniso] as in cells treated with Aha. BDPY-alkyne might be useful for other applications, such as labeling of purified azide-tagged proteins, but we cannot recommend it for labeling azide-treated cells. We are unsure why BDPY-alkyne appears to be selective by flow cytometry but not by microscopy.
As described above, our preliminary experiments showed that the LR and DMAC fluorophores enable selective labeling of newly synthesized proteins in cells. Simultaneous pulse-labeling with two reactive amino acids provides the simplest means of introducing two distinct tags into cells47. Rat-1 fibroblasts were pulse-labeled for 5 h with 1 mM Met and several ratios of Aha to Hpg. Different ratios of Aha to Hpg were evaluated because the kinetics of aminoacylation probably differ for the two amino acids. We found previously, using purified E. coli methionyl-tRNA synthetase, that kcat/KM for Aha is approximately 25% larger than that for Hpg51. After the pulse, cells were labeled for 1 h with 50 µM LR-azide, washed, and labeled for 1 h with 10 µM DMAC-alkyne before imaging. Examination of individual cells by fluorescence microscopy revealed that it is possible to selectively dye-label both Aha and Hpg residues in newly synthesized proteins (Figure 2). Because the analogues were added simultaneously, the distribution of labeling should be similar for the two fluorophores. The false-colored micrographs indicate that both dyes label the entire interior of the cell, although LR-azide appears to stain the nucleus more brightly than DMAC-alkyne. Background labeling by LR-azide is also slightly higher than that observed for DMAC-alkyne. While ideally the dyes would behave identically, we are satisfied that we have identified two reactive fluorophores that stain similarly.
Figure 2.
Fluorescent images of Rat-1 fibroblasts simultaneously pulse-labeled with two reactive amino acids. Cells were pulse-labeled for 5 h with 1 mM Met, 1 mM Aha and 1 mM Hpg (1:1), 3 mM Aha and 1 mM Hpg (3:1), or 1 mM Aha and 3 mM Hpg (1:3). Cells were fixed and blocked before dye-labeling with LR-azide and DMAC-alkyne. Images were false-colored in ImageJ. Scale bar represents 20 µm.
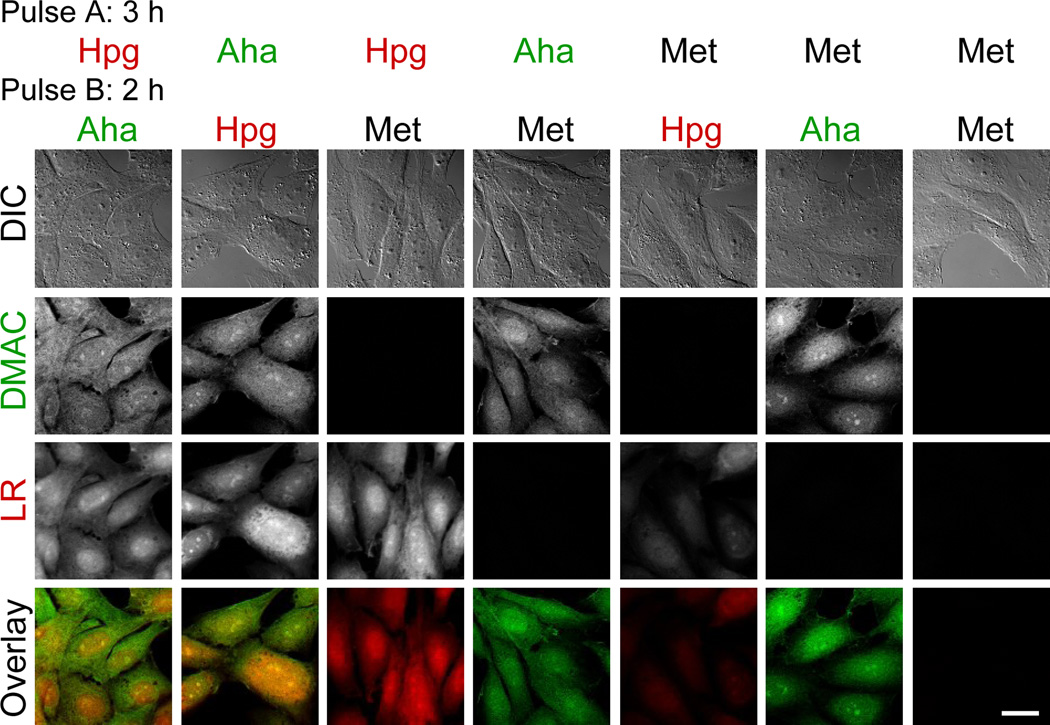
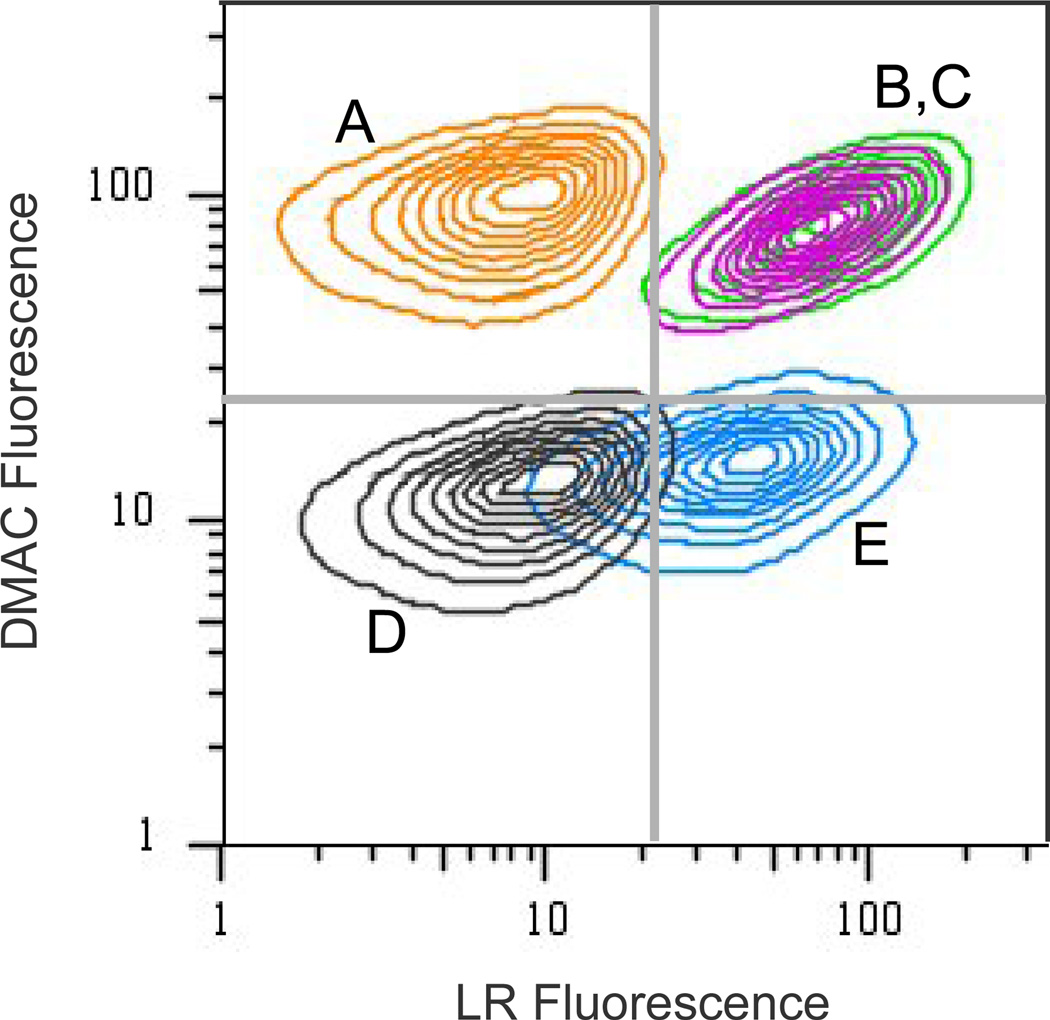
We sought to label two temporally defined populations of proteins by sequential addition of two amino acid analogues. Rat-1 fibroblasts were pulse-labeled for 3 h in media supplemented with either Aha, Hpg, or Met. At the end of the first pulse, cells were washed and incubated 15 min to deplete the first amino acid. The medium was replaced, and the fresh medium was supplemented with one of the three amino acids for the second pulse (2 h). As described above, fixed cells were dye-labeled for 1 h with LR-azide followed by 1 h with DMAC-alkyne. Individual cells were examined for two-color labeling using confocal fluorescence microscopy (Figure 3). For cells treated with both reactive analogues, bright LR and DMAC fluorescence was observed. As expected, for cells treated with Met and Hpg or with Met and Aha, only LR fluorescence or DMAC fluorescence, respectively, was detected. For cells pulse-labeled twice with Met, only background fluorescence was observed. The imaging results were validated by flow cytometry of cells sequentially pulsed with two analogues (Figure 4). Compared to cells pulse-labeled with Met, cells pulse-labeled with both Aha and Hpg showed substantial LR and DMAC labeling. Cells treated with a single reactive amino acid were labeled by a single dye.
Figure 3.
Fluorophore labeling of two distinct populations of proteins in Rat-1 fibroblasts. Cell were pulse-labeled for 3 h with an amino acid (Pulse A), washed, and then pulse-labeled for 2 h with a second amino acid (Pulse B). Cells were fixed and blocked before dye-labeling for 1 h with 50 µM LR-azide and 1 h with 10 µM DMAC-alkyne. The overlay shows both the DMAC (green) and LR (red) fluorescence. Scale bar represents 20 µm.
Figure 4.
Flow cytometry contour plot of two-dye labeled fibroblasts. Cell were pulse-labeled for 3 h with 1 mM amino acid (Pulse I), washed, and then pulse-labeled for 2 h with 1 mM of a second amino acid (Pulse II). Cells were fixed and blocked before dye-labeling with LR-azide and DMAC-alkyne. A: Cells were pulse-labeled with 1 mM Aha, followed by 1 mM Met [Orange: Aha→Met]. B: [Magenta: Aha→Hpg]. C: [Green: Hpg→Aha]. D: [Grey: Met→Met]. E: [Blue: Hpg→Met]. For each sample, 50,000 total events were collected. Dead cells and debris were excluded from analysis using forward-scatter and side-scatter.
We obtained similar results upon reversing the order of addition of the dyes (i.e., DMAC-alkyne for 1 h then LR-azide for 1 h). We also tested two-dye labeling with DMAC-azide and LR-alkyne and observed efficient labeling by fluorescence microscopy and flow cytometry (Figures S3 and S4). As mentioned above, LR-azide is a more reliable reactive fluorophore than LR-alkyne for one-dye labeling, and this holds true for two-dye labeling. Finally, it should be noted that two-dye labeling of proteins worked in every cell type examined. Notably, the rat exocrine cell line AR42J enabled sequential pulse-labeling with shorter (1 h) pulse lengths (Figure S5).
The work described here introduces reactive LR and DMAC dyes that enable two-color labeling of temporally defined protein populations in mammalian cells. Labeling is easily observed by flow cytometry and fluorescence microscopy. The dyes and methods developed in this work should find many uses in studies of the temporal and spatial character of protein translation.
Supplementary Material
Acknowledgements
We thank S.E. Fraser and C. Waters (of the Biological Imaging Center of the Beckman Institute at Caltech) for advice on microscopy. We thank L. Brown and A. Spalla (City of Hope) and R. Diamond and D. Perez (Caltech) for assistance with flow cytometry, and M. Shahgholi for help with mass spectrometry. We appreciate the insightful comments on this work provided by M.L. Mock, Y.Y. Lu, and M.J. Hangauer. This work was supported by NIH grant GM62523, by the ARO-sponsored Institute for Collaborative Biotechnologies, and by the Joseph J. Jacobs Institute for Molecular Engineering for Medicine. KEB is grateful to the Hertz Foundation, PEO, and the AAAS (Alan E. Leviton Award) for supporting her research.
Footnotes
Publisher's Disclaimer: This is a PDF file of an unedited manuscript that has been accepted for publication. As a service to our customers we are providing this early version of the manuscript. The manuscript will undergo copyediting, typesetting, and review of the resulting proof before it is published in its final citable form. Please note that during the production process errors may be discovered which could affect the content, and all legal disclaimers that apply to the journal pertain.
Supporting Information Available: Experimental protocols and additional data.
References
- 1.Lemieux GA, Bertozzi CR. Trends Biotechnol. 1998;16:506. doi: 10.1016/s0167-7799(98)01230-x. [DOI] [PubMed] [Google Scholar]
- 2.Rodriguez EC, Marcaurelle LA, Bertozzi CR. J. Org. Chem. 1998;63:7134. doi: 10.1021/jo981351n. [DOI] [PubMed] [Google Scholar]
- 3.Datta D, Wang P, Carrico IS, Mayo SL, Tirrell DA. J. Am. Chem. Soc. 2002;124:5652. doi: 10.1021/ja0177096. [DOI] [PubMed] [Google Scholar]
- 4.Wang L, Zhang ZW, Brock A, Schultz PG. Proc. Natl. Acad. Sci. USA. 2003;100:56. doi: 10.1073/pnas.0234824100. [DOI] [PMC free article] [PubMed] [Google Scholar]
- 5.Kiick KL, Saxon E, Tirrell DA, Bertozzi CR. Proc. Natl. Acad. Sci. USA. 2002;99:19. doi: 10.1073/pnas.012583299. [DOI] [PMC free article] [PubMed] [Google Scholar]
- 6.Saxon E, Bertozzi CR. Science. 2000;287:2007. doi: 10.1126/science.287.5460.2007. [DOI] [PubMed] [Google Scholar]
- 7.Chin JW, Santoro SW, Martin AB, King DS, Wang L, Schultz PG. J. Am. Chem. Soc. 2002;124:9026. doi: 10.1021/ja027007w. [DOI] [PubMed] [Google Scholar]
- 8.Speers AE, Cravatt BF. Chem. Biol. 2004;11:535. doi: 10.1016/j.chembiol.2004.03.012. [DOI] [PubMed] [Google Scholar]
- 9.Kiick KL, Weberskirch R, Tirrell DA. FEBS Lett. 2001;502:25. doi: 10.1016/s0014-5793(01)02657-6. [DOI] [PubMed] [Google Scholar]
- 10.van Hest JCM, Kiick KL, Tirrell DA. J. Am. Chem. Soc. 2000;122:1282. [PubMed] [Google Scholar]
- 11.Deiters A, Schultz PG. Bioorg. Med. Chem. Lett. 2005;15:1521. doi: 10.1016/j.bmcl.2004.12.065. [DOI] [PubMed] [Google Scholar]
- 12.Agard NJ, Prescher JA, Bertozzi CR. J. Am. Chem. Soc. 2004;126:15046. doi: 10.1021/ja044996f. [DOI] [PubMed] [Google Scholar]
- 13.Lewis WG, Green LG, Grynszpan F, Radic Z, Carlier PR, Taylor P, Finn MG, Sharpless KB. Angew. Chem. Int. Ed. 2002;41:1053. doi: 10.1002/1521-3773(20020315)41:6<1053::aid-anie1053>3.0.co;2-4. [DOI] [PubMed] [Google Scholar]
- 14.Rostovtsev VV, Green LG, Fokin VV, Sharpless KB. Angew. Chem. Int. Ed. 2002;41:2596. doi: 10.1002/1521-3773(20020715)41:14<2596::AID-ANIE2596>3.0.CO;2-4. [DOI] [PubMed] [Google Scholar]
- 15.Tornoe CW, Christensen C, Meldal M. J. Org. Chem. 2002;67:3057. doi: 10.1021/jo011148j. [DOI] [PubMed] [Google Scholar]
- 16.Prescher JA, Bertozzi CR. Nat. Chem. Biol. 2005;1:13. doi: 10.1038/nchembio0605-13. [DOI] [PubMed] [Google Scholar]
- 17.Khidekel N, Ficarro SB, Clark PM, Bryan MC, Swaney DL, Rexach JE, Sun YE, Coon JJ, Peters EC, Hsieh-Wilson LC. Nat. Chem. Biol. 2007;3:339. doi: 10.1038/nchembio881. [DOI] [PubMed] [Google Scholar]
- 18.Khidekel N, Ficarro SB, Peters EC, Hsieh-Wilson LC. Proc. Natl. Acad. Sci. USA. 2004;101:13132. doi: 10.1073/pnas.0403471101. [DOI] [PMC free article] [PubMed] [Google Scholar]
- 19.Dube DH, Prescher JA, Quang CN, Bertozzi CR. Proc. Natl. Acad. Sci. USA. 2006;103:4819. doi: 10.1073/pnas.0506855103. [DOI] [PMC free article] [PubMed] [Google Scholar]
- 20.Green KD, Pflum MKH. J. Am. Chem. Soc. 2007;129:10. doi: 10.1021/ja066828o. [DOI] [PubMed] [Google Scholar]
- 21.Warthaka M, Karwowska-Desaulniers P, Pflum MKH. ACS Chem. Biol. 2006;1:697. doi: 10.1021/cb6003564. [DOI] [PubMed] [Google Scholar]
- 22.Kho Y, Kim SC, Jiang C, Barma D, Kwon SW, Cheng J, Jaunbergs J, Weinbaum C, Tamanoi F, Falck J, Zhao Y. Proc. Natl. Acad. Sci. USA. 2004;101:12479. doi: 10.1073/pnas.0403413101. [DOI] [PMC free article] [PubMed] [Google Scholar]
- 23.Hang HC, Geutjes EJ, Grotenbreg G, Pollington AM, Bijlmakers MJ, Ploegh HL. J. Am. Chem. Soc. 2007;129:2744. doi: 10.1021/ja0685001. [DOI] [PubMed] [Google Scholar]
- 24.Martin DDO, Vilas GL, Prescher JA, Rajaiah G, Falck JR, Bertozzi CR, Berthiaume LG. FASEB J. 2007;22:1. doi: 10.1096/fj.07-9198com. [DOI] [PMC free article] [PubMed] [Google Scholar]
- 25.Kostiuk MA, Corvi MM, Keller BO, Plummer G, Prescher JA, Hangauer MJ, Bertozzi CR, Rajaiah G, Falck JR, Berthiaume LG. FASEB J. 2007;22:1. doi: 10.1096/fj.07-9199com. [DOI] [PMC free article] [PubMed] [Google Scholar]
- 26.Link AJ, Mock ML, Tirrell DA. Curr. Opin. Biotechnol. 2003;14:603. doi: 10.1016/j.copbio.2003.10.011. [DOI] [PubMed] [Google Scholar]
- 27.Hohsaka T, Sisido M. Curr. Opin. Chem. Biol. 2002;6:809. doi: 10.1016/s1367-5931(02)00376-9. [DOI] [PubMed] [Google Scholar]
- 28.Hendrickson TL, de Crecy-Lagard V, Schimmel P. Ann. Rev. Biochem. 2004;73:147. doi: 10.1146/annurev.biochem.73.012803.092429. [DOI] [PubMed] [Google Scholar]
- 29.Budisa N. Engineering the Genetic Code: Expanding the Amino Acid Repertoire for the Design of Novel Proteins: Wiley-VCH; 2006. [Google Scholar]
- 30.Budisa N. Angew. Chem. Int. Ed. 2004;43:6426. doi: 10.1002/anie.200300646. [DOI] [PubMed] [Google Scholar]
- 31.Mathews MB, Sonenberg N, Hershey JWB. Translational Control in Biology and Medicine. Cold Spring Harbor Laboratory Press; 2007. [Google Scholar]
- 32.Dieterich DC, Link AJ, Graumann J, Tirrell DA, Schuman EM. Proc. Natl. Acad. Sci. USA. 2006;103:9482. doi: 10.1073/pnas.0601637103. [DOI] [PMC free article] [PubMed] [Google Scholar]
- 33.Beatty KE, Liu JC, Xie F, Dieterich DC, Schuman EM, Wang Q, Tirrell DA. Angew. Chem. Int. Ed. 2006;45:7364. doi: 10.1002/anie.200602114. [DOI] [PubMed] [Google Scholar]
- 34.Tsien RY. Ann. Rev. Biochem. 1998;67:509. doi: 10.1146/annurev.biochem.67.1.509. [DOI] [PubMed] [Google Scholar]
- 35.Shaner NC, Steinbach PA, Tsien RY. Nat. Methods. 2005;2:905. doi: 10.1038/nmeth819. [DOI] [PubMed] [Google Scholar]
- 36.Gaietta G, Deerinck TJ, Adams SR, Bouwer J, Tour O, Laird DW, Sosinsky GE, Tsien RY, Ellisman MH. Science. 2002;296:503. doi: 10.1126/science.1068793. [DOI] [PubMed] [Google Scholar]
- 37.Chen HC, Detmer SA, Ewald AJ, Griffin EE, Fraser SE, Chan DC. J. Cell Biol. 2003;160:189. doi: 10.1083/jcb.200211046. [DOI] [PMC free article] [PubMed] [Google Scholar]
- 38.Phair RD, Misteli T. Nature. 2000;404:604. doi: 10.1038/35007077. [DOI] [PubMed] [Google Scholar]
- 39.Kim PK, Mullen RT, Schumann U, Lippincott-Schwartz J. J. Cell Biol. 2006;173:521. doi: 10.1083/jcb.200601036. [DOI] [PMC free article] [PubMed] [Google Scholar]
- 40.Ting AY, Kain KH, Klemke RL, Tsien RY. Proc. Natl. Acad. Sci. USA. 2001;98:15003. doi: 10.1073/pnas.211564598. [DOI] [PMC free article] [PubMed] [Google Scholar]
- 41.Hirschberg K, Miller CM, Ellenberg J, Presley JF, Siggia ED, Phair RD, Lippincott-Schwartz J. J. Cell Biol. 1998;143:1485. doi: 10.1083/jcb.143.6.1485. [DOI] [PMC free article] [PubMed] [Google Scholar]
- 42.Lin MZ, Glenn JS, Tsien RY. Proc. Natl. Acad. Sci. USA. 2008;105:7744. doi: 10.1073/pnas.0803060105. [DOI] [PMC free article] [PubMed] [Google Scholar]
- 43.Angelichio MJ, Camilli A. Infect. Immun. 2002;70:6518. doi: 10.1128/IAI.70.12.6518-6523.2002. [DOI] [PMC free article] [PubMed] [Google Scholar]
- 44.Hay N, Sonenberg N. Genes Dev. 2004;18:1926. doi: 10.1101/gad.1212704. [DOI] [PubMed] [Google Scholar]
- 45.Palade G. Science. 1975;189:347. doi: 10.1126/science.1096303. [DOI] [PubMed] [Google Scholar]
- 46.Lippincott-Schwartz J, Roberts TH, Hirschberg K. Annu. Rev. Cell Dev. Biol. 2000;16:557. doi: 10.1146/annurev.cellbio.16.1.557. [DOI] [PMC free article] [PubMed] [Google Scholar]
- 47.Chang PV, Prescher JA, Hangauer MJ, Bertozzi CR. J. Am. Chem. Soc. 2007;129:8400. doi: 10.1021/ja070238o. [DOI] [PMC free article] [PubMed] [Google Scholar]
- 48.Carboni B, Benalil A, Vaultier M. J. Org. Chem. 1993;58:3736. [Google Scholar]
- 49.Wang Q, Chan TR, Hilgraf R, Fokin VV, Sharpless KB, Finn MG. J. Am. Chem. Soc. 2003;125:3192. doi: 10.1021/ja021381e. [DOI] [PubMed] [Google Scholar]
- 50.This is consistent with the bright nucleolar staining previously observed.33
- 51.Kiick KL. Ph.D. Thesis. University of Massachusetts Amherst; 2001. [Google Scholar]
Associated Data
This section collects any data citations, data availability statements, or supplementary materials included in this article.


