

Abstract
Mitochondrial oxidative stress is a contributing factor in the etiology of numerous neuronal disorders. However, the precise mechanism(s) by which mitochondrial reactive oxygen species (ROS) modify cellular targets to induce neurotoxicity remains unknown. In this study, we determined the role of mitochondrial aconitase (m-aconitase) in neurotoxicity by decreasing its expression. Incubation of the rat dopaminergic cell line, N27, with paraquat (PQ2+) resulted in aconitase inactivation, increased hydrogen peroxide (H2O2) and increased ferrous iron (Fe2+) at times preceding cell death. To confirm the role of m-aconitase in dopaminergic cell death we knocked down m-aconitase expression via RNA interference. Incubation of m-aconitase knockdown N27 cells with PQ2+ resulted in decreased H2O2 production, Fe2+ accumulation, and cell death compared to cells expressing basal levels of m-aconitase. To determine the metabolic role of m-aconitase in mediating neuroprotection, we conducted a complete bioenergetic profile. m-Aconitase knockdown N27 cells showed a global decrease in metabolism (glycolysis and oxygen consumption rates) which blocked PQ2+-induced H+ leak and respiratory capacity deficiency. These findings suggest that dopaminergic cells are protected from death by decreasing release of H2O2 and Fe2+ in addition to decreased cellular metabolism.
Keywords: mitochondrial aconitase, oxidative stress, paraquat, neurotoxicity, hydrogen peroxide, iron
Introduction
Oxidative stress has been implicated in the onset and progression of numerous chronic and acute neurodegenerative disorders such as Parkinson’s disease (PD), Huntington’s disease, Friedreich’s ataxia, amyotrophic lateral sclerosis and stroke (Schapira 1999; Lin and Beal 2006; Baron et al. 2007; Schapira 2008). Multiple factors such as metabolism, aging, environment and genetics can lead to increased steady-state levels of reactive oxygen species (ROS) (Ross and Eisenstein 2002) and in turn oxidative damage to cellular macromolecules (i.e. proteins, DNA, lipids and carbohydrates). Although the occurrence of oxidative stress and neurodegeneration has been established, the precise mechanism(s) by which ROS modify cellular targets to induce neuronal death remain incompletely understood.
Mitochondria are a major source and target of ROS (Murphy 2009). Estimates of superoxide (O2.−) formation within mitochondria range widely between 0.4-1% under normal physiological conditions (Boveris and Chance 1973; Imlay and Fridovich 1991). While the majority of the O2.− produced within this organelle is detoxified by manganese superoxide dismutase (MnSOD), the fate of mitochondrial O2.− depends on its reactivity and abundance of other targets such as nitric oxide (NO.) and iron sulfur (Fe-S) containing proteins. Based on concentrations of Fe-S centers, NO. and MnSOD, labile Fe-S centers are major targets O2.− in E. coli and yeast (Liochev and Fridovich 1994; Longo et al. 1999). Because labile Fe-S containing proteins such as aconitase are abundant in the brain (Koen and Goodman 1969), they are an important target for O2.−. In addition to aconitase, other tricarboxylic acid (TCA) cycle enzymes including α-ketoglutarate dehydrogenase and succinate dehydrogenase have been shown to be sensitive to inactivation by ROS (Tretter and Adam-Vizi 2000, 2005).
In mammals and other eukaryotes there are two aconitases; one localized in the mitochondrial matrix and the other in the cytosol which also functions as iron regulatory protein-1 (IRP-1). Of the known functions of mitochondrial aconitase (m-aconitase), two are most prominent. The first major function of m-aconitase is participation in the TCA cycle, where it catalyzes the reversible isomerization of citrate and isocitrate in a 2-step dehydration/hydration reaction via its intermediate form, cis-aconitate. The TCA cycle produces reducing equivalents whereby electrons are carried to the electron transport chain for oxidative phosphorylation which results in the production of ATP. A secondary role for m-aconitase is to act as a biosensor for ROS and iron. Mammalian aconitase and bacterial dehydratases contain a [4Fe-4S] prosthetic group in their catalytic centers which are susceptible to inactivation by ROS, particularly O2.− (Gardner and Fridovich 1991a, 1991b; Flint et al. 1993). Aconitase is uniquely sensitive to O2.− mediated oxidative inactivation due to the presence of a single unligated iron atom, such that oxidation of the [4Fe-4S]2+ cluster renders it unstable and promotes removal of the labile iron atom, consequently forming hydrogen peroxide (H2O2) by the reduction of O2.−. In the mammalian brain, approximately 85% of aconitase activity is localized to the mitochondria; and despite the fact that both aconitases contain a [4Fe-4S] prosthetic group in their catalytic sites, m-aconitase is more sensitive than cytosolic aconitase to oxidative inactivation perhaps in part due to cellular localization (Liang et al. 2000). Release of redox-active iron (Fe2+) from aconitase and other hydro-lyases has been reported in cell-free systems (Flint et al. 1993; Keyer and Imlay 1996). m-Aconitase has also been shown to be a source of .OH, presumably via Fenton chemistry initiated by the co-released Fe2+ and H2O2 in bovine heart purified m-aconitase (Vasquez-Vivar et al. 2000). Besides being a source of Fe2+, translation of m-aconitase can be regulated by fluctuations in iron via an iron regulatory element (Lemire et al. 2007) in its 5′ UTR (Kim et al. 1996) which functions similarly to that of the iron storage protein ferritin; whereby decreased iron levels allows an IRP to bind the IRE of m-aconitase blocking its translation. This suggests that expression of m-aconitase can be controlled by changes in iron levels.
A number of neurodegenerative diseases in which oxidative stress has been implicated, as well as in vivo and in vitro models of these disorders, collectively demonstrate decreased aconitase activity presumably via oxidative inactivation by ROS (Patel et al. 1996; Rotig et al. 1997; Melov et al. 1999; Schapira 1999; Tabrizi et al. 1999; Park et al. 2001; Liang and Patel 2004b; Vielhaber et al. 2008). Because of the labile iron atom found within the [4Fe-4S]2+ cluster of m-aconitase, and its proximity to mitochondrially generated ROS, it is an ideal candidate for oxidative inactivation. Although aconitase has been well established as a sensitive target of ROS, the consequences of oxidative inactivation of this important mitochondrial enzyme are still being explored. The role of aconitase in mediating O2.− toxicity has been shown in both bacteria (Gardner and Fridovich 1991b) and yeast (Longo et al. 1999). These observations are based on the principle that oxidation of the [4Fe-4S]2+ cluster of aconitase by O2.−, in the presence of protons, results in the formation of Fe2+ and H2O2 and in turn produce .OH via the Fenton reaction (Liochev and Fridovich 1994). Further understanding the role of m-aconitase in mediating neurotoxicity by acting as a source of ROS may provide a mechanism by which oxidative inactivation of ROS-sensitive targets can lead to neurodegeneration. The role of iron and mitochondrial oxidative stress as major contributors to neurodegenerative diseases such as PD has been shown (Beal 1998; Jenner 2003; Kaur and Andersen 2004; Berg and Youdim 2006). Work in our laboratory has demonstrated that m-aconitase can become oxidatively inactivated in mice treated with the parkinsonian toxin 1-methyl-4-phenyl-1,2,3,6-tetrahydropyridine (MPTP), and that this inactivation correlates with increased chelatable mitochondrial iron in the ventral midbrain region (Liang and Patel 2004b). Overexpression of m-aconitase in primary midbrain neuronal-glial cultures, which occurred predominantly in astrocytes, resulted in increased Fe2+ and H2O2-dependent neuronal death (Cantu et al. 2009). However, whether oxidative inactivation of neuronal m-aconitase can release Fe2+ and H2O2 and contribute to neurotoxicity remains unknown. To verify the role of m-aconitase in Fe2+ and H2O2-dependent neurotoxicity, it is important to specifically decrease m-aconitase expression and thereby decrease a major contributor to the production of Fenton reactants. The goal of this study was to determine the role of m-aconitase in the death of dopaminergic cells. To accomplish this, we decreased the expression of m-aconitase via RNA interference and increased steady-state levels of ROS in immortalized rat dopaminergic (N27) cells by using paraquat (PQ2+), a bipyridyl herbicide that redox cycles with molecular oxygen and serves as a continuous source of O2.−. N27 cells have been extensively characterized as having key features of dopaminergic cells, such as expressing tyrosine hydroxylase and the dopamine transporter (Clarkson et al. 1998). Here, we demonstrate that knockdown of m-aconitase in dopaminergic cells increases their resistance to PQ2+-induced cell death, predominantly via a mechanism involving decreased Fe2+ and H2O2 release.
Materials and Methods
Cell Treatment
Cell culture media and reagents were obtained from Invitrogen (Carlsbad, CA). All other materials were obtained from Sigma (St. Louis, MO). Immortalized rat dopaminergic N27 cells were a kind gift from Drs. Curt Freed and Kedar Prasad at University of Colorado, Anschutz Medical Campus.
N27 cell culture
N27 cells were grown in RPMI 1640 medium supplemented with 10% fetal bovine serum (FBS), penicillin (100 U/ml) and streptomycin (100 U/ml). Cells were plated for experimentation in RPMI 1640 medium supplemented with 1% FBS, penicillin (10 U/ml) and streptomycin (10 U/ml) and maintained at 37 °C in a 5% CO2 humidified atmosphere.
m-Aconitase knockdown
Knockdown of m-aconitase was achieved using RNA interference. Four pre-designed, individual gene specific siRNA duplexes were obtained from Dharmacon (Lafayette, CO) and screened for transfection efficiency. Of the four, one duplex was selected based on its high knockdown efficiency (CCAGUGAGUACAUCCGAUA). N27 cells were plated in 6-well plates at 1×10⁵ cells/well overnight in RPMI 1640 medium supplemented with 1% FBS, penicillin (10 U/ml) and streptomycin (10 U/ml). Cells were then washed once with RPMI 1640 (1% FBS, 10 U/ml penicillin, 10 U/ml streptomycin) followed by addition of 800 μl of same media. Cells were then transfected using Dharmacon transfection reagent DharmaFect 1 (T-2001-03) and 100 nM siRNA (final concentration). For each well, 5 μl of 20 μM m-aconitase, non-targeting or lamin siRNA was combined with 45 μl 1X siRNA buffer and 50 μl serum-free RPMI 1640. A second mixture containing 1.5 μl DharmaFect 1 and 98.5 μl serum-free RPMI 1640 was made. After 5 min, 100 μl of the first mixture was combined with 100 μl of the second mixture and incubated at room temperature for 20 min. 200 μl of combined siRNA mixture (siRNA, 1x siRNA buffer, Dharmafect 1 reagent and serum-free RPMI 1640) was added to cells. After 48 hrs, 1 ml of media was added to each well. Mock transfection consisted only of DharmaFect reagent with 1X siRNA buffer without siRNA; control cells were not transfected or treated with any transfection reagents. All experiments were conducted 72 hrs post-transfection.
Verification of m-aconitase knockdown
RNA was isolated using the RNeasy kit® (Qiagen,USA) and quantified using RiboGreen® RNA Quantitation Kit (Molecular Probes, Eugene, OR). An Applied Biosystems 7500 Fast Real-Time PCR System was used for real time PCR. RNA was reverse transcribed to cDNA using the High-Capacity cDNA Reverse Transcription Kit (Applied Biosystems). Thermal cycling conditions included 25°C for 10 min, 37°C for 120 min and 85°C for 5 sec. PCR reaction conditions included 1 cycle at 50°C for 2 min, 1 cycle at 95°C for 10 min and 40 cycles of 95°C for 15 sec and 60°C for 1 min. Primers and probes for rat m-aconitase were purchased from Integrated DNA Technologies; forward primer: 5′ CCG CCT TCC TGT TCA GTT TG-3′, reverse primer: 5′ TGT AGA GGG AGT GCT GTC ATC AA-3′, probe: 5′ TTT GTC TTT GAG CAA CCC ATG CAA-3′.
Additionally, Western blot analysis was used to confirm knockdown. Media was replaced with 150 μl ice-cold lysis buffer (0.1% Triton-X in PBS, protease inhibitor cocktail), placed in 4°C for 30 min, and sonicated. 10-20 μg of protein was loaded onto a 12% gel and analyzed via SDS-PAGE. Proteins were detected with a rabbit polyclonal IgG against human m-aconitase capable of cross-reacting with rat (1:500, Atlas Antibodies) and with rabbit affinity-purified monoclonal IgG against rat β-actin (1:1000, Sigma) to confirm equal loading in gels. Densitometry was analyzed using ImageJ (NIH) by normalizing m-aconitase protein bands to β-actin.
Detection of H2O2
H2O2 was measured using Amplex Red (Invitrogen, Carlsbad, CA), a horse radish peroxidase (HRP)-linked fluorometric assay. Naïve and transfected N27 cells were plated on 96-well plates at 1.4 × 10⁵ cells/well and allowed to adhere overnight. Cell culture media was removed and replaced with 150 ml of Hank’s Buffered Saline Solution (HBSS) solution containing 1 mg/ml glucose, 0.1 U/ml HRP, 50 μM Amplex Red and PQ2+. Resorufin fluorescence was measured after 6 hrs by a Gemini fluorescence microplate reader equipped for excitation in the range of 530–560 nm and fluorescence emission detection at 590 nm (Molecular Devices, Sunnyvale, CA).
Detection of Fe2+
Detection of Fe2+ was conducted using a fluorescent iron indicator, rhodamine B-[(1,10)phenanthrolin-5-yl) aminocarbonyl]benzyl ester (RPA) (Petrat et al. 2002), whose fluorescence is quenched by mitochondrial ferrous iron. Naïve and transfected N27 cells were incubated with PQ2+ in fresh cell culture media for 4 hrs. Cell culture media was then removed and replaced with 1 μM RPA dissolved in HBSS. Cells were kept at 37°C for 10 min, rinsed with HBSS, and placed at 37°C for an additional 10 min. Cultures were rinsed a final time with HBSS before 5 randomly selected images were captured on an Olympus IX81 inverted motorized microscope. Images were quantified by measuring the mean pixel intensity using ImageJ (NIH).
Cell death analysis
Cell death analysis was performed by measuring release of lactate dehydrogenase (LDH) enzyme activity in addition to propidium iodide (PI) staining (Invitrogen, Eugene, OR). Media samples from PQ2+ treated cells were collected and LDH activity was measured spectrophotometrically at 30°C as the amount of pyruvate consumed, by monitoring the decrease in absorbance due to the oxidation of NADH at 340 nm (Vassault 1983). For PI staining, cells were rinsed with 2X SSC (0.3M NaCl, 0.03M sodium citrate, pH 7.0), incubated in 2 μM PI for 5 min and washed once again with 2X SSC. 5 randomly selected fluorescent images were captured using an Olympus IX 81 inverted motorized microscope and merged with phase contrast images. PI+ cells from fluorescent and phase contrast overlay were counted to ensure accurate identification of PI+ cells.
Aconitase and fumarase activities
Aconitase and fumarase activities were measured spectrophotometrically as previously described (Patel et al. 1996).
Reactivation of aconitase
N27 cells were treated with 0, 0.5, and 1 mM PQ2+ for 4 hrs and lysed with 200 μl ice-cold aconitase lysis buffer (50 mM Tris–HCl, pH 7.4 containing 0.6 mM MnCl2, 1 mM L-cysteine, 1 mM citrate, and 0.5% Triton-X 100) for 30 min at 4°C. N27 cell lysates were collected and 90 μl from each treatment condition were either combined with reactivation buffer [0.5M DTT (10 μl), 20 mM Na2S (1 μl), 20 mM FAS (1 μl) in 50 mM Tris-HCl (pH 8.0)] or with vehicle for 30 min at 30°C.
Levels of m-aconitase apoprotein
m-Aconitase apoprotein levels were measured by Western blot analysis as in Verification of m-aconitase knockdown section of Materials and Methods.
Measurement of oxygen consumption and extracellular acidification rate
Oxygen consumption and extracellular acidification rates were determined using a Seahorse XF24 analyzer. Naïve and transfected N27 cells were plated on XF24 microplates (Seahorse Bioscience, North Billerica, MA) at 3.0×10⁴ cells/well in RPMI 1640 supplemented with 1% FBS, penicillin (10 U/ml) and streptomycin (10 U/ml) and kept at 37°C in a 5% CO2 humidified atmosphere overnight. For experiments addressing the effects of PQ2+, incubation lasted 6 hrs. For measurement of oxygen consumption and glycolysis, growth media was replaced with incubation media which consisted of RPMI 1640 media (already containing 11mM glucose and lacking sodium bicarbonate) supplemented with 1mM sodium pyruvate and 2mM Glutamax (Sigma). 10X stock solutions of oligomycin (oligo) (5 μM), carbonylcyanide p-trifluoromethoxyphenylhydrazone (FCCP) (30 μM) and antimycin A (AA) (3 μM) were diluted in incubation media and 75 μl of each 10X stock solution was loaded onto an XF24 cartridge. The XF24 microplate was loaded into the Seahorse XF24 analyzer following the manufacturer’s instructions. All experiments were carried out at 37°C. Respiratory parameters were quantified by subtracting respiration rates at times before and after addition of ETC inhibitors according to Seahorse Biosciences; basal respiration: baseline respiration minus AA-dependent respiration; ATP turnover: baseline respiration minus oligo-dependent respiration; H+ leak: oligo-dependent respiration minus AA-dependent respiration; respiratory capacity: AA-dependent respiration minus FCCP-dependent respiration. Values were calculated for each individual well and averaged for each condition. PQ2+-dependent respiratory capacity deficiency was calculated by subtracting the OCR from 0.3 mM PQ2+ cells from OCR in 0 mM PQ2+ treated cells.
Statistical analysis
For comparison between two experimental groups, a student’s t-test was used. For three or more experimental groups, a one-way ANOVA with the Bonferroni’s post-hoc test was used. A two-way ANOVA was used for comparing two different treatment groups in the presence and absence of PQ2+. Values of p < 0.05 or more were considered statistically significant.
Results
To determine the role of neuronal m-aconitase as a source of H2O2 and Fe2+, we asked whether oxidative inactivation of m-aconitase resulted in accumulation of H2O2, Fe2+ and cell death in N27 cells and whether decreasing m-aconitase expression would attenuate these effects. Furthermore, we determined the effects of decreased m-aconitase expression on cellular metabolism.
H2O2 production, mitochondrial Fe2+ accumulation, and cell death increase in N27 cells following oxidative inactivation of aconitase by PQ2+
To determine the effects of decreased m-aconitase expression on H2O2, Fe2+ and cell death, we first examined the effects of the O2.− generating compound PQ2+ on aconitase activity. Consistent with our previous studies in primary midbrain and cortical cultures (Patel et al. 1996; Cantu et al. 2009), aconitase activity decreased in N27 cells after 4 hrs of 0.5 mM and 1 mM PQ2+ incubation while the activity of fumarase, a control mammalian enzyme which lacks an oxidation sensitive Fe-S center, remained unchanged (Fig 1A). In order to verify that decreased aconitase activity by PQ2+ (and consequent production of O2.−) results in a disruption of the [4Fe-4S] cluster of aconitase rather than degradation of the protein, we asked whether aconitase inactivation by PQ2+ was reversible. N27 cell lysates were collected after 4 hrs of 0, 0.5 and 1 mM PQ2+ incubation and treated with vehicle or with a combination of dithiothreitol (DTT), sodium sulfide (Na2S), and ferrous ammonium sulfate (FAS) (reactivation reagents) for 30 min. Inactive aconitase resulting from PQ2+ incubation was reactivated after 30 min incubation with reactivation reagents (Fig 1B). Furthermore, although aconitase enzymatic activity was significantly decreased with PQ2+, apoprotein levels of m-aconitase remained unchanged (Figs 1C, 1D). Together these results support that oxidative inactivation of aconitase is occurring via disruption of the [4Fe-4S] cluster rather than degradation of the protein.
Figure 1. Selective decrease in aconitase activity in N27 cells following PQ2+ treatment.
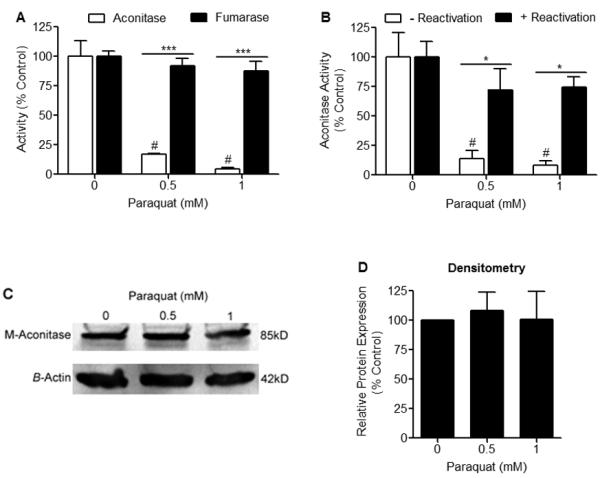
(A) N27 cells were treated with 0, 0.5, and 1 mM PQ2+ for 4 hrs and activities of aconitase and fumarase were measured spectrophotometrically. Aconitase activity was significantly decreased in the presence of PQ2+, while fumarase activity remained unchanged, # indicates statistical significance compared to aconitase activity from cells treated with 0 mM PQ2+, * indicates statistical difference between aconitase and fumarase activities, (n = 3-4). Bars represent mean ± SEM, (p < 0.05, two-way ANOVA). (B) N27 cells were treated with 0, 0.5, and 1 mM PQ2+ for 4 hrs. Cell lysates were collected and incubated with (+) or without (−) reactivation buffer (FAS, Na2S, DTT) for 30 min at 37°C. N27 cell lysates treated without reactivation buffer showed a significant decrease in aconitase activity in the presence of PQ2+, while lysates treated with reactivation buffer showed no difference in activity, # indicates statistical difference compared to 0 mM PQ2+ (−) reactivation, * indicates statistical difference between (−) reactivation and (+) reactivation, (n = 3). Bars represent mean ± SEM, (p < 0.05, two-way ANOVA). (C) Representative Western blot of 3 independent experiments showing m-aconitase apoprotein levels remain unchanged after 4 hrs of 0, 0.5, and 1 mM PQ2+. (D) Densitometry analysis of m-aconitase apoprotein levels shown in (C) showing no difference in relative protein expression. Bars represent mean ± SEM, (n = 3).
To determine the consequences of oxidative inactivation of aconitase, we established the time- and dose-dependent effects of H2O2 production, mitochondrial Fe2+ accumulation and cell death after early (4-6 hrs) and late (18 hrs) exposure to the O2.− generating compound PQ2+. A concentration-dependent increase in H2O2 production was observed by measuring Amplex Red fluorescence in N27 cells after early exposure to 0.5, and 1 mM PQ2+ (Fig 2A). PQ2+ concentrations in the mM range were necessary to significantly increase ROS production as with MPP+ (data not shown), although concentrations varied from other compounds used to increase ROS production such as rotenone (50nM) and Antimycin A (25nM) (Sipos et al. 2003). Increased mitochondrial Fe2+ was detected in N27 cells after early exposure to PQ2+ via RPA fluorescence, whereby quenching indicates an increase in Fe2+ concentration. A significant decrease in RPA fluorescence intensity was observed at 1 mM PQ2+ indicating an increase in mitochondrial Fe2+ (Fig 2B). Due to the sensitivity of RPA used to measure iron, we increased the concentration of PQ2+ from 0.3 mM to 0.5 mM. However, treatment of N27 cells with 0.5 mM PQ2+ was not statistically different from 0 mM or 1 mM PQ2+ (Fig 2B).
Figure 2. H2O2 production and mitochondrial Fe2+ levels increase prior to the onset of cell death in N27 cells treated with PQ2+.
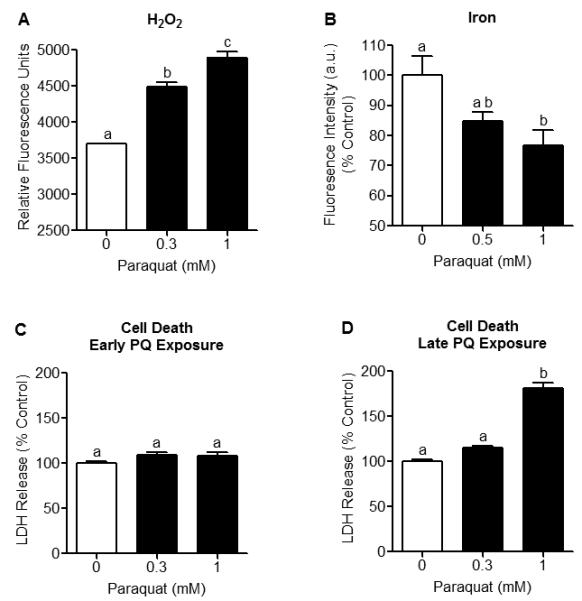
N27 cells were incubated with PQ2+ at early (4-6 hrs) and late (18 hrs) time-points. (A) H2O2 production was measured in N27 cells using Amplex Red. A concentration-dependent increase in H2O2 production was observed after early PQ2+ exposure. Data are expressed as relative fluorescent units of Amplex Red, (n = 6). (B) Mitochondrial Fe2+ was measured using RPA fluorescence. Fluorescence intensity of RPA was significantly quenched after early exposure to 1 mM PQ2+, indicating increased mitochondrial Fe2+. Treatment of N27 cells with 0.5 mM PQ2+ was not statistically different from 0 mM or 1 mM PQ2+. Mean pixel intensity of 5 random fields/well was quantified using Image J (NIH) and expressed as % control, (n = 5-6). (C) Cell death was assessed by measuring LDH release and showed no difference after early PQ2+ exposure, (n = 5-6). (D) LDH release significantly increased after late exposure to 1 mM PQ2+. Bars represent mean ± SEM, bars with different letters were statistically different from one another (p < 0.05, one-way ANOVA).
Cell death was evaluated after early and late PQ2+ exposure via measurement of extracellular LDH release. Although no difference in LDH release was found after early PQ2+ exposure (Fig 2C), a significant increase was observed after late exposure to 1 mM PQ2+ (Fig 2D). Collectively, these studies indicate that oxidative inactivation of aconitase, increased H2O2 production and increased mitochondrial Fe2+ accumulation occur at times preceding cell death in N27 cells.
siRNA treatment of N27 cells decreases m-aconitase mRNA and protein expression
To confirm the role that oxidative inactivation of m-aconitase plays in mediating neuronal death, we knocked down its expression using RNA interference in N27 cells. m-Aconitase knockdown was successfully achieved by transfecting N27 cells with a siRNA duplex specific for m-aconitase. m-Aconitase mRNA expression was measured 72 hrs post-transfection using real-time PCR and compared to non-transfected cells (control), mock transfected cells (mock), lamin siRNA transfected cells (lamin) and non-targeting siRNA transfected cells (non-targeting). N27 cells transfected with m-aconitase siRNA demonstrated a significant decrease in m-aconitase mRNA expression of approximately ~87% compared to control and ~91% compared to non-targeting siRNA (Fig 3A). To confirm that knockdown was successful at this time-point, Western blot analysis was used to measure protein expression. Similarly, m-aconitase siRNA transfected cells showed decreased protein expression compared to control cells and non-targeting siRNA transfected cells (Fig 3B). After quantifying m-aconitase protein expression, we observed a decrease of approximately ~73% compared to control and ~60% compared to non-targeting siRNA (Fig 3C). As a positive control, we measured lamin protein expression in N27 cells transfected with lamin siRNA. We observed a significant decrease in lamin protein levels 72 hrs post-transfection by Western blot analysis (data not shown).
Figure 3. m-Aconitase mRNA and protein expression are decreased with m-aconitase siRNA transfection.
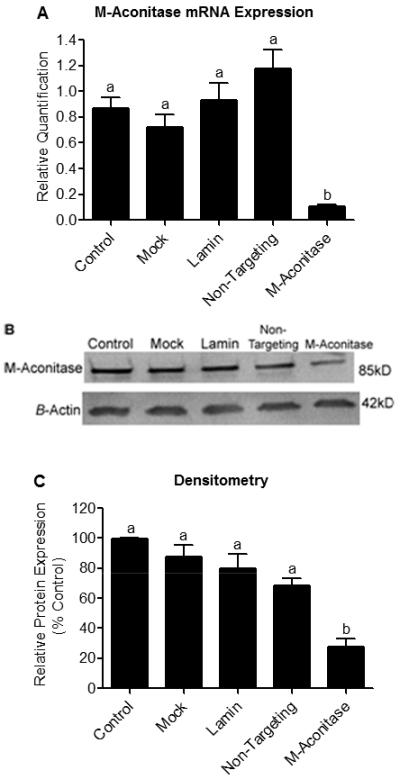
N27 cells were transfected with m-aconitase siRNA and compared to non-transfected cells (control), mock transfected cells (mock), lamin siRNA transfected cells (lamin), and non-targeting siRNA transfected cells (non-targeting) for 72 hrs. (A) m-aconitase mRNA expression was measured by real-time PCR. Cells transfected with m-aconitase siRNA demonstrated ~87% decrease in m-aconitase mRNA expression compared to control and ~91% decrease compared to non-targeting siRNA. m-Aconitase mRNA values were normalized to expression of 18S ribosomal RNA (used as an endogenous control) and expressed as relative quantification, (n = 2-4). (B) m-Aconitase protein expression was assessed via Western blot analysis. m-Aconitase siRNA transfection decreased m-aconitase protein expression compared to control and non-targeting siRNA transfection. Protein levels were normalized to β-actin expression, representative blot of 3 independent experiments. (C) Densitometry analysis of m-aconitase protein levels shown in (B). N27 cells transfected with m-aconitase siRNA showed ~73% decrease in m-aconitase protein levels compared to control and ~60% compared to non-targeting siRNA, (n = 3). Bars represent mean ± SEM, bars with different letters were statistically different from one another (p < 0.05, one-way ANOVA).
m-Aconitase knockdown attenuates PQ2+-induced increase in H2O2 production, mitochondrial Fe2+ accumulation, and cell death
We next investigated whether decreased m-aconitase expression would attenuate release of Fenton reactants (H2O2 and Fe2+) and cell death after an oxidative insult. If m-aconitase was contributing to H2O2 and Fe2+ release, then decreasing its expression should attenuate this effect. Because no statistical difference in m-aconitase mRNA or protein levels was observed between control and non-targeting siRNA transfected cells, we proceeded to compare only non-targeting and m-aconitase siRNA transfected cells. This allowed us to account for any differences attributed to trasfection alone. Cells expressing basal levels of m-aconitase (non-targeting) and cells with decreased m-aconitase expression (m-aconitase) were treated with PQ2+ (in order to increase O2.− and inactivate aconitase). Although H2O2 production increased in both non-targeting and m-aconitase transfected N27 cells after early PQ2+ exposure, m-aconitase knockdown cells showed a significant decrease compared to cells expressing basal m-aconitase, (Fig 4A). We proceeded to conduct a similar experiment to determine if Fe2+ release was also decreased when m-aconitase deficient cells were treated with PQ2+. Indeed, cells transduced with non-targeting siRNA demonstrated a decrease in RPA fluorescence (indicating an increase in free mitochondrial Fe2+) after early PQ2+ exposure, while cells transfected with m-aconitase siRNA showed no change in RPA fluorescence (Fig 4B). These data suggest that 1) H2O2 and Fe2+ are released from m-aconitase after the enzyme is oxidatively inactivated and 2) when m-aconitase is knocked down, H2O2 and Fe2+ release is attenuated.
Figure 4. m-Aconitase knockdown N27 cells produce less H2O2, mitochondrial Fe2+, and cell death following PQ2+ treatment.
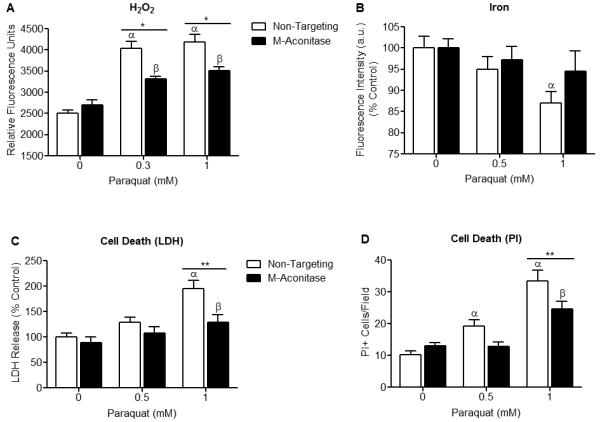
(A) N27 cells were transfected with non-targeting or m-aconitase siRNA for 72 hrs, treated with PQ2+, and H2O2 was measured using Amplex Red. H2O2 production was significantly attenuated in m-aconitase knockdown cells (m-aconitase) compared to cells expressing basal m-aconitase (non-targeting) after early exposure to 0.3 and 1 mM PQ2+. Data are expressed as relative fluorescent units, (n = 5). (B) N27 cells were transfected with non-targeting siRNA or m-aconitase siRNA for 72 hrs, treated with PQ2+, and mitochondrial iron was measured by the quenching of RPA from 5 random fields/well. After early exposure with 1 mM PQ2+, cells expressing basal levels of m-aconitase (non-targeting) showed a significant decrease in RPA quenching (indicating an increase in iron). This effect was attenuated in m-aconitase knockdown cells (m-aconitase), (n = 5). (C) Cells were transfected with non-targeting or m-aconitase siRNA for 72 hrs and treated with PQ2+. Cell death was evaluated after late exposure to PQ2+ via release of extracellular LDH. PQ2+-induced cell death was attenuated in m-aconitase knockdown cells compared to cells expressing basal levels of m-aconitase, (n = 6-8). (D) Cell death was verified by counting PI+ stained cells after late exposure to PQ2+. Quantification of m-aconitase knockdown cells showed decreased PI+ cells compared to cells expressing basal m-aconitase. PI+ cells were counted from 5 randomly selected fields/well, (n = 5-6). Bars represent mean ± SEM, α indicates statistical difference compared to non-targeting, 0 mM PQ2+; β indicates statistical difference compared to m-aconitase, 0 mM PQ2+; * indicates statistical difference between non-targeting and m-aconitase, (p < 0.05, two-way ANOVA).
One consequence of oxidative inactivation of aconitase is cell death, as reported in bacteria and yeast (Gardner and Fridovich 1991b; Longo et al. 1999), presumably via co-released H2O2 and Fe2+ undergoing Fenton chemistry and producing toxic .OH radicals. We therefore wanted to test whether decreasing m-aconitase expression would prevent cell death. Similar to the above experiments, N27 cells were transfected with non-targeting and m-aconitase siRNA and cell death was measured after late PQ2+ exposure. Because no cell death was observed after late exposure to 0.3 mM PQ2+ (Fig 2D), we proceeded to increase the concentration of PQ2+ to 0.5 mM. PQ2+-mediated cell death was significantly decreased after late exposure to 1 mM PQ2+ in m-aconitase knockdown cells as measured by release of extracellular LDH (Fig 4C). To verify these results, we used PI staining as an alternative for measuring cell death. Fluorescent images of PI stained cells were overlaid with phase contrast images to ensure accurate counting of PI+ cells. Similarly, m-aconitase knockdown cells showed a decrease in PQ2+-mediated cell death compared to cells expressing basal levels of m-aconitase (Fig 4D). Together these results implicate oxidative inactivation of m-aconitase as a contributing factor to dopaminergic cell death.
Decreased m-aconitase expression changes cellular metabolism
Since m-aconitase plays an essential metabolic role in the TCA cycle, we proceeded to determine the bioenergetic consequences of decreased m-aconitase expression and whether they conferred resistance to PQ2+ neurotoxicity. To address this question, we conducted a complete bioenergetic profile using a Seahorse XF24 Analyzer on cells expressing basal or decreased levels of m-aconitase in the presence or absence of PQ2+. A bioenergetic profile includes the addition of ETC inhibitors in order to place the mitochondria in different states of respiration; they include the ATP synthase inhibitor oligomycin, the mitochondrial uncoupler FCCP, and the complex III inhibitor antimycin A. Cells were transfected with non-targeting and m-aconitase siRNA for 72 hrs and oxygen consumption and glycolytic rates were measured. Figure 5A shows decreased oxygen consumption rates (OCR) in m-aconitase knockdown N27 cells compared to cells expressing basal m-aconitase (non-targeting). In addition, rates of glycolysis, as measured by changes in the extracellular acidification rate (ECAR), were also decreased in m-aconitase knockdown cells (Fig 5B). Respiration parameters can be extrapolated from the OCR data of the bioenergetic profile (as described by Seahorse Biosciences). This enables one to determine 1) basal respiration, 2) ATP turnover (amount of O2 consumption devoted to ATP production), 3) H+ leak (amount of O2 consumption devoted to maintaining the proton gradient) and 4) respiratory capacity (the maximal respiratory rate under conditions of uncoupled respiration). m-Aconitase knockdown N27 cells showed significantly decreased basal respiration, ATP turnover, H+ leak and respiratory capacity (Figs 5C-F). These data suggest that although m-aconitase knockdown cells were efficiently respiring, they were doing so at significantly lower rates.
Figure 5. Oxygen consumption rates, glycolytic rates and respiration parameters are decreased in m-aconitase knockdown N27 cells.
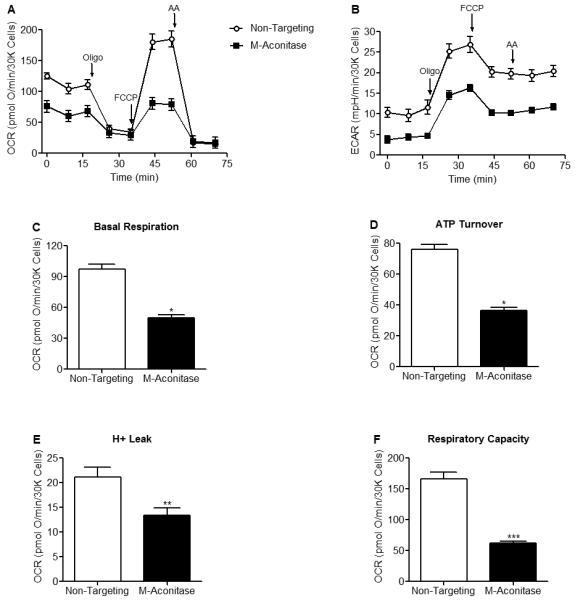
Cells were transfected with non-targeting or m-aconitase siRNA for 72 hrs and oxygen consumption rates and glycolytic rates were measured using a Seahorse XF24 Analyzer. (A) Basal and FCCP-stimulated oxygen consumption rates were decreased in m-aconitase knockdown cells (m-aconitase, closed squares) compared to cells expressing basal levels of m-aconitase (non-targeting, open circles). (B) Rates of glycolysis were decreased in m-aconitase knockdown cells compared to cells expressing basal m-aconitase. (C) Basal respiration, (D) ATP turnover, (E) H+ leak and (F) Respiratory capacity were all significantly decreased in m-aconitase knockdown cells compared to cells expressing basal levels of m-aconitase, (n = 10). Arrows indicate where oligomycin (oligo), FCCP and antimycin A (AA) were added. Data points and bars represent mean ± SEM, * indicates significant difference compared to non-targeting siRNA transfected cells (p < 0.05, student’s t-test).
PQ2+ treatment decreases respiratory capacity and glycolysis, and increases H+ leak
Since m-aconitase knockdown uniformly decreases both OCR and glycolysis, it is possible that their resistance to PQ2+ neurotoxicity may be related to a metabolic effect in addition to Fe2+ and H2O2 released via oxidative inactivation. We therefore examined the effects of early PQ2+ exposure on OCR and glycolysis in naïve (non-transfected) N27 cells. After early PQ2+ exposure, a bioenergetic profile demonstrated that FCCP-dependent respiration (Fig 6A) and glycolysis (Fig 6B) were decreased in PQ2+ treated cells. Quantification of respiration parameters clearly indicated that basal respiration (Fig 6C) and ATP turnover (Fig 6D) remained unaltered after PQ2+ treatment while H+ leak (Fig 6E) significantly increased and respiratory capacity (Fig 6F) decreased. This suggests that PQ2+-dependent neurotoxicity may be a result of increased H+ leak in addition to decreased respiratory capacity.
Figure 6. FCCP-stimulated oxygen consumption rates, glycolytic rates and respiratory capacity are decreased in PQ2+ treated N27 cells.
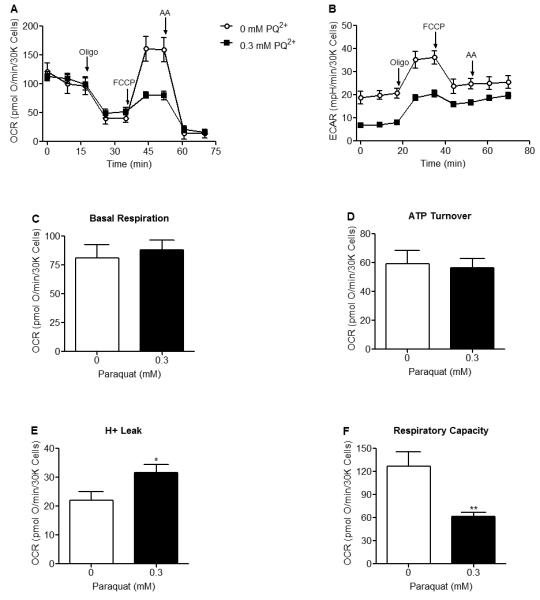
Oxygen consumption rates and glycolytic rates were measured using a Seahorse XF24 Analyzer after early exposure to 0 or 0.3 mM PQ2+. (A) FCCP-stimulated oxygen consumption rates were decreased in 0.3 mM PQ2+ incubated cells (closed squares) compared to control (0 mM PQ2+, open circles). (B) Rates of glycolysis were decreased in 0.3 mM PQ2+ incubated cells compared to control (0 mM PQ2+). (C,D) No change in basal respiration or ATP turnover was observed after early PQ2+ exposure. (E) H+ leak was significantly increased in 0.3 mM PQ2+ treated N27 cells compared to control (0 mM PQ2+). (F) Respiratory capacity was significantly decreased in 0.3 mM PQ2+ treated N27 cells compared to control (0 mM PQ2+). Similar results were seen with 1mM PQ2+ (data not shown). Arrows indicate where oligomycin (oligo), FCCP and antimycin A (AA) were added, * indicates significant difference compared to 0 mM PQ2+, (n = 5). Data points and bars represent mean ± SEM, (p < 0.05, student’s t-test).
PQ2+ exacerbates basal and stimulated OCR and glycolysis but attenuates H+ leak and respiratory capacity in m-aconitase knockdown N27 cells
We proceeded to determine the effect of PQ2+ on OCR and glycolysis in m-aconitase knockdown cells. N27 cells were transfected with non-targeting and m-aconitase siRNA for 72 hrs followed by early exposure to PQ2+. As observed in Fig 5, knocking down m-aconitase decreased both OCR and glycolysis. A secondary insult by PQ2+ further decreased OCR and glycolysis (Figs 7A, B). Likewise, PQ2+ incubation further decreased basal respiration and ATP Turnover in m-aconitase knockdown cells (Figs 7C, D). However, PQ2+-dependent increases in H+ leak were significantly attenuated in m-aconitase knockdown cells (Fig 7E), suggesting that decreased H+ leak may be a potential mechanism by which m-aconitase knockdown cells are protected from PQ2+-dependent cell death. Respiratory capacity was unchanged between non-targeting and m-aconitase knockdown cells in the presence of PQ2+ (Fig 7F). However, the decrease in respiratory capacity after PQ2+ exposure in m-aconitase knockdown cells (88 ± 13 pmolO2/min/30Kcells) was significantly lower than in cells expressing basal m-aconitase (non-targeting) (173 ± 28 pmolO2/min/30Kcells). Respiratory capacity deficiency has been described as a key index implicated in cell death (Yadava and Nicholls 2007). Therefore, neuroprotection resulting from decreased m-aconitase expression may be due to metabolic mechanisms via decreased H+ leak and decreased respiratory capacity deficiency.
Figure 7. PQ2+ exacerbates basal and stimulated OCR and glycolysis but attenuates H+ leak and respiratory capacity in m-aconitase knockdown N27 cells.

Cells were transfected with non-targeting and m-aconitase siRNA for 72 hrs and oxygen consumption and glycolytic rates were measured after early exposure to 0 or 0.3 mM PQ2+. (A and B) Oxygen consumption and glycolytic rates were exacerbated in PQ2+-treated, m-aconitase transfected N27 cells; non-targeting, 0 mM PQ2+ (open circles); m-aconitase, 0 mM PQ2+ (closed squares), non-targeting, 0.3 mM PQ2+ (open triangle); and m-aconitase, 0.3 mM PQ2+ (closed triangle). (C-D) Basal respiration and ATP turnover were exacerbated in PQ2+-treated, m-aconitase transfected cells. (E) PQ2+-dependent increase in H+ leak was significantly reversed in m-aconitase knockdown cells. (F) PQ2+-dependent decrease in respiratory capacity was not significantly different between m-aconitase knockdown cells (m-aconitase) and cells expressing basal levels of m-aconitase (non-targeting). Values shown are in pmolO2/min/30Kcells. Arrows indicate where oligomycin (oligo), FCCP and antimycin A (AA) were added, (n = 5). Data points and bars represent mean ± SEM, α indicates statistical difference compared to non-targeting, 0 mM PQ2+; β indicates statistical difference compared to m-aconitase, 0 mM PQ2+; * indicates statistical difference between non-targeting and m-aconitase, (p < 0.05, two-way ANOVA).
Discussion
This study supports the hypothesis that oxidative inactivation of m-aconitase serves as a source of iron and ROS and as a contributor of neuronal death. First, N27 dopaminergic cells showed a PQ2+-dependent increase in H2O2, Fe2+ and cell death. Second, decreased m-aconitase expression in N27 cells by RNA interference significantly attenuated PQ2+-induced increases in H2O2, Fe2+ and cell death. Third, m-aconitase knockdown N27 cells showed lower basal and stimulated metabolic rates (OCR and glycolysis). Finally, PQ2+-dependent increase in H+ leak and respiratory capacity deficiency were attenuated in m-aconitase knockdown cells. Together these findings suggest that both oxidative and metabolic mechanisms may contribute to neuroprotection in m-aconitase knockdown cells by 1) decreasing ROS production and 2) lowering metabolic function which in turn attenuates H+ leak and respiratory capacity deficiency under conditions of oxidative stress.
Aconitase and other [4Fe-4S] containing dehydratases have been extensively characterized as targets of ROS, specifically O2.− and ONOO− (Gardner and Fridovich 1991b, 1991a; Flint et al. 1993; Keyer and Imlay 1997). Aconitase inactivation has been reported in various human neurodegenerative disorders associated with mitochondrial oxidative stress including Huntington’s disease, Friedreich’s ataxia, progressive supranuclear palsy and temporal lobe epilepsy (Rotig et al. 1997; Schapira 1999; Tabrizi et al. 1999; Park et al. 2001; Vielhaber et al. 2008). Furthermore, aconitase inactivation has been shown in animal and cell models of neurodegeneration such as the Huntington R6/2 transgenic mouse (Tabrizi et al. 2000), MnSOD deficient mice (Melov et al. 1999; Liang and Patel 2004a), DJ1 knockout mice (Andres-Mateos et al. 2007), PINK1 knockout mice (Gautier et al. 2008), MPTP treated mice (Liang and Patel 2004b), cerebral ischemia (Mackensen et al. 2001), aging (Yan et al. 1997; Patel and Li 2003), oxygen glucose deprivation (Li et al. 2001), β-amyloid toxicity (Longo et al. 2000), excitotoxicity (Patel et al. 1996) and MPP+ neurotoxicity (Kalivendi et al. 2003; Shang et al. 2004). Aconitase inactivation is frequently used as a marker for oxidative stress (Gardner and Fridovich 1992). Because the mitochondrial isoform accounts for the majority of aconitase in the brain (~85%) (Liang et al. 2000), it is suggested that m-aconitase is a sensitive target of ROS in dopaminergic cells.
In addition to being a target of ROS, there is evidence that m-aconitase can be a source of ROS and free mitochondrial iron (Liochev and Fridovich 1994). Aconitase inactivation by O2.− was first suggested to be a source of .OH via the production of H2O2 and Fe2+ in cell free systems by Flint et al. (1993). Evidence of .OH production from bovine heart purified m-aconitase was later shown by Vasquez-Vivar (2000). In addition, aconitase has been shown to be a source of iron and toxicity in bacteria and yeast (Gardner and Fridovich 1991b; Longo et al. 1999).
Work from our laboratory has been focused on determining a role for m-aconitase in mediating O2.− neurotoxicity via oxidative inactivation. We have shown that m-aconitase may be an important source of iron in MPTP neurotoxicity (Liang and Patel 2004b). Importantly, we recently demonstrated that overexpression and inactivation of m-aconitase by PQ2+ increased free mitochondrial iron, H2O2 and neurotoxicity in primary midbrain cultures (Cantu et al. 2009). However, in the latter study, adenoviral m-aconitase transduction occurred predominantly in astrocytes and H2O2 release injured neighboring neurons. This prompted us to 1) investigate whether knocking down m-aconitase in dopaminergic cells would protect them by releasing less H2O2 and Fe2+ after inactivation of the enzyme and 2) determine the relative roles of oxidative stress and metabolism in the mechanism. Consistent with our previous work, two major findings provide evidence that oxidative inactivation of m-aconitase releases redox active iron and H2O2 which contribute to cell death. First, PQ2+ incubation inactivates aconitase, increases iron and increases H2O2 at times preceding cell death (Figs 1, 2). In N27 cells, PQ2+ leads to neuronal death at considerably earlier time-points of ~18-24 hrs compared to MPP+ which predominately occurs at ~48 hrs (Drechsel et al. 2007; Cantu et al. 2009). Therefore, it is highly unlikely that N27 cells are producing considerable amounts of H2O2 at 18 hrs, as cells are already dead or dying at this time-point and the production of ROS by PQ2+ depends on the inner mitochondrial transmembrane potential (Castello et al. 2007). Second, knocking down m-aconitase significantly attenuates PQ2+-induced increases in H2O2, Fe2+ and cell death (Fig 4). A posttranslational mechanism of inactivation is supported by the ability of iron and reactivation agents to reactivate PQ2+-induced inactivation of aconitase and unchanged apoprotein levels. Because our studies focused on the effects of mitochondrial aconitase inactivation via the production of O2.− by PQ2+, we speculate that both necrotic and apoptotic mechanisms of cell death contributed to PQ2+-induced cell death (Patel et al. 1996; Li et al. 2001; Peng et al. 2004).
Although other mechanism exist for increased H2O2 and Fe2+ in N27 cells, neurons and parkinsonian substantia nigra (i.e. NADPH oxidase, uncoupling protein-2, prolyl hydroxylase, neuromelanin, ferritin, and lactotransferrin), the fact that decreased m-aconitase expression directly attenuates production of H2O2 and Fe2+ suggests a major role for m-aconitase as their source (Youdim and Riederer 1993; Gerlach et al. 1997; Double et al. 2000; Cristovao et al. 2009; Lee et al. 2009; Zhang et al. 2009). Together, these findings demonstrate that oxidative inactivation of m-aconitase mediates neurotoxicity.
The basis of the PQ2+-induced attenuation of H2O2, Fe2+ and cell death in m-aconitase knockdown N27 cells is most likely due to decreased availability of the target (m-aconitase) for oxidative inactivation and therefore eliminating an important source of ROS and iron. This is consistent with our previous observations that N,N’-bis (2-hydroxybenzyl) ethylenediamine-N,N’-diacetic acid (HBED) and catalase inhibit PQ2+-induced neurotoxicity (Cantu et al. 2009). It is important to note that m-aconitase was not completely knocked out; approximately 27-40% m-aconitase protein was still detectable after 72 hrs of transfection with m-aconitase siRNA (Fig 3). Since m-aconitase is primarily involved in the isomerization of citrate via the TCA cycle, m-aconitase deficiency per se may have a deleterious effect due to interference with mitochondrial metabolism. Whereas a global decrease in total cellular respiration (i.e. basal and stimulated OCR and glycolysis) occurred in N27 cells deficient in m-aconitase (Fig 5), they were resistant to PQ2+-induced oxidative stress and cell death (Fig 4) rather than being more vulnerable. This is consistent with the observations of Tretter and Adam-Vizi (2005) that completely abolishing m-aconitase activity allowed the TCA cycle to remain functional via the transamination of glutamate to α-ketoglutarate. Furthermore, anaplerotic mechanisms have long been known to prevent TCA dysfunctions arising from individual enzyme deficiencies (Gibala et al. 2000; Owen et al. 2002). Based on these data, we do not speculate that inhibiting m-aconitase activity would have any significant effect on the production of NADPH. Therefore, cellular antioxidant systems which rely on NADPH for energy, such as the thioredoxin and glutathione systems, should remain unaffected. The observation that m-aconitase deficiency lowers overall rates of OCR and glycolysis is indicative of metabolic quiescence or “hunkering down,” which has been proposed by Gardner (Gardner 1997) to explain the significance of O2.− sensing and inactivation by aconitase. Lower basal OCR and glycolytic rates may offer m-aconitase deficient cells a metabolic advantage and be cytoprotective in itself. In fact, TCA cycle mutations resulting in deficiency as seen in the fumarate hydratase deficient (FH-/FH-) UOK262 cell line and in isocitrate dehydrogenase 1 and 2 mutations are known to have oncogenic phenotypes (Reitman and Yan; Yang et al.). In the case of FH deficiency, cells exhibit a quintessential Warburg effect, by using aerobic glycolysis for metabolism (Yang et al.). In our model, glycolysis is decreased in m-aconitase knockdown cells (Fig 5), suggesting that cells are not relying on aerobic glycolysis for respiration as seen in cancer cells. This study highlights a mechanistic role of m-aconitase in mitochondrial oxidative stress. It is unlikely that decreasing metabolism to achieve neuroprotection could be a viable therapeutic avenue for neurodegenerative diseases such as PD in which mitochondrial function is already impaired (Arthur et al. 2009) and improving mitochondrial bioenergetics is neuroprotective (Yang et al. 2009).
Decreased metabolism may also be playing a role in the resistance of m-aconitase deficient N27 cells to PQ2+ neurotoxicity. This is based on our observation that m-aconitase knockdown cells showed a global decrease in total cellular metabolism (i.e. basal and stimulated OCR and glycolysis) while H+ leak and respiratory capacity deficiency were significantly attenuated after PQ2+ exposure. Respiratory capacity has been identified as a critical deleterious metabolic signature (Yadava and Nicholls 2007). Therefore, the resistance of m-aconitase deficient cells to PQ2+ toxicity suggests that both oxidative and metabolic mechanisms may be playing a role in protection. However, Yadava and Nicholls (2007) concluded that spare respiratory capacity rather than oxidative stress regulates glutamate excitotoxicity after rotenone treatment (Yadava and Nicholls 2007). Interestingly, when naïve cells were treated with PQ2+, glycolysis and respiratory capacity decreased, basal respiration and ATP turnover remained unchanged, and H+ leak increased (Fig 6). This suggests that in addition to respiratory capacity, increased H+ leak may also be a hallmark of neuronal death.
In conclusion, this study emphasizes the role of m-aconitase in mediating neurotoxicity via oxidative mechanisms involving deleterious release of Fe2+ and H2O2. Furthermore, by decreasing metabolism after m-aconitase knockdown, we were able to protect neurons from PQ2+-dependent cell death via attenuation of H+ leak and respiratory capacity deficiency.
Acknowledgements
This work was supported by National Institutes of Health Grants NS045748 (MP), NS039587 (MP), and Supplement NS039587-S1 (DC). We would also like to thank Kristen Ryan for helpful discussions.
Footnotes
- Fe2+
- ferrous iron
- Fe-S
- iron-sulfur
- H2O2
- hydrogen peroxide
- m-aconitase
- mitochondrial aconitase
- NO.
- nitric oxide
- O2.−
- superoxide
- ONOO−
- peroxynitrite
- PQ2+
- paraquat
- ROS
- reactive oxygen species
References
- Andres-Mateos E, Perier C, Zhang L, Blanchard-Fillion B, Greco TM, Thomas B, Ko HS, Sasaki M, Ischiropoulos H, Przedborski S, Dawson TM, Dawson VL. DJ-1 gene deletion reveals that DJ-1 is an atypical peroxiredoxin-like peroxidase. Proc Natl Acad Sci U S A. 2007;104:14807–14812. doi: 10.1073/pnas.0703219104. [DOI] [PMC free article] [PubMed] [Google Scholar]
- Arthur CR, Morton SL, Dunham LD, Keeney PM, Bennett JP., Jr. Parkinson’s disease brain mitochondria have impaired respirasome assembly, age-related increases in distribution of oxidative damage to mtDNA and no differences in heteroplasmic mtDNA mutation abundance. Mol Neurodegener. 2009;4:37. doi: 10.1186/1750-1326-4-37. [DOI] [PMC free article] [PubMed] [Google Scholar]
- Baron M, Kudin AP, Kunz WS. Mitochondrial dysfunction in neurodegenerative disorders. Biochem Soc Trans. 2007;35:1228–1231. doi: 10.1042/BST0351228. [DOI] [PubMed] [Google Scholar]
- Beal MF. Mitochondrial dysfunction in neurodegenerative diseases. Biochim Biophys Acta. 1998;1366:211–223. doi: 10.1016/s0005-2728(98)00114-5. [DOI] [PubMed] [Google Scholar]
- Berg D, Youdim MB. Role of iron in neurodegenerative disorders. Top Magn Reson Imaging. 2006;17:5–17. doi: 10.1097/01.rmr.0000245461.90406.ad. [DOI] [PubMed] [Google Scholar]
- Boveris A, Chance B. The mitochondrial generation of hydrogen peroxide. General properties and effect of hyperbaric oxygen. Biochem J. 1973;134:707–716. doi: 10.1042/bj1340707. [DOI] [PMC free article] [PubMed] [Google Scholar]
- Cantu D, Schaack J, Patel M. Oxidative inactivation of mitochondrial aconitase results in iron and H2O2-mediated neurotoxicity in rat primary mesencephalic cultures. PLoS One. 2009;4:e7095. doi: 10.1371/journal.pone.0007095. [DOI] [PMC free article] [PubMed] [Google Scholar]
- Castello PR, Drechsel DA, Patel M. Mitochondria are a major source of paraquat-induced reactive oxygen species production in the brain. J Biol Chem. 2007;282:14186–14193. doi: 10.1074/jbc.M700827200. [DOI] [PMC free article] [PubMed] [Google Scholar]
- Clarkson ED, Rosa FG, Edwards-Prasad J, Weiland DA, Witta SE, Freed CR, Prasad KN. Improvement of neurological deficits in 6-hydroxydopamine-lesioned rats after transplantation with allogeneic simian virus 40 large tumor antigen gene-induced immortalized dopamine cells. Proc Natl Acad Sci U S A. 1998;95:1265–1270. doi: 10.1073/pnas.95.3.1265. [DOI] [PMC free article] [PubMed] [Google Scholar]
- Cristovao AC, Choi DH, Baltazar G, Beal MF, Kim YS. The role of NADPH oxidase 1-derived reactive oxygen species in paraquat-mediated dopaminergic cell death. Antioxid Redox Signal. 2009;11:2105–2118. doi: 10.1089/ars.2009.2459. [DOI] [PMC free article] [PubMed] [Google Scholar]
- Double KL, Gerlach M, Youdim MB, Riederer P. Impaired iron homeostasis in Parkinson’s disease. J Neural Transm Suppl. 2000:37–58. doi: 10.1007/978-3-7091-6301-6_3. [DOI] [PubMed] [Google Scholar]
- Drechsel DA, Liang LP, Patel M. 1-methyl-4-phenylpyridinium-induced alterations of glutathione status in immortalized rat dopaminergic neurons. Toxicol Appl Pharmacol. 2007;220:341–348. doi: 10.1016/j.taap.2007.02.002. [DOI] [PMC free article] [PubMed] [Google Scholar]
- Flint DH, Tuminello JF, Emptage MH. The inactivation of Fe-S cluster containing hydro-lyases by superoxide. J Biol Chem. 1993;268:22369–22376. [PubMed] [Google Scholar]
- Gardner PR. Superoxide-driven aconitase FE-S center cycling. Biosci Rep. 1997;17:33–42. doi: 10.1023/a:1027383100936. [DOI] [PubMed] [Google Scholar]
- Gardner PR, Fridovich I. Superoxide sensitivity of the Escherichia coli 6-phosphogluconate dehydratase. J Biol Chem. 1991a;266:1478–1483. [PubMed] [Google Scholar]
- Gardner PR, Fridovich I. Superoxide sensitivity of the Escherichia coli aconitase. J Biol Chem. 1991b;266:19328–19333. [PubMed] [Google Scholar]
- Gardner PR, Fridovich I. Inactivation-reactivation of aconitase in Escherichia coli. A sensitive measure of superoxide radical. J Biol Chem. 1992;267:8757–8763. [PubMed] [Google Scholar]
- Gautier CA, Kitada T, Shen J. Loss of PINK1 causes mitochondrial functional defects and increased sensitivity to oxidative stress. Proc Natl Acad Sci U S A. 2008;105:11364–11369. doi: 10.1073/pnas.0802076105. [DOI] [PMC free article] [PubMed] [Google Scholar]
- Gerlach M, Double K, Riederer P, Hirsch E, Jellinger K, Jenner P, Trautwein A, Youdim MB. Iron in the Parkinsonian substantia nigra. Mov Disord. 1997;12:258–260. [PubMed] [Google Scholar]
- Gibala MJ, Young ME, Taegtmeyer H. Anaplerosis of the citric acid cycle: role in energy metabolism of heart and skeletal muscle. Acta Physiol Scand. 2000;168:657–665. doi: 10.1046/j.1365-201x.2000.00717.x. [DOI] [PubMed] [Google Scholar]
- Imlay JA, Fridovich I. Assay of metabolic superoxide production in Escherichia coli. J Biol Chem. 1991;266:6957–6965. [PubMed] [Google Scholar]
- Jenner P. Oxidative stress in Parkinson’s disease. Ann Neurol. 2003;53(Suppl 3):S26–36. doi: 10.1002/ana.10483. discussion S36-28. [DOI] [PubMed] [Google Scholar]
- Kalivendi SV, Kotamraju S, Cunningham S, Shang T, Hillard CJ, Kalyanaraman B. 1-Methyl-4-phenylpyridinium (MPP+)-induced apoptosis and mitochondrial oxidant generation: role of transferrin-receptor-dependent iron and hydrogen peroxide. Biochem J. 2003;371:151–164. doi: 10.1042/BJ20021525. [DOI] [PMC free article] [PubMed] [Google Scholar]
- Kaur D, Andersen J. Does cellular iron dysregulation play a causative role in Parkinson’s disease? Ageing Res Rev. 2004;3:327–343. doi: 10.1016/j.arr.2004.01.003. [DOI] [PubMed] [Google Scholar]
- Keyer K, Imlay JA. Superoxide accelerates DNA damage by elevating free-iron levels. Proc Natl Acad Sci U S A. 1996;93:13635–13640. doi: 10.1073/pnas.93.24.13635. [DOI] [PMC free article] [PubMed] [Google Scholar]
- Keyer K, Imlay JA. Inactivation of dehydratase [4Fe-4S] clusters and disruption of iron homeostasis upon cell exposure to peroxynitrite. J Biol Chem. 1997;272:27652–27659. doi: 10.1074/jbc.272.44.27652. [DOI] [PubMed] [Google Scholar]
- Kim HY, LaVaute T, Iwai K, Klausner RD, Rouault TA. Identification of a conserved and functional iron-responsive element in the 5′-untranslated region of mammalian mitochondrial aconitase. J Biol Chem. 1996;271:24226–24230. doi: 10.1074/jbc.271.39.24226. [DOI] [PubMed] [Google Scholar]
- Koen AL, Goodman M. Aconitate hydratase isozymes: subcellular location, tissue distribution and possible subunit structure. Biochim Biophys Acta. 1969;191:698–701. doi: 10.1016/0005-2744(69)90363-5. [DOI] [PubMed] [Google Scholar]
- Lee DW, Rajagopalan S, Siddiq A, Gwiazda R, Yang L, Beal MF, Ratan RR, Andersen JK. Inhibition of prolyl hydroxylase protects against 1-methyl-4-phenyl-1,2,3,6-tetrahydropyridine-induced neurotoxicity: model for the potential involvement of the hypoxia-inducible factor pathway in Parkinson disease. J Biol Chem. 2009;284:29065–29076. doi: 10.1074/jbc.M109.000638. [DOI] [PMC free article] [PubMed] [Google Scholar]
- Lemire J, Mailloux R, Appanna VD. Zinc toxicity alters mitochondrial metabolism and leads to decreased ATP production in hepatocytes. J Appl Toxicol. 2007 doi: 10.1002/jat.1263. [DOI] [PubMed] [Google Scholar]
- Li QY, Pedersen C, Day BJ, Patel M. Dependence of excitotoxic neurodegeneration on mitochondrial aconitase inactivation. J Neurochem. 2001;78:746–755. doi: 10.1046/j.1471-4159.2001.00457.x. [DOI] [PubMed] [Google Scholar]
- Liang LP, Patel M. Mitochondrial oxidative stress and increased seizure susceptibility in Sod2(−/+) mice. Free Radic Biol Med. 2004a;36:542–554. doi: 10.1016/j.freeradbiomed.2003.11.029. [DOI] [PubMed] [Google Scholar]
- Liang LP, Patel M. Iron-sulfur enzyme mediated mitochondrial superoxide toxicity in experimental Parkinson’s disease. J Neurochem. 2004b;90:1076–1084. doi: 10.1111/j.1471-4159.2004.02567.x. [DOI] [PubMed] [Google Scholar]
- Liang LP, Ho YS, Patel M. Mitochondrial superoxide production in kainate-induced hippocampal damage. Neuroscience. 2000;101:563–570. doi: 10.1016/s0306-4522(00)00397-3. [DOI] [PubMed] [Google Scholar]
- Lin MT, Beal MF. Mitochondrial dysfunction and oxidative stress in neurodegenerative diseases. Nature. 2006;443:787–795. doi: 10.1038/nature05292. [DOI] [PubMed] [Google Scholar]
- Liochev SI, Fridovich I. The role of O2.− in the production of HO.: in vitro and in vivo. Free Radic Biol Med. 1994;16:29–33. doi: 10.1016/0891-5849(94)90239-9. [DOI] [PubMed] [Google Scholar]
- Longo VD, Liou LL, Valentine JS, Gralla EB. Mitochondrial superoxide decreases yeast survival in stationary phase. Arch Biochem Biophys. 1999;365:131–142. doi: 10.1006/abbi.1999.1158. [DOI] [PubMed] [Google Scholar]
- Longo VD, Viola KL, Klein WL, Finch CE. Reversible inactivation of superoxide-sensitive aconitase in Abeta1-42-treated neuronal cell lines. J Neurochem. 2000;75:1977–1985. doi: 10.1046/j.1471-4159.2000.0751977.x. [DOI] [PubMed] [Google Scholar]
- Mackensen GB, Patel M, Sheng H, Calvi CL, Batinic-Haberle I, Day BJ, Liang LP, Fridovich I, Crapo JD, Pearlstein RD, Warner DS. Neuroprotection from delayed postischemic administration of a metalloporphyrin catalytic antioxidant. J Neurosci. 2001;21:4582–4592. doi: 10.1523/JNEUROSCI.21-13-04582.2001. [DOI] [PMC free article] [PubMed] [Google Scholar]
- Melov S, Coskun P, Patel M, Tuinstra R, Cottrell B, Jun AS, Zastawny TH, Dizdaroglu M, Goodman SI, Huang TT, Miziorko H, Epstein CJ, Wallace DC. Mitochondrial disease in superoxide dismutase 2 mutant mice. Proc Natl Acad Sci U S A. 1999;96:846–851. doi: 10.1073/pnas.96.3.846. [DOI] [PMC free article] [PubMed] [Google Scholar]
- Murphy MP. How mitochondria produce reactive oxygen species. Biochem J. 2009;417:1–13. doi: 10.1042/BJ20081386. [DOI] [PMC free article] [PubMed] [Google Scholar]
- Owen OE, Kalhan SC, Hanson RW. The key role of anaplerosis and cataplerosis for citric acid cycle function. J Biol Chem. 2002;277:30409–30412. doi: 10.1074/jbc.R200006200. [DOI] [PubMed] [Google Scholar]
- Park LC, Albers DS, Xu H, Lindsay JG, Beal MF, Gibson GE. Mitochondrial impairment in the cerebellum of the patients with progressive supranuclear palsy. J Neurosci Res. 2001;66:1028–1034. doi: 10.1002/jnr.10062. [DOI] [PubMed] [Google Scholar]
- Patel M, Li QY. Age dependence of seizure-induced oxidative stress. Neuroscience. 2003;118:431–437. doi: 10.1016/s0306-4522(02)00979-x. [DOI] [PubMed] [Google Scholar]
- Patel M, Day BJ, Crapo JD, Fridovich I, McNamara JO. Requirement for superoxide in excitotoxic cell death. Neuron. 1996;16:345–355. doi: 10.1016/s0896-6273(00)80052-5. [DOI] [PubMed] [Google Scholar]
- Peng J, Mao XO, Stevenson FF, Hsu M, Andersen JK. The herbicide paraquat induces dopaminergic nigral apoptosis through sustained activation of the JNK pathway. J Biol Chem. 2004;279:32626–32632. doi: 10.1074/jbc.M404596200. [DOI] [PubMed] [Google Scholar]
- Petrat F, Weisheit D, Lensen M, de Groot H, Sustmann R, Rauen U. Selective determination of mitochondrial chelatable iron in viable cells with a new fluorescent sensor. Biochem J. 2002;362:137–147. doi: 10.1042/0264-6021:3620137. [DOI] [PMC free article] [PubMed] [Google Scholar]
- Reitman ZJ, Yan H. Isocitrate Dehydrogenase 1 and 2 Mutations in Cancer: Alterations at a Crossroads of Cellular Metabolism. J Natl Cancer Inst. doi: 10.1093/jnci/djq187. [DOI] [PMC free article] [PubMed] [Google Scholar]
- Ross KL, Eisenstein RS. Iron deficiency decreases mitochondrial aconitase abundance and citrate concentration without affecting tricarboxylic acid cycle capacity in rat liver. J Nutr. 2002;132:643–651. doi: 10.1093/jn/132.4.643. [DOI] [PubMed] [Google Scholar]
- Rotig A, de Lonlay P, Chretien D, Foury F, Koenig M, Sidi D, Munnich A, Rustin P. Aconitase and mitochondrial iron-sulphur protein deficiency in Friedreich ataxia. Nat Genet. 1997;17:215–217. doi: 10.1038/ng1097-215. [DOI] [PubMed] [Google Scholar]
- Schapira AH. Mitochondrial involvement in Parkinson’s disease, Huntington’s disease, hereditary spastic paraplegia and Friedreich’s ataxia. Biochim Biophys Acta. 1999;1410:159–170. doi: 10.1016/s0005-2728(98)00164-9. [DOI] [PubMed] [Google Scholar]
- Schapira AH. Mitochondria in the aetiology and pathogenesis of Parkinson’s disease. Lancet Neurol. 2008;7:97–109. doi: 10.1016/S1474-4422(07)70327-7. [DOI] [PubMed] [Google Scholar]
- Shang T, Kotamraju S, Kalivendi SV, Hillard CJ, Kalyanaraman B. 1-Methyl-4-phenylpyridinium-induced apoptosis in cerebellar granule neurons is mediated by transferrin receptor iron-dependent depletion of tetrahydrobiopterin and neuronal nitric-oxide synthase-derived superoxide. J Biol Chem. 2004;279:19099–19112. doi: 10.1074/jbc.M400101200. [DOI] [PubMed] [Google Scholar]
- Sipos I, Tretter L, Adam-Vizi V. The production of reactive oxygen species in intact isolated nerve terminals is independent of the mitochondrial membrane potential. Neurochem Res. 2003;28:1575–1581. doi: 10.1023/a:1025634728227. [DOI] [PubMed] [Google Scholar]
- Tabrizi SJ, Cleeter MW, Xuereb J, Taanman JW, Cooper JM, Schapira AH. Biochemical abnormalities and excitotoxicity in Huntington’s disease brain. Ann Neurol. 1999;45:25–32. doi: 10.1002/1531-8249(199901)45:1<25::aid-art6>3.0.co;2-e. [DOI] [PubMed] [Google Scholar]
- Tabrizi SJ, Workman J, Hart PE, Mangiarini L, Mahal A, Bates G, Cooper JM, Schapira AH. Mitochondrial dysfunction and free radical damage in the Huntington R6/2 transgenic mouse. Ann Neurol. 2000;47:80–86. doi: 10.1002/1531-8249(200001)47:1<80::aid-ana13>3.3.co;2-b. [DOI] [PubMed] [Google Scholar]
- Tretter L, Adam-Vizi V. Inhibition of Krebs cycle enzymes by hydrogen peroxide: A key role of [alpha]-ketoglutarate dehydrogenase in limiting NADH production under oxidative stress. J Neurosci. 2000;20:8972–8979. doi: 10.1523/JNEUROSCI.20-24-08972.2000. [DOI] [PMC free article] [PubMed] [Google Scholar]
- Tretter L, Adam-Vizi V. Alpha-ketoglutarate dehydrogenase: a target and generator of oxidative stress. Philos Trans R Soc Lond B Biol Sci. 2005;360:2335–2345. doi: 10.1098/rstb.2005.1764. [DOI] [PMC free article] [PubMed] [Google Scholar]
- Vasquez-Vivar J, Kalyanaraman B, Kennedy MC. Mitochondrial aconitase is a source of hydroxyl radical. An electron spin resonance investigation. J Biol Chem. 2000;275:14064–14069. doi: 10.1074/jbc.275.19.14064. [DOI] [PubMed] [Google Scholar]
- Vassault A. Lactate Dehydrogenase. In: Bergmeyer HU, editor. In Methods of Enzymatic Analysis. Verlag Chemie; Weinheim: 1983. pp. 118–126. [Google Scholar]
- Vielhaber S, Niessen HG, Debska-Vielhaber G, Kudin AP, Wellmer J, Kaufmann J, Schonfeld MA, Fendrich R, Willker W, Leibfritz D, Schramm J, Elger CE, Heinze HJ, Kunz WS. Subfield-specific loss of hippocampal N-acetyl aspartate in temporal lobe epilepsy. Epilepsia. 2008;49:40–50. doi: 10.1111/j.1528-1167.2007.01280.x. [DOI] [PubMed] [Google Scholar]
- Yadava N, Nicholls DG. Spare respiratory capacity rather than oxidative stress regulates glutamate excitotoxicity after partial respiratory inhibition of mitochondrial complex I with rotenone. J Neurosci. 2007;27:7310–7317. doi: 10.1523/JNEUROSCI.0212-07.2007. [DOI] [PMC free article] [PubMed] [Google Scholar]
- Yan LJ, Levine RL, Sohal RS. Oxidative damage during aging targets mitochondrial aconitase. Proc Natl Acad Sci U S A. 1997;94:11168–11172. doi: 10.1073/pnas.94.21.11168. [DOI] [PMC free article] [PubMed] [Google Scholar]
- Yang L, Calingasan NY, Wille EJ, Cormier K, Smith K, Ferrante RJ, Beal MF. Combination therapy with coenzyme Q10 and creatine produces additive neuroprotective effects in models of Parkinson’s and Huntington’s diseases. J Neurochem. 2009;109:1427–1439. doi: 10.1111/j.1471-4159.2009.06074.x. [DOI] [PMC free article] [PubMed] [Google Scholar]
- Yang Y, Valera VA, Padilla-Nash HM, Sourbier C, Vocke CD, Vira MA, Abu-Asab MS, Bratslavsky G, Tsokos M, Merino MJ, Pinto PA, Srinivasan R, Ried T, Neckers L, Linehan WM. UOK 262 cell line, fumarate hydratase deficient (FH-/FH-) hereditary leiomyomatosis renal cell carcinoma: in vitro and in vivo model of an aberrant energy metabolic pathway in human cancer. Cancer Genet Cytogenet. 196:45–55. doi: 10.1016/j.cancergencyto.2009.08.018. [DOI] [PMC free article] [PubMed] [Google Scholar]
- Youdim MB, Riederer P. The role of iron in senescence of dopaminergic neurons in Parkinson’s disease. J Neural Transm Suppl. 1993;40:57–67. [PubMed] [Google Scholar]
- Zhang X, Li L, Zhang L, Borowitz JL, Isom GE. Cyanide-induced death of dopaminergic cells is mediated by uncoupling protein-2 up-regulation and reduced Bcl-2 expression. Toxicol Appl Pharmacol. 2009;238:11–19. doi: 10.1016/j.taap.2009.03.020. [DOI] [PMC free article] [PubMed] [Google Scholar]