

Abstract
Prenatal cocaine exposure impairs brain development and produces lasting alterations in cognitive function. In a prenatal cocaine exposure mouse model, we found that tangential migration of GABA neurons from the basal to the dorsal forebrain and radial neuron migration within the dorsal forebrain were significantly decreased during the embryonic period. The decrease in the tangential migration occurred early in gestation and normalized by late gestation, despite ongoing cocaine exposure. The decrease in radial migration was associated with altered laminar positioning of neurons in the medial prefrontal cortex. The cocaine exposure led to transient decreases in the expression of Tbr2 and Tbr1, transcription factors associated with intermediate progenitor cells and newborn neurons of the dorsal forebrain, respectively, although neurogenesis was not significantly altered. Since cocaine can modulate brain derived neurotrophic factor (BDNF) expression in the mature brain, we examined whether cocaine can alter BDNF expression in the embryonic brain. We found a transient decrease in BDNF protein expression in the cocaine-exposed embryonic forebrain early in gestation. By late gestation, the BDNF expression recovered to control levels, despite ongoing cocaine exposure. In basal forebrain explants from cocaine-exposed embryos, cell migration was significantly decreased, corroborating the in vivo data on tangential GABA neuron migration. Since BDNF can influence tangential neuronal migration, we added BDNF to the culture medium and observed increased cell migration. Our data suggest that cocaine can alter tangential and radial neuronal migration as well as BDNF expression in the embryonic brain and that decreased BDNF may mediate cocaine's effects on neuronal migration.
Introduction
Fetal exposure to cocaine is associated with cognitive impairment in later life, including impaired attention, learning, executive function, and language (Chasnoff et al., 1989a,b; Chiriboga et al., 1993, 2009; Delaney-Black et al., 1996; Kosofsky and Wilkins, 1998; Eyler et al., 2009). Prenatal cocaine exposure decreases tangential migration of GABA neurons from the basal to the dorsal forebrain in mouse embryos (Crandall et al., 2004), suggesting potential for impairment of GABA circuit development in the cerebral cortex of prenatally cocaine-exposed subjects. However, whether the decrease in GABA neuron migration represented a transient delay or a permanent deficit was not clear. Moreover, the mechanisms mediating cocaine's effects on neuronal migration also remained unclear. Since prenatal cocaine exposure can alter the structure and function of inhibitory GABA circuits in the postnatal cerebral cortex (Stanwood et al., 2001; Lu et al., 2009; Huang et al. 2011), understanding the mechanisms mediating cocaine's effects on GABA neuron migration assumes added significance. Our earlier studies suggested that cocaine-induced impairment of dopamine receptor signaling in the basal forebrain (Kubrusly and Bhide, 2010) could lead to decreased tangential neuronal migration because activation of the dopamine receptors is sufficient to alter this type of neuronal migration (Crandall et al., 2007). However, whether an intermediary signaling molecule can link cocaine, dopamine receptor signaling, and neuronal migration remained an important mechanistic question. Brain derived neurotrophic factor (BDNF) emerges as a candidate molecule that could fulfill the role of an intermediary because its expression is sensitive to dopamine receptor signaling (Kuppers and Beyer, 2001; Iwakura et al., 2008; Williams and Undieh, 2009) and cocaine exposure (Le Foll et al., 2002, 2005), and perhaps more importantly, BDNF can modulate GABA neuron migration (Polleux et al., 2002; Snapyan et al., 2009). In this paper, we present evidence that BDNF signaling is one of the factors mediating cocaine's effects on GABA neuron migration.
The effects of cocaine on neurogenesis in the embryonic brain also remained incompletely resolved. Previous reports suggested that cerebral cortical neurogenesis in rat (Lee et al., 2010) and monkey fetuses may be affected by cocaine (Lidow and Song, 2001b). However, we did not find significant changes in cell proliferation in the mouse cerebral cortical neuroepithelium or ganglionic eminence as a result of cocaine exposure (Crandall et al., 2004). Therefore, whether fetal exposure to cocaine can alter neurogenesis in the mouse brain remained unresolved. We address this question by direct examination of cell output in the forebrain neuroepithelium.
In the present study, using GAD67-GFP knock-in mice, we show that daily exposure to cocaine from embryonic day 8 (E8) until birth can decrease tangential and radial migration of neurons. Cocaine's effects on tangential neuronal migration appear to be associated with cocaine-induced transient decreases in BDNF levels in the basal forebrain. These data reveal a novel BDNF-associated mechanism for the effects of cocaine on GABA neuron migration and reveal BDNF as a molecule that can mediate cocaine's effects beginning early in the fetal period.
Materials and Methods
Animals.
Heterozygote Swiss Webster GAD67-GFP knock-in mice (Tamamaki et al., 2003) and wild-type Swiss Webster mice were used. In the experiments involving the use of GAD67-GFP embryos, heterozygous GAD67-GFP mice and wild-type Swiss Webster mice were bred to obtain timed pregnancies. This mating paradigm eliminated production of homozygous knock-in mice that could have abnormal phenotypes (Tamamaki et al., 2003). In the experiments involving postnatal mice, in which identification of GFP positive (GFP+) cells was not warranted, wild-type Swiss Webster mice were used. The day of vaginal plug detection was considered as E0 and the day of birth as postnatal day 0 (P0). A transplacental cocaine exposure paradigm described previously (Kosofsky et al., 1994; Wilkins et al., 1998; Crandall et al., 2004; Kubrusly and Bhide, 2010) was used to expose mouse embryos to cocaine twice a day beginning on the morning of E8. In this protocol, on the sixth day of pregnancy (corresponding to E6), pregnant dams of comparable weight were assigned to cocaine or saline groups. From E8 until the day before the mouse was killed, cocaine was injected subcutaneously to the mice in the cocaine group twice daily (7:00 A.M. and 7:00 P.M.; 20 mg/kg per injection; total daily dose, 40 mg/kg). Dams in the saline group received subcutaneous saline injections (same volume as the cocaine injection to the cocaine dams) twice daily at the same time that the dams in the cocaine group received their cocaine injections. The dams were housed singly in a temperature- and humidity-controlled environment on a 12 h light/dark cycle, with food and water available ad libitum.
The age of each embryo was ascertained by examination of the external morphological features (Theiler, 1972; Kaufman, 1992). Embryos (or entire litters) that did not fulfill the criteria for a given age were discarded from analysis. All of the experimental procedures were in full compliance with institutional guidelines and the NIH Guide for the Care and Use of Laboratory Animals.
For analysis of the effects of prenatal cocaine exposure in P60 offspring, we cross-fostered the cocaine-exposed offspring to saline-exposed dams within 2 d of birth so that any effects at P60 on the histological parameters to be measured could be attributed to prenatal cocaine exposure rather than potential changes in interactions between the cocaine-exposed dams and their offspring compared to their saline-exposed counterparts. The offspring from all the mothers (i.e., saline or cocaine exposed) were weaned on P21.
Analysis of GABA neuron migration from the basal to the dorsal forebrain in the intact brain.
Timed-pregnant GAD67-GFP knock-in dams crossed with wild-type Swiss Webster males and exposed to either cocaine or saline from E8 onward were anesthetized (ketamine, 50 mg/kg body weight; xylazine, 10 mg/kg body weight, i.p.) on the 13th, 15th, or 17th day of pregnancy. The embryos were removed by hysterotomy. GFP+ embryos were identified GFP based on green fluorescence in the CNS visualized using GFP goggles (Biological Laboratory Equipment). The embryonic brains were removed and fixed by immersion in 4% buffered paraformaldehyde overnight at 4°C. The fixed brains were cryoprotected in sucrose and sectioned in the coronal plane at 20 μm thickness on a cryostat. The sections were mounted on SuperFrost Plus slides (Fisher Scientific), coverslipped with aqueous mounting medium (Vectashield; Vector Laboratories) and examined in a Zeiss Pascal confocal microscope. Confocal images of GFP+ cells were collected at 2.5 μm thickness (see Figs. 1, 2) from the future prefrontal cortex (PFC) and medial prefrontal cortex (MPFC). The two cortical areas were identified based on anatomical landmarks. In the case of the E13 embryos, visual inspection of the images revealed significant differences between the saline- and cocaine-exposed embryos; no quantitative measurements were required (see Fig. 1). However, in the case of the E15 and E17 embryos, visual inspection did not reveal significant differences. Therefore, we counted GFP+ cells within the PFC and MPFC separately for marginal zone (MZ), the cortical plate/subplate (CP/SP), and the intermediate zone (IZ). The ventricular zone (VZ) and subventricular zone (SVZ) did not contain many GFP+ cells at E15. Therefore, these two regions were not included in the analysis. The cell counts were performed within a rectangular grid of known area that encompassed each zone of the cerebral wall so that the number of GFP+ cells could be expressed as number per unit area for each zone.
Figure 1.

A–D, Confocal microscope images of coronal sections through the forebrain showing the distribution of GFP+ cells in the forebrain of E13 GAD67-GFP knock-in embryos exposed to saline (A, C) or cocaine (B, D) from E8 to E12. Dorsal is at the top and medial is to the right side in each micrograph. Robust GFP labeling is present in the ganglionic eminence/striatum (GE/STR) in both the saline- (A) and cocaine-exposed (B) embryos. A prominent stream of GFP+ cells extends into the dorsal forebrain (future cerebral cortex) in a lateral-to-medial direction in the IZ. A narrower layer of GFP+ cells in the MZ (A, B, asterisks) extends further medially than the IZ stream. The GFP stream in the IZ of the cocaine-exposed embryo (B) appears weaker than its counterpart in the saline-exposed embryo (A). Moreover, the GFP+ stream in the IZ of the cocaine-exposed embryo does not extend as far medially as does its counterpart in the saline-exposed embryo (arrows in A and B point to the medial extents of the streams). Higher-power images show that the morphology of the cells in the GFP+ stream in the IZ of the saline- (C) and cocaine-exposed (D) embryos is consistent with migrating cells (open arrows in C point to cells with long leading processes suggestive of direction of migration and elliptical cell bodies characteristic of migrating cells) and that the GFP label is restricted to cell bodies and processes. The leading edge of the GFP+ stream in the cocaine-exposed embryos lags behind its counterpart in the saline-exposed embryos (compare the position of the white arrows in C, D). The GFP+ band in the marginal zone (C, D, asterisks) also consists of GFP+ cells with morphological features consistent with cell migration. Dotted lines in A and B represent lateral ventricular border. LV, Lateral ventricle.
Figure 2.
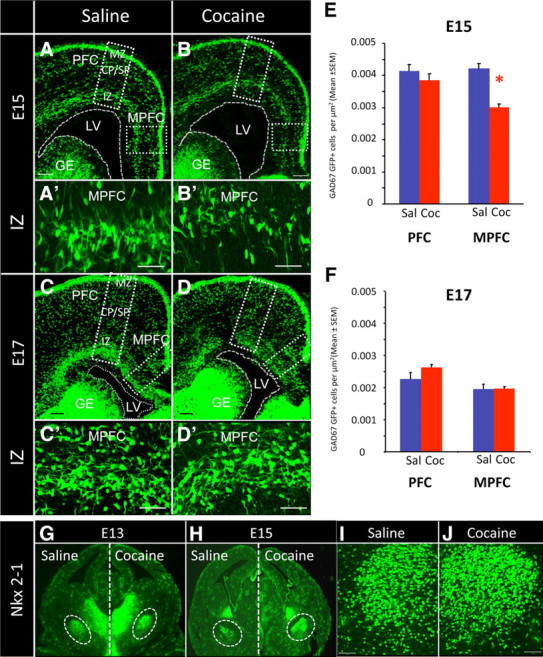
A–G, Confocal images of coronal sections through the embryonic forebrain showing GFP+ cells in the dorsal forebrain (A–D) and Nkx2-1 immunohistochemistry in the basal forebrain (G–J) of saline- (Sal) and cocaine (Coc)-exposed embryos. We analyzed the numerical density of GFP+ cells in the IZ and the CP/SP of the PFC and MPFC in E15 (A–B′) and E17 (C–D′) mice. Numerical density of GFP+ cells in the IZ showed a significant decrease in the MPFC of the cocaine-exposed group compared to the saline group at E15 (E). The PFC did not show significant differences in this parameter at E15 (E). Higher-power images of the IZ of the E15 MPFC from the saline- (A′) and cocaine-exposed (B′) embryos revealed fewer GFP+ cells in the cocaine-exposed embryo. Comparison of numerical density of GFP+ cells in the IZ of PFC and MPFC at E17 did not show significant differences between the cocaine- and saline-exposed groups (F). Higher-power images of the IZ of the E17 MPFC also did not suggest significant differences in GFP+ cell numbers between saline- (C′) and cocaine-exposed (D′) embryos. Immunohistochemistry showed significant upregulation of Nkx2-1 expression in the basal forebrain of the cocaine-exposed embryos at E13 and E15 compared to age-matched saline controls (G, H). The upregulation was particularly evident in striatal differentiating fields (white dotted circles). Higher magnification of the areas within the dotted circles in G shows Nkx2-1 overexpression in the E13 cocaine-exposed embryos (J) compared to the age-matched saline control (I). Error bars indicate SEM. LV, Lateral ventricle; GE, ganglionic eminence. Scale bars, 50 μm. *p < 0.05.
Immunohistochemistry.
Cryostat sections of the brain were immersed in warm antigen retrieval buffer (Retrievagen; BD Pharmingen) and microwaved on high setting for a total of 10 min (two 5 min periods, separated by a 2 min interval). The slides were left in the warm antigen retrieval solution for another 20 min, then cooled to room temperature and washed three times with 0.5 m PBS. Nonspecific binding was blocked with 10% normal donkey serum, containing 0.3% Triton X-100 (to improve permeability) for 1 h at room temperature. Sections were then incubated overnight at 4°C with Tbr2, Tbr1 (rabbit polyclonal; Abcam) and Nkx2-1 (Epitomics) primary antibodies, each diluted 1:200. Following PBS washes, the sections were incubated at room temperature for 1 h with Cy3- or Alexa Fluor 488-tagged secondary antibodies (Jackson Immunoresearch and Invitrogen, respectively). Following additional PBS washes, the slides were mounted using Vectashield mounting medium (Vector Laboratories).
The sections were examined using a Zeiss Pascal confocal microscope. Uniform penetration of the antibodies throughout the section was ascertained by splitting the image of the 20-μm-thick cryostat section into 2.5-μm-thick digital sections and examining the quality of the immunofluorescence in each digital section. Only those cryostat sections in which each of the 2.5 μm sections showed uniform labeling were included in further analysis. From each 20-μm-thick section, two 2.5-μm-thick digital sections were chosen randomly for analysis. Labeled cells were counted using a 20× objective lens. A grid of known size that was subdivided into equal sized bins was superimposed on the images of the PFC and MPFC to encompass the regions of interest. The grid was positioned such that the long axes of the bins were parallel to the ventricular border. The individual bins were numbered and oriented in such a way that bin 1 was always closest to the ventricular border. Labeled cells within each bin were counted and expressed as numbers per grid. The numerical density of labeled cells was expressed as numbers per square micrometer.
Analysis of cell output.
We analyzed cell output from the proliferative zones of the future PFC and MPFC by using a BrdU–Ki67 double-labeling paradigm (Chenn and Walsh, 2002). We injected BrdU (Sigma; 50 mg/kg, i.p.) into timed-pregnant mice carrying E12 or E14 embryos. The dams were anesthetized 24 h later, on E13 or E15, respectively, and the embryos were removed. The embryonic brains were fixed by immersion in 4% buffered paraformaldehyde overnight and cryoprotected in sucrose. The brains were sectioned on a cryostat at 20 μm thickness in the coronal plane and the sections were processed for BrdU and Ki67 immunohistochemistry. The same immunohistochemistry protocol as that described above was followed except that before incubation with the primary antibodies (BrdU, rat monoclonal; Ki67, rabbit polyclonal; both from Abcam and diluted to 1:200) the sections were incubated in 2N HCl for 1 h at room temperature to hydrolyze the double stranded DNA into single strands and expose the BrdU antigen.
Terminal deoxynucleotidyl transferase-mediated dUTP-biotin nick-end labeling analysis.
We performed terminal deoxynucleotidyl transferase-mediated dUTP-biotin nick-end labeling (TUNEL) analysis in E15 saline- or cocaine-exposed embryos. The embryos were collected from anesthetized dams and the embryonic heads were snap frozen in isopentane cooled to −4°C in liquid nitrogen. The frozen brains were sectioned on a cryostat in the coronal plane at a thickness of 20 μm and processed for TUNEL histochemistry according to manufacturer's instructions (Roche Diagnostics). The sections were stained with ToPro3 (Invitrogen) to label DNA, coverslipped with Vectastain (Vector), and examined under the confocal microscope to analyze TUNEL+ profiles in the neuroepithelial and postmitotic regions of the basal and dorsal telencephalon. Each set of slides processed for TUNEL histochemistry included positive and negative controls.
Western blotting.
Basal forebrain tissue was dissected from E13, E15, and E17 saline- or cocaine-exposed embryos, and Western blots were performed on whole-cell extracts using methods described previously (Sadri-Vakili et al., 2007, 2010). Briefly, 20 mg of each sample was boiled in the presence of sample buffer for 5 min before separation on 10–20% SDS-polyacrylamide gel, and proteins were transferred to nitrocellulose membranes. The nonspecific immunoreactivity was blocked with 5% nonfat dry milk dissolved in Tris-buffered saline containing 0.2% Tween 20 (TBST) for 60 min. The membranes were then incubated overnight at 4°C with anti-BDNF antibody (Aviva Systems Biology; diluted 1:700). The primary antibody incubation was followed by six washes (10 min; rocking; room temperature) in TBST before incubation with the secondary antibody (HRP-conjugated goat anti-rabbit IgG; Jackson ImmunoResearch Laboratories), six washes, and visualization using the ECL detection system (PerkinElmer New England Nuclear). The intensity of each BDNF band was normalized to the intensity of the corresponding GAPDH band, and an integrated density value (IDV) was calculated for each BDNF band using NIH Image J software. The IDVs for each age were compared between the prenatal treatment groups.
ELISA.
Samples of E15 basal forebrain were lysed, homogenized, and diluted to 10–20 μg/μl. The concentration of BDNF in the diluted lysates was quantified using the Chemikine BDNF Sandwich ELISA kit (Millipore Bioscience Research Reagents). The brain tissue samples and serial dilutions of BDNF standards were loaded in triplicate onto a microplate coated with rabbit anti-human BDNF polyclonal antibodies and incubated overnight at 4°C. After four washes, biotinylated mouse anti-human BDNF monoclonal antibody (1:1000) was added to the microplate for 2.5 h at room temperature. The plates were washed four times, and the strepavidin-enzyme conjugate was added to the plate and allowed to incubate for 1 h. After further washing, tetramethylbenzidine chromagenic substrate was added and 15 min later the reaction was stopped. The absorbance at 450 nm was measured with a plate reader. BDNF concentration in the tissue samples was quantified by comparing values to the prepared standard curve.
Analysis of cell migration in explants of the basal forebrain.
Saline- or cocaine-exposed dams were anesthetized on the 13th day of pregnancy between 9:00 and 10:00 A.M. The embryos were removed by hysterectomy. The embryos were decapitated, and the heads were immersed in 8% agarose (type VII; Sigma). Coronal sections of the embryonic brains were cut at a thickness of 250 μm on a Vibratome. A sterile biopsy punch (Miltex) was used to collect discs of medial ganglionic eminence (MGE) from the Vibratome sections. The use of Vibratome sections (rather than microdissection of the brain) ensured reliable identification of the MGE under a dissecting microscope for the purpose of collecting samples. Although the discs collected in this fashion contained MGE tissue and not tissue from the lateral ganglionic eminence (LGE), striatal differentiating fields adjacent to the MGE, which contain postmitotic cells, were included in the discs. Since MGE is a transient neuroepithelial structure containing exclusively proliferating cells (Bhide, 1996), we have designated the explants as basal forebrain explants to indicate that postmitotic cells adjacent to the MGE were included in the explants. However, the explants did not contain the LGE or the tissue adjacent to the LGE.
The tissue discs were cultured in Matrigel (BD Biosciences) and neurobasal medium containing 2% B-27 supplement, penicillin, streptomycin, and glutamine. Recombinant human BDNF (Millipore Bioscience Research Reagents) was added to the culture medium (final concentration, 20 or 50 ng/ml) in a subset of explants from saline- or cocaine-exposed embryos. The next morning (∼16 h after addition of BDNF), the medium was replaced with fresh medium containing BDNF. Following a total duration of ∼24 h in culture, the explants were fixed with 4% paraformaldehyde for 2 h, washed with PBS, labeled with SYTO 60 (Invitrogen; diluted 1:1000 in PBS), and examined under phase contrast illumination to count migrating cells. The SYTO 60 labeling was used as a tool to help focus on a cell that was otherwise difficult to easily recognize under the phase-contrast illumination. In an initial screening, explants from saline- and cocaine-exposed groups that did not display cell migration or that displayed non-uniform migration of cells around the entire circumference of the explant were discarded. For each explant selected for analysis, an ocular grid was superimposed on the microscopic image of the explant and the field of migrating cells to isolate a 200 × 400 μm2 sector in the field of migration. The grid was divided into 20 bins. The grid was placed such that bin 1 was closest to the edge of the explant and bin 20 was the farthest from the edge. Each bin was 20 × 200 μm2 in size. For each explant, cells in two such grids were counted. The position of the first grid was determined at random, whereas the second grid was always positioned 180° away from the first. We used four to six explants for each treatment group. We used four litters each from saline and cocaine groups.
Analysis of BrdU labeling in the P60 PFC and MPFC.
To examine the distribution of a cohort of neurons generated on E15 in the P60 MPFC, a single injection of BrdU (50 mg/kg, i.p.) was administered to timed-pregnant mice carrying E15 embryos. For these experiments, we used wild-type (not GAD67-GFP knock-in) mice. On P60, male mice were anesthetized and perfused via the heart with 4% paraformaldehyde in 0.1 m phosphate buffer. The brains were dissected and stored in the same fixative solution overnight at 4°C. The fixed brains were cryoprotected in sucrose, frozen using powdered dry ice, and sectioned in the coronal plane at 35 μm thickness and processed for BrdU immunohistochemistry. The sections were examined in a Zeiss Pascal confocal microscope as described previously for the embryonic brain sections. Confocal images of the entire radial thickness of the PFC and MPFC were collected from sections with complete and uniform penetration of the fluorescence label. Numerical densities of cells labeled with BrdU were calculated throughout the cellular layers (Layers II to VI) using the bin method of analysis described earlier. We found that the majority of the BrdU-labeled cells were located in the upper layers (∼25% of the radial thickness) in both the PFC and MPFC and in both the prenatal treatment groups.
Statistical analysis.
In each experiment, for each prenatal treatment condition, we used samples collected from not more than two embryos or postnatal mice from a given litter. We used two to six litters of mice from each prenatal treatment condition. Thus, we used data from four to six individuals (n = 4 or 6) per prenatal treatment condition. Differences between prenatal treatment conditions were analyzed for statistical significance by using two-tailed Student's t test. When more than two groups of data were compared, one-way ANOVA was used followed by Tukey–Kramer pairwise comparison test.
Results
GABA neuron migration in the intact embryo
We analyzed the numbers of GFP+ cells (presumptive GABA neurons) that had entered the dorsal forebrain in coronal sections of the brain from E13, E15, and E17 embryos exposed to cocaine or saline daily from E8 onward. In both sets of embryos, numerous GFP+ cells were found in the basal forebrain at each of the three ages (Figs. 1, 2). As early as by E13, a stream of GFP+ cells extended from the basal forebrain and entered the dorsal forebrain in both the experimental groups (Fig. 1). At E13, the GFP+ cells were distributed along a lateral-to-medial gradient within the dorsal forebrain (Fig. 1A,B). A casual inspection of the images revealed fewer GFP+ cells in the dorsal forebrain of the E13 cocaine-exposed embryos compared to the saline-exposed embryos (Fig. 1A,B). Moreover, the front of GFP+ stream in the dorsal cerebral wall in the E13 cocaine-exposed embryos lagged behind that in the saline-exposed embryos (Fig. 1A,B, arrows). The differences were more striking in the IZ than the marginal zone (Fig. 1A,B).
A casual visual inspection of the sections did not reveal difference in the distribution of GFP+ cells in the basal or the dorsal forebrain between cocaine- and saline-exposed embryos at E15 or E17 in the PFC or the MPFC (Fig. 2). Numerous GFP+ cells had reached the MPFC extending throughout the lateral-to-medial expanse of the dorsal cerebral wall in both the experimental groups at E15 and E17 (Fig. 2). Since significant differences existed between saline- and cocaine-exposed E13 embryos, we used quantitative methods to determine whether differences in the GFP+ cell numbers between the cocaine- and saline-exposed embryos persisted at E15 and E17.
We calculated the numerical density (number per square micrometer) of GFP+ cells in the PFC and MPFC. These two cortical areas are adjacent to each other along the lateral-to-medial axis, with the MPFC located more medially than PFC. Since the lateral regions of the dorsal cerebral wall are developmentally in advance of the medial regions (Bayer and Altman, 1987; Miyama et al., 1997; Tarui et al., 2005), by comparing the PFC to MPFC at a given age, indirectly we can gain insights into whether cocaine's effects in a given region were more (or less) evident at one developmental stage than another.
We performed the analysis of GFP+ cell numerical densities separately in the IZ and CP/SP where many of the GFP+ cells were located. Although many GFP+ cells were located in the marginal zone, the GFP labeling was so intense that an accurate analysis of cell numbers in this zone became difficult even in 2.5-μm-thick digital sections (Fig. 2). Very few GFP+ cells were found in the VZ or SVZ (Fig. 2).
We found a significant decrease in the numerical density of GFP+ cells in the IZ of the MPFC in the cocaine-exposed embryos compared to the saline-exposed embryos at E15 (Table 1, Fig. 2E; t = 4.699, df = 13, p < 0.001). The IZ of the PFC did not show significant differences in this measure at E15 (Table 1, Fig. 2E; t = 0.698, df = 11, p > 0.05). At E17, when GFP+ cell numbers had increased further (Fig. 2C,D) presumably due to continuing migration along the lateral-to-medial axis, neither the MPFC nor PFC showed significant differences in the numerical density of GFP+ cells in the IZ (Table 1; Fig. 2F). The numerical densities of GFP+ cells in the CP/SP did not show significant differences between the saline- and cocaine-exposed groups at E15 or E17 and in PFC or MPFC (Table 1).
Table 1.
Numerical densities (mean ± SEM) of GFP+ cells in the IZ and SP/CP of E15 and E17 PFC and MPFC of saline- and cocaine-exposed embryos
| Age, cortical region | Zone | Saline | Cocaine |
|---|---|---|---|
| E15, PFC | IZ | 0.0041 ± 0.0002 | 0.0039 ± 0.0002 |
| SP/CP | 0.0025 ± 0.0004 | 0.0024 ± 0.0000 | |
| E15, MPFC | IZ | 0.0042 ± 0.0001 | 0.0030 ± 0.0001* |
| SP/CP | 0.0027 ± 0.0004 | 0.0024 ± 0.0001 | |
| E17, PFC | IZ | 0.0013 ± 0.0001 | 0.0013 ± 0.0001 |
| SP/CP | 0.0023 ± 0.0002 | 0.0026 ± 0.0001 | |
| E17, MPFC | IZ | 0.0020 ± 0.0001 | 0.0020 ± 0.0001 |
| SP/CP | 0.0014 ± 0.0001 | 0.0015 ± 0.0000 |
*p < 0.05.
We examined whether the lateral-to-medial gradient in the distribution of GFP+ cells observed at E13 (Fig. 1) had flattened by E17 in the saline- and cocaine-exposed embryos. We compared the differences in the numerical densities of GFP+ cells in the IZ between the PFC and MPFC and between E15 and E17 by using one-way ANOVA. We found significant differences between the prenatal treatment groups in this measurement (F = 5.188; p < 0.05). Pairwise comparisons revealed that in the saline-treated E17 embryos, the numerical density of GFP+ cells in the PFC was not significantly different from that in the MPFC. In other words, the lateral-to-medial descending gradient in GFP+ cell distribution that was apparent in the IZ at E13 was no longer evident at E17 in the saline-exposed embryo. However, the numerical density of GFP+ cells in the PFC was significantly greater than that in MPFC in the E17 cocaine-exposed embryo (p < 0.05), suggesting that the cocaine exposure had prevented (or at least delayed as of E17) the flattening of the lateral-to-medial gradient in the distribution of GABA neurons.
We point out two technical considerations that might be relevant here. First, we did not find significant changes in GFP+ cells in the CP/SP of the PFC or MPFC at E15 between the cocaine- and saline-exposed embryos. This finding contrasts our earlier data (Crandall et al., 2007), which showed significant decreases in GABA+ cells in the CP/SP of the MPFC. One reason for the discrepancy may be different sensitivities of the methods used to identify GABA cells: the GFP fluorescence in the present study may be more sensitive than the GABA immunohistochemistry used in the earlier study.
The second consideration is that reliance on GFP fluorescence could introduce technical artifacts because the cocaine exposure could potentially downregulate GFP expression without directly altering GABA neuron numbers or distribution. These concerns can be ruled out because of the following observations. The cocaine-induced decrease in tangential migration of GABA neurons reported here is in agreement with our earlier data using wild-type mice, in which we used DiI labeling and GABA immunohistochemistry to track migrating cells and cortical GABA neurons (Crandall et al., 2004). Our in vitro explant data (see Fig. 6) also are from GFP-negative mice and show decreased cell migration from the basal forebrain of cocaine-exposed embryos.
Figure 6.
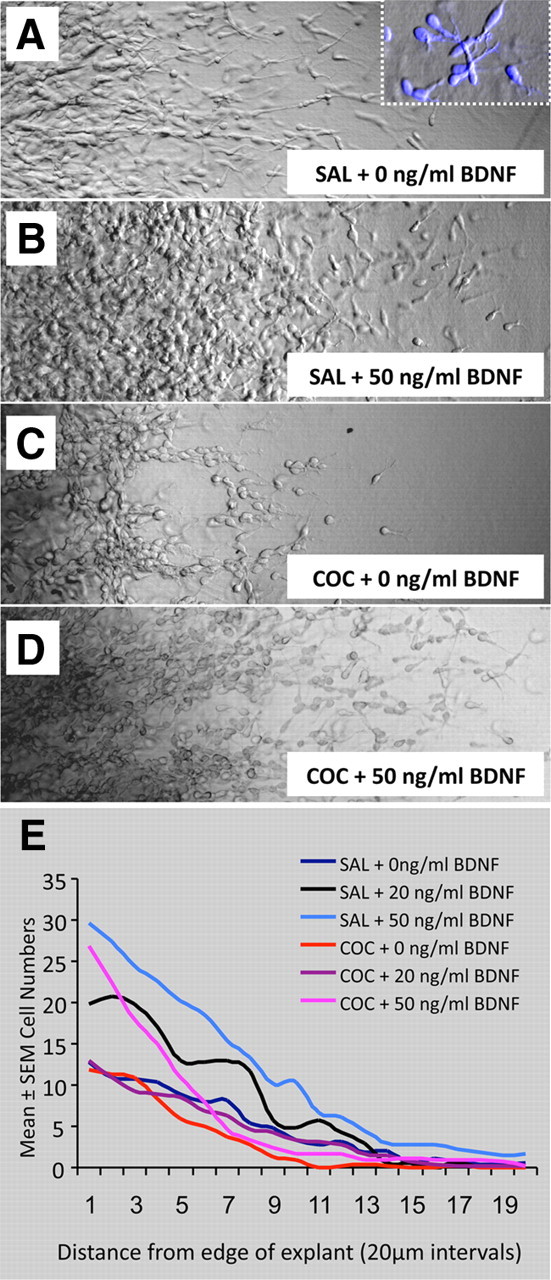
Cell migration in explants of the basal forebrain obtained from E13 saline (SAL)- or cocaine (COC)-exposed embryos with or without addition of exogenous BDNF and cultured for ∼24 h in Matrigel. A–D, Cells are seen migrating away from the edge of the explant (not shown, to the left of each frame). Inset in A shows SYTO 60-labeled cells that have morphological features similar to those of migrating neurons (elongated shape and a prominent leading process; compare with images of GFP+ cells in Figs. 1 and 2). Migration is robust in explants from saline-exposed embryos (A, B) compared to the cocaine-exposed embryos. In each type of explant, addition of 50 ng/ml BDNF enhances cell migration. E, The number of migrating cells was plotted as a function of distance from the explant edge to analyze the effects of prenatal drug exposure and exogenous BDNF on the migration.
Nkx2-1 protein expression
Previous reports have suggested that the level of expression of the homeobox transcription factor Nkx2-1 could regulate migration of neurons from the basal to the dorsal forebrain in such a way that neurons with higher Nkx2-1 expression were more likely to remain in the basal forebrain, whereas neurons that downregulated Nkx2-1 were more likely to migrate to the dorsal forebrain (Nobrega-Pereira et al., 2008). We found that Nkx2-1 immunohistochemical labeling intensity was higher in the basal forebrain of the cocaine-exposed E13 and E15 mice compared to their saline-exposed counterparts (Fig. 2G,J). The increase was especially striking in the regions containing postmitotic neurons upon exit from the neuroepithelium of the MGE.
Effects on neurogenesis
The numbers of GFP+ neurons in the dorsal cerebral wall were not significantly different between the cocaine- and saline-exposed embryos by E17, despite the initial delay in the arrival of these cells from the basal to the dorsal telencephalon. Therefore, we did not expect the cocaine exposure to alter neurogenesis in the basal telencephalon, where the GABA neurons are generated. In fact, our previous studies (Crandall et al., 2007) showed that the prenatal cocaine exposure did not produce significant changes in BrdU incorporation in the E15 mouse basal forebrain.
We examined whether the prenatal cocaine exposure influenced neurogenesis in the dorsal telencephalon. We analyzed the distribution of cells expressing Tbr2, a transcription factor that selectively marks intermediate progenitor cells (precursors of cortical projection neurons) in the dorsal cerebral wall (Englund et al., 2005) (Fig. 3A–C). We calculated the numerical density of Tbr2+ cells in the PFC and MPFC in coronal sections of the E15 brains (Fig. 3B,C). We found significant decreases in the numerical density of Tbr2+ cells in the cocaine-exposed embryo compared to the saline-exposed embryo in the MPFC (Fig. 3D; mean ± SEM cells/μm2, saline, 0.0070 ± 0.0007; cocaine, 0.0050 ± 0.0005; t = 2.383; df = 8; p < 0.05). The PFC did not show significant differences between the two groups of embryos (Fig. 3D; mean ± SEM values, saline, 0.0071 ± 0.0007; cocaine, 0.0065 ± 0.0008; t = 0.5027; df = 8; p > 0.05). Analysis of GFP and Tbr2 double labeling confirmed that the GFP+ cells were not Tbr2+ in the saline- or cocaine-exposed embryos (Fig. 3A,B). Therefore, the decrease in the numerical density of the GFP+ cells in the cocaine-exposed embryos could not have contributed to the decrease in the numerical density of Tbr2+ cells in this group of embryos.
Figure 3.
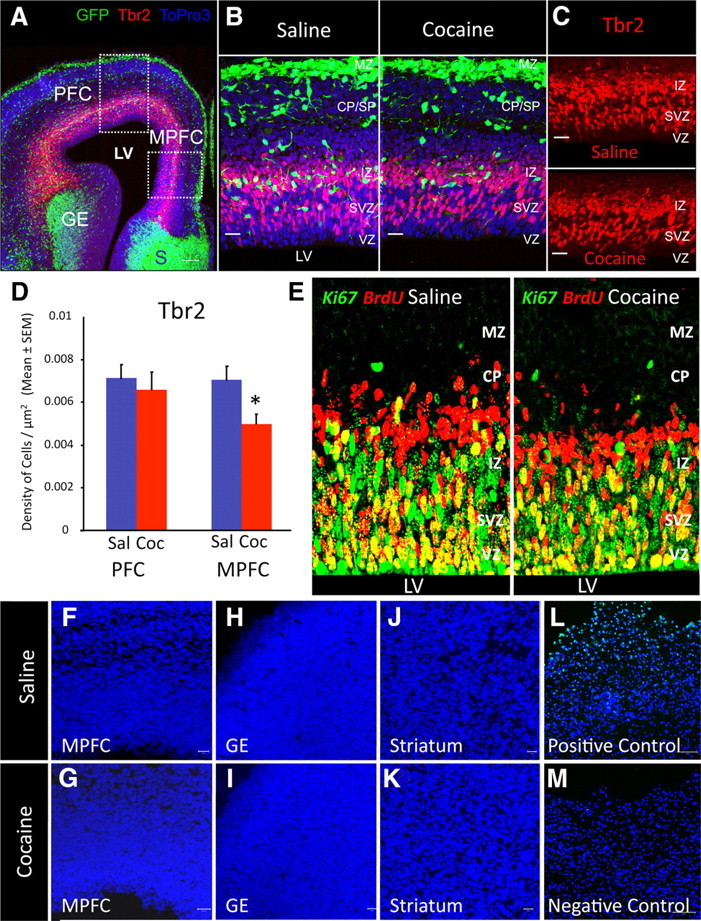
Analysis of cell proliferation, cell output, and cell death in saline- and cocaine-exposed E15 mice. A, Confocal image of a coronal section through the forebrain of a saline-exposed GAD67-GFP embryo showing GFP+ cells in the ganglionic eminence (GE), dorsal forebrain, and septum (S). Within the dorsal forebrain, boxed areas outline the presumptive PFC and MPFC. Tbr2 immunohistochemistry (red) reveals intermediate precursor cells in the dorsal forebrain. ToPro3 staining (blue) reveals nuclei of cells. B, Higher-power confocal images of the MPFC show GFP+ cells in the MZ, CP/SP, and IZ. Virtually no GFP+ cell is present in the SVZ or the VZ. Counting grids were superimposed on the confocal images to calculate numerical density of GFP+ cells within the CP/SP and IZ. A comparison between images of MPFC from saline- and cocaine-exposed embryos shows dramatic reduction in GFP+ cells in the latter, especially in the IZ. None of the GFP+ cells is Tbr2+ in either experimental group. C, Confocal images of the IZ, SVZ, and VZ regions to show Tbr2 immunohistochemistry in the MPFC of saline- and cocaine-exposed embryos. Tbr2+ cells are localized predominantly to the SVZ and IZ. The MPFC of the cocaine-exposed embryo shows decreased Tbr2 labeling compared to the saline-exposed control embryo. D, Comparison of the numerical densities of Tbr2+ cells in the E15 PFC and MPFC shows significant reductions in this parameter in the MPFC of cocaine-exposed embryos. The PFC did not show significant differences between the two experimental groups. E, BrdU–Ki67 double-labeling method was used to quantify cell output from the E15 dorsal cerebral wall in saline- and cocaine-exposed embryos. Proliferating cells, still in cell cycle, are labeled with Ki67 alone (green) or double labeled with Ki67 and BrdU (yellow/orange), whereas postmitotic cells representing the cell output are labeled with BrdU alone (red). The latter are distributed in the IZ and CP in the saline-exposed embryo and predominantly in the IZ in the cocaine-exposed embryo, suggesting a slower rate of migration from the proliferative zones (VZ/SVZ). F–M, Confocal images of coronal sections through E15 saline- and cocaine-exposed embryos (F–K) as well as positive and negative control sections (from an adult mouse brain subjected to controlled cortical impact) (Whalen et al., 2008) processed for TUNEL histochemistry. The MPFC, GE, or striatal differentiating field (STR) did not show TUNEL+ profiles in either the saline- or the cocaine-exposed embryos. The positive control contained numerous TUNEL+ profiles, whereas negative control did not. The sections from the different groups were processed simultaneously for TUNEL histochemistry. ToPro3 (blue) was used to label nuclei. LV, Lateral ventricle. Error bars indicate SEM.
In additional studies, we used the Ki67–BrdU double-labeling method to count cells that became postmitotic over a 24 h period (cell output) in E13 and E15 PFC and MPFC (Fig. 3E). We did not find significant differences in cell output between the saline- and cocaine-exposed embryos at either age or either location (Table 2). However, when we analyzed the distribution of the postmitotic cells (BrdU+Ki67− cells) within the cerebral wall by plotting their position at 10 μm intervals from the ventricular surface, many such cells appeared to be located in the proliferative zones (VZ/SVZ) compared to the postmitotic zones (IZ/CP) in the cocaine-exposed embryos compared to their saline-exposed counterparts, both in the PFC as well as MPFC at E13 and in the MPFC at E15 (Fig. 4). Statistical analysis showed that significantly greater percentage of the BrdU+Ki67− cells were present in the VZ/SVZ region of the cerebral wall in the cocaine-exposed embryos in the PFC and MPFC at E13 (Table 3). Similarly, significantly smaller percentage of the BrdU+Ki67− cells were present in the IZ/CP region of the cerebral wall in the cocaine-exposed embryos in the PFC and MPFC at E13 (Table 3). The differences between the cocaine- and saline-exposed embryos in this measure were not statistically significant at E15 either in the PFC or MPFC (Table 3). These data suggest that migration of the postmitotic cells away from the proliferative zones (VZ and SVZ) is delayed as a result of the cocaine exposure.
Table 2.
Number of BrdU+Ki67− cells (mean ± SEM) representing cell output from the proliferative zones of the cerebral wall of saline- or cocaine-exposed embryos
| Age, region | Saline | Cocaine |
|---|---|---|
| E13, PFC | 45.50 ± 4.74 | 45.38 ± 5.40 |
| E13, MPFC | 57.20 ± 1.66 | 53.13 ± 5.29 |
| E15, PFC | 60.64 ± 4.62 | 54.58 ± 7.64 |
| E15, MPFC | 90.35 ± 7.46 | 75.33 ± 7.58 |
Figure 4.
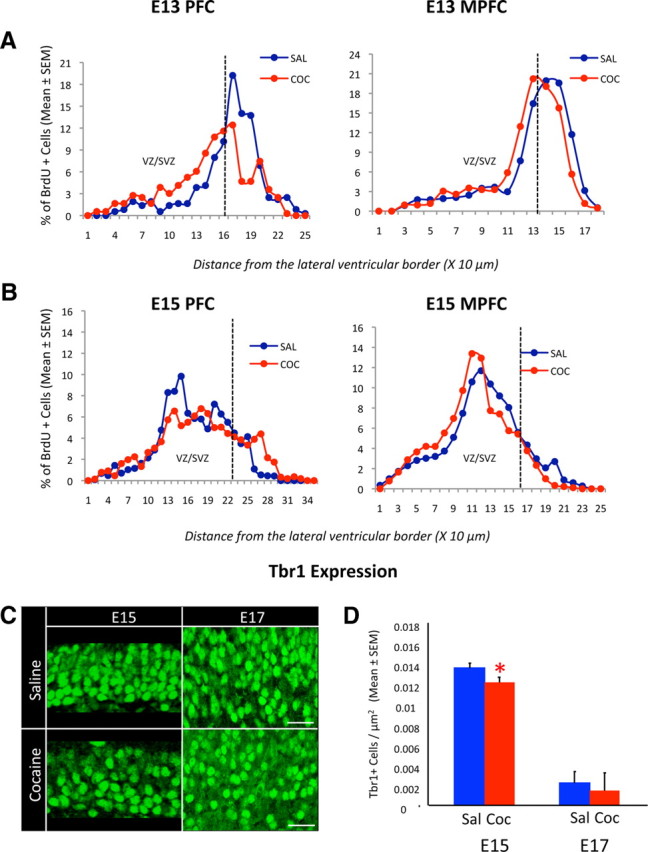
A–D, Distribution of postmitotic cells within in the PFC and MPFC of the dorsal cerebral wall of saline (Sal)- or cocaine (Coc)-exposed E13 and E15 mice (A, B) and the distribution of Tbr1+ cells in the MPFC of E15 and E17 mice (C, D). Postmitotic cells representing the cell output from proliferative zones were identified using a BrdU–Ki67 double-labeling paradigm. The relative proportion of the postmitotic cells (as a percentage of the total number of cells within a defined sector of the cerebral wall) was plotted against distance from the lateral ventricle at 10 μm intervals. The broken line indicates the approximate boundary between the proliferative VZ and SVZ and the postmitotic zones. In the cocaine-exposed embryo, the majority of the postmitotic cells were found within the VZ/SVZ compared to the saline-exposed embryos in the PFC and MPFC at E13 and in the MPFC at E15. C, Confocal images of coronal sections through the MPFC showing Tbr1-labeled cells. D, Comparison of the numerical density of Tbr1+ cells in the MPFC between saline- and cocaine-exposed embryos shows significant decreases in the cocaine-exposed embryos at E15. No significant differences are seen at E17. The numerical density of Tbr1+ cells decreases from E15 to E17, presumably due to expansion of the neuropil during this interval accompanied by the downregulation of Tbr1 expression in some cells. Error bars indicate SEM. Scale bars, 50 μm. *p < 0.05.
Table 3.
Relative proportion of BrdU+Ki67− cells (mean + SEM) that were distributed within the proliferative (VZ/SVZ) and postmitotic (IZ/CP) regions of the cerebral wall of saline- or cocaine-exposed embryos
| Age | Cortical region | Cytoarchitectonic zone | Saline | Cocaine |
|---|---|---|---|---|
| E13 | PFC | VZ/SVZ | 37.73 ± 6.79 | 67.29 ± 9.46* |
| IZ/CP | 62.27 ± 6.79 | 32.71 ± 9.46* | ||
| MPFC | VZ/SVZ | 65.10 ± 2.23 | 77.70 ± 4.71* | |
| IZ/CP | 34.90 ± 2.23 | 22.30 ± 4.71* | ||
| E15 | PFC | VZ/SVZ | 79.45 ± 2.00 | 69.70 ± 6.55 |
| IZ/CP | 20.55 ± 2.00 | 30.30 ± 6.55 | ||
| MPFC | VZ/SVZ | 87.48 ± 6.19 | 91.70 ± 3.05 | |
| IZ/CP | 12.52 ± 6.19 | 8.3 ± 3.05 |
The proportions are expressed as percentages of the total numbers of BrdU+Ki67− cells within the cerebral wall. The boundaries between the different zones are approximate and were identified based on histological criteria.
*p < 0.05.
Incidence of cell death
Because previous reports have suggested that cocaine can upregulate expression of genes associated with cell death (Nassogne et al., 1995, 1997; He et al., 1999; Novikova et al., 2005; Lee et al., 2009), we examined whether the incidence of apoptosis was altered by the cocaine exposure by performing TUNEL labeling in cryostat sections of the brain from the saline- or cocaine-exposed E15 embryos. In agreement with our previous data (McCarthy et al., 2007), TUNEL+ profiles were not observed in the MPFC, ganglionic eminence, or striatal differentiating fields in the saline-exposed embryos (Fig. 3F–J). TUNEL+ profiles were also absent in these brain regions in the E15 cocaine-exposed mice (Fig. 3G–K).
Tbr1 expression in the dorsal telencephalon
The delayed migration of postmitotic cells away from the VZ/SVZ in the Ki67–BrdU double-labeling experiments (Figs. 3E, 4) suggested that the maturation of the cells might also be delayed. To examine this possibility, we analyzed expression of the transcription factor Tbr1, which marks newly generated projection neurons of the cerebral cortex upon exit from the cell cycle and upon downregulation of Tbr2 expression (Englund et al., 2005). When we compared the numerical density of Tbr1+ cells within the E15 MPFC, we found significant decreases in this measure in the cocaine-exposed embryos (Fig. 4C,D; mean ± SEM values in MPFC, saline, 0.0135 ± 0.0003; cocaine, 0.0121 ± 0.0003; t = 2.796; df = 11; p < 0.05). If the Tbr1 expression was delayed and not permanently downregulated by the cocaine exposure, then the deficits in the Tbr1 expression seen at E15 in the MPFC would be expected to disappear at later stages of development. To address this question, we examined Tbr1 expression in the MPFC at E17 and did not find significant differences in this measure between the cocaine- and saline-exposed embryos (Fig. 4C,D; mean ± SEM values in MPFC, saline, 0.0022 ± 0.0001; cocaine, 0.0014 ± 0.0004; t = 1.343; df = 5; p > 0.05). Collectively, these data suggest that expression of Tbr1 in the postmitotic cells is delayed and not permanently downregulated by the cocaine exposure.
BDNF protein expression
We analyzed BDNF protein expression by Western blot in samples of the basal and dorsal forebrain in the saline- and cocaine-exposed E13, E15, and E17 embryos (Fig. 5A,B). GAPDH expression was used to control for variation in sample loading and to facilitate quantitative comparison of BDNF expression among the different groups. BDNF expression was significantly lower in the cocaine-exposed embryos compared to the saline-exposed embryos in the basal and dorsal forebrain at E15 (Fig. 5C,D; mean ± SEM density values; basal forebrain, saline, 12.0 ± 2.12; cocaine, 3.0 ± 1.29; t = 3.62; df = 6; p = 0.01; dorsal forebrain, saline, 22.5 ± 1.32; cocaine, 8.75 ± 4.03; t = 3.24; df = 6; p = 0.02), but not at E13 or E17 (Fig. 5C,D). We used ELISA to further verify the decrease in BDNF expression in the E15 basal forebrain. We focused on the basal forebrain because a principal goal of the study is to determine whether the cocaine exposure alters basal forebrain BDNF content and neuronal migration. Thus, verification of whether BDNF content is lower in the cocaine-exposed basal forebrain at E15 seemed critical to us. ELISA showed significant decreases in BDNF content of the cocaine-exposed E15 basal forebrain compared to the saline control (Fig. 5E; mean ± SEM, saline, 25.9 ± 2.1 pg/ml; cocaine, 7.5 ± 1.3 pg/ml; t = 7.3; df = 4; p = 0.002).
Figure 5.

A, B, Western blots showing BDNF protein expression in the basal (A) and dorsal (B) forebrain of saline (SAL)- or cocaine (COC)-exposed embryos. Each brain region from E13, E15, and E17 mice was analyzed. GAPDH expression was used as a loading control. C, D, Quantitative analysis of BDNF expression (normalized to GAPDH expression) revealed significant reduction (asterisk, p < 0.05) in expression at E15 in both the basal (C) and dorsal (D) forebrain. There was no significant change in expression at E13 or E17 in either brain region. ELISA showed significant (asterisk) reductions in the BDNF content of the basal forebrain of the E15 cocaine-exposed embryo compared to the saline-exposed control (E). Error bars indicate SEM.
Cell migration from explants of the basal forebrain
We examined cell migration from explants of the ganglionic eminence/striatum obtained from E13 saline- or cocaine-exposed embryos. In a subset of each type of explant, BDNF (20 or 50 ng/ml) was added to the culture medium. Visual examination of the explants that were not exposed to BDNF revealed that fewer cells had migrated away from the cocaine-exposed explant compared to the saline-exposed explant (Fig. 6, compare A, C). With addition of 50 ng/ml BDNF, cell migration in both types of explants was increased (Fig. 6B,D) compared to the migration in the explants that did not receive BDNF (Fig. 6A,C). ANOVA revealed that the total numbers of migrating cells were significantly different among the experimental groups (ANOVA; F = 3.81; p = 0.003; n = 5 per group). There were fewer cells in the cocaine-exposed groups compared to the saline-exposed groups and a clear trend toward increases in the number of migrating cells as a result of addition of BDNF in both the experimental groups (mean ± SEM values, saline, 96.9 ± 18.3; saline + 20 ng/ml BDNF, 124.3 ± 91.3; saline + 50 ng/ml BDNF, 225.5 ± 64.5; cocaine, 63.1 ± 23.3; cocaine + 20 ng/ml BDNF, 85.5 ± 31.9; cocaine + 50 ng/ml BDNF, 122.8 ± 29.5). When we compared the distribution of migrating cells as a function of distance from the edge of the explant, we found significant differences between the different experimental groups (t test, p < 0.05). The distribution of cells between the saline and cocaine groups (without exogenous BDNF) differed from each other, and the distribution of cells upon addition of BDNF was significantly different in each prenatal treatment group compared to without the exogenous BDNF. The differences were likely due to differences in the numbers of migrating cells at each 20 μm interval (saline > cocaine; saline + 50 ng/ml BDNF > saline + 20 ng/ml BDNF > saline without BDNF; cocaine + 50 ng/ml BDNF > cocaine + 20 ng/ml BDNF > cocaine without BDNF).
Although BDNF levels in the intact basal forebrain were significantly reduced at E15 and not at E13 by the cocaine exposure (Fig. 5C), we used E13 basal forebrain explants in the cell migration assays. At E15, cells migrating from the basal forebrain are a mixture of multiple classes of cells (Marin et al., 2000; Anderson et al., 2001; Marin and Rubenstein, 2001; Wichterle et al., 2001). They include MGE-derived cells migrating to the dorsal forebrain, LGE-derived cells destined for the olfactory bulb, and MGE- and LGE-derived cells that will remain in the striatum. In our previous study we had found that prenatal cocaine exposure did not affect migration of GABA neurons to the olfactory bulb. In contrast, explants of E13 basal forebrain containing the MGE and the adjacent striatal field would provide a source of MGE-derived cells that would migrate to the dorsal forebrain via the tangential neuronal migratory pathway. Moreover, cocaine-induced decreases in GFP+ cell numbers in the dorsal forebrain were more striking at E13 than at E15 (Figs. 1, 2). For these reasons, we chose to use E13 basal forebrain explants in the migration assays.
Laminar position of E15-generated neurons in the P60 PFC and MPFC
Since the migration of postmitotic neurons was delayed in the embryonic cerebral wall (Fig. 5), and since Tbr1 expression also was delayed in the MPFC at E15 (Fig. 6), we examined whether migration of E15- generated neurons to their final layer destinations in the PFC and MPFC could be affected by the prenatal cocaine exposure. We administered a single injection of BrdU on E15 to mice that were exposed to saline or cocaine from E8 to P0 and examined the distribution of the BrdU-labeled cells at P60 in the PFC and MPFC. The BrdU-labeled cells were distributed predominantly in layers II and III in the P60 PFC and MPFC in both the saline- and cocaine-exposed mice (Fig. 7). The numerical density (number per μm2) of BrdU-labeled cells within Layers II–VI (entire gray matter) in the PFC or MPFC were not significantly different between the cocaine- and saline-exposed P60 mice (mean ± SEM number per square micrometer in PFC for saline, 0.00033 ± 0.00001; cocaine, 0.00037 ± 0.00005; t = 0.6616; df = 7; p > 0.05; mean ± SEM number per square micrometer in MPFC for saline, 0.00029 ± 0.00002; cocaine, 0.00022 ± 0.00003; t = 2.332; df = 5; p > 0.05), supporting the observation that cell output was not altered at E15 in either cortical region by the cocaine exposure (Fig. 4; Table 2). However, the distribution of the BrdU-labeled cells was significantly different in the upper third of Layers II–III (∼150 μm below the pial surface and corresponding approximately to Layer II) of the MPFC between the cocaine- and saline-exposed P60 mice (mean ± SEM values, saline, 0.00056 ± 0.0002; cocaine, 0.00038 ± 0.0002; t = 3.461; df = 3.0; p < 0.05), with the cocaine-exposed mice showing fewer cells in each of the three 50-μm-wide bins (Fig. 7E,F). The PFC did not show significant differences between the two experimental groups in this measurement (Fig. 7C,D; mean ± SEM values, saline, 0.00052 ± 0.00003; cocaine, 0.00064 ± 0.00005; t = 2.059; df = 3; p > 0.05). These data show that although the majority of the E15-generated cells had reached the superficial layers of the PFC and MPFC in both the saline- and cocaine-exposed mice, significantly fewer cells had migrated to upper third of Layers II–III (presumptive Layer II) in the cocaine-exposed mice. Furthermore, cocaine's effects were region specific in that they were seen in the MPFC and not the PFC.
Figure 7.
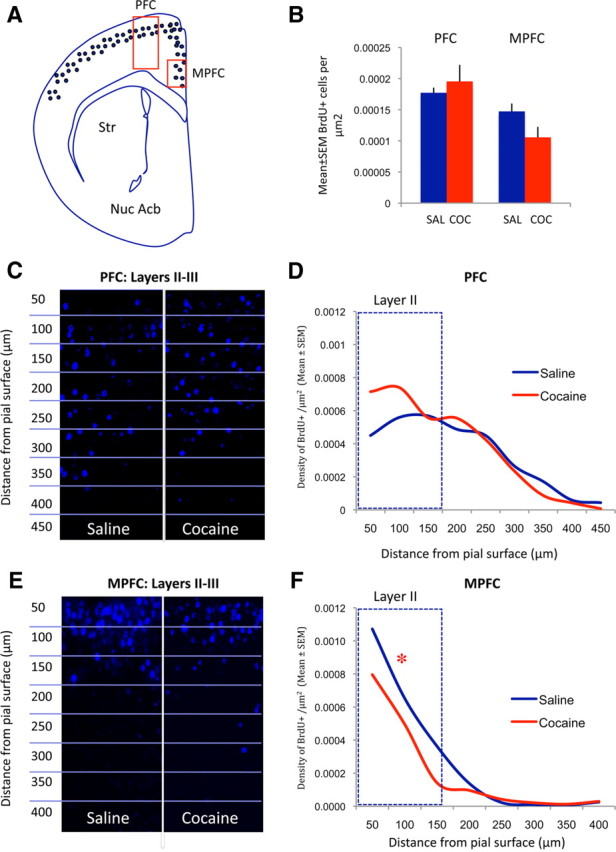
Laminar destination of cells generated on E15 in the P60 PFC and MPFC in prenatally saline- or cocaine-exposed mice. A, Diagrammatic representation of a coronal section through the left hemisphere of a P60 mouse to illustrate the location of the PFC and MPFC (red boxes) and the distribution of cells (blue dots) labeled with a single injection of BrdU administered on E15. B, Numerical densities of the E15 BrdU-labeled cells within the PFC and MPFC (Layers II–VI) are not significantly different between saline- and cocaine-exposed P60 mice. C, E, Confocal images of BrdU-labeled cells (blue) in Layers II–III of the PFC (C) and MPFC (E) of prenatally saline- or cocaine-exposed P60 mice. D, F, Numerical densities of BrdU-labeled cells in the PFC (D) and MPFC (F) of P60 mice are plotted against distance from the pial surface. The horizontal lines in C and E indicate the intervals on the horizontal axes in D and F, respectively. The distribution of the BrdU-labeled cells in the upper 150 μm of Layers II–III of the PFC were not significantly different between prenatally saline-exposed and cocaine-exposed mice. However, in the MPFC, the distribution was significantly different (F, asterisk) suggesting that fewer BrdU-labeled cells had arrived in the superficial 150 μm sector in the cocaine-exposed group.
Discussion
We show that prenatal cocaine exposure can decrease tangential and radial migration of neurons in the forebrain. The cocaine exposure also decreases forebrain BDNF protein expression. The decreases in tangential migration and BDNF content occur at E15, are transient, and are temporally coincident. Addition of exogenous BDNF enhances migration of neurons from basal forebrain explants obtained from saline- or cocaine-exposed E13 embryos. In addition, cocaine's effects on the expression of Tbr2 and Tbr1, transcription factors associated with proliferating and newly postmitotic cells in the dorsal telencephalon, are also transient. The transient nature of cocaine's effects is noteworthy because the effects disappeared even in the face of ongoing cocaine exposure. Although the decrease in tangential migration was transient, it produced lasting consequences for the distribution of GFP+ cells in the dorsal telencephalon at E17. Cocaine's effects on radial neuronal migration also produced lasting consequences for the laminar positioning of neurons in the mature cerebral cortex. Finally, our data show that exogenous BDNF can restore at least partially the cocaine-induced decrease in cell migration in basal forebrain explants. Thus, we identify BDNF as a mediator of cocaine's effects on neuronal migration in the embryonic brain.
Our data show that cocaine exposure throughout the period of prenatal brain development (E8 to birth in mice) can produce significant but transient effects on developmental processes. Snapshots of events could yield partial and conflicting information that can only be resolved by analysis spanning the entire duration of a given developmental event. Our data also highlight the relevance of cocaine's effects on BDNF signaling for developmental processes. Until now, cocaine's effects on BDNF are known for synapse remodeling or modulation of synaptic efficacy and plasticity in the mature brain (Bolanos and Nestler, 2004; Thomas et al., 2008; Russo et al., 2009; Lobo et al. 2010). Our findings indicate that cocaine-BDNF interactions are relevant also in early development.
In the mature drug-naive animal, cocaine exposure increases BDNF in the forebrain and midbrain (Le Foll et al., 2002, 2005). We show that cocaine decreases BDNF expression at E15 (Fig. 5). These different outcomes may reflect differences in the expression and activity of the dopamine receptors under the two circumstances. Cocaine exposure beginning at E8 decreases dopamine D1-receptor expression and activity in the basal forebrain at E15 (Kubrusly and Bhide, 2010). Activation of the D1 receptor by endogenous or exogenous ligand is sufficient to increase BDNF expression in basal forebrain neurons (Kuppers and Beyer, 2001; Iwakura et al., 2008; Williams and Undieh, 2009). Moreover, in drug-naive animals, attenuation of the D1-receptor activity is sufficient to attenuate cocaine-induced increases in BDNF (Williams and Undieh, 2010). Therefore, the cocaine-induced decrease in BDNF levels in the E15 basal forebrain seen here may be due to reduced D1-receptor signaling induced by the cocaine exposure (Kubrusly and Bhide, 2010). We do not have an explanation for the lack of changes in BDNF at E13 or E17 except for speculation that cocaine-induced attenuation of the D1-receptor signaling might not have occurred yet at E13, and that by E17, compensatory mechanisms might have been triggered to offset the reduced D1-receptor activity and BDNF levels.
Our explant culture experiments offer direct evidence that BDNF can augment migration of basal forebrain neurons in a dose-dependent manner, in agreement with previous in vivo studies (Polleux et al., 2002). The BDNF rescued cocaine-induced decreases in migration only partially. Since BDNF modulates cell migration via trkB signaling (Polleux et al., 2002), it is possible that the cocaine exposure decreases trkB expression or activity in the basal forebrain.
The incomplete rescue of the cell migration phenotype also could suggest involvement of other factors. Indeed, a combination of at least three factors may contribute to cocaine's effects on basal forebrain cell migration. First, cocaine upregulated Nkx 2–1 expression (Fig. 2G–J) in the basal forebrain. Upregulation of Nkx2-1 in postmitotic cells is sufficient to decrease the cells' ability to migrate from the basal to the dorsal forebrain (Nobrega-Pereira et al., 2008). Second, prenatal cocaine exposure upregulates dopamine D2-receptor activity in the basal forebrain (Kubrusly and Bhide, 2010), and activation of the D2-receptor is sufficient to decrease tangential migration of neurons (Crandall et al., 2007). Finally, reduced BDNF expression in the basal forebrain could decrease tangential neuronal migration (Polleux et al., 2002). The net effects of cocaine may also represent a combination or interaction among the three factors.
Although cocaine's effects on tangential neuronal migration were transient, the lateral-to-medial descending gradient in the distribution of the GABA neurons in the IZ of the dorsal cerebral wall that is evident at E13 and that flattens by embryonic day 17 in the saline-exposed mice persisted in the cocaine-exposed embryos at E17. Thus, subtle deficits in GABA neuron distribution may persist in the cocaine-exposed embryos. Recent evidence from a rat model of prenatal cocaine exposure suggests that GABA circuits in the MPFC can be permanently altered by prenatal cocaine exposure (Lu et al., 2009). These persisting effects may underlie the cognitive deficits reported in children born to mothers that had abused cocaine during pregnancy (Chasnoff et al., 1989a,b; Chiriboga et al., 1993, 2009; Delaney-Black et al., 1996; Kosofsky and Wilkins, 1998; Eyler et al., 2009).
The prenatal cocaine exposure also affected radial migration of neurons within the dorsal cerebral wall. An earlier study in a nonhuman primate model also reported cocaine-induced impairment in cortical neuronal migration (Lidow, 1995; Lidow and Song, 2001a). Unlike the earlier studies, we demonstrate that the delay in the migration is evident immediately upon the neurons' exit from the proliferative zones (Figs. 3E, 4). These early effects led to persisting changes in the laminar positioning of cells in the upper parts of Layers II–III (Fig. 7). The effects in the nonhuman primate are much more pronounced and include blurring of the layer boundaries and accumulation of neurons in the white matter beneath layer VI (Lidow, 1995; Lidow and Song, 2001a). The differences between the present and the earlier nonhuman primate data may reflect species differences in vulnerability to prenatal cocaine exposure or duration of the cocaine exposure vis a vis the duration of neurogenesis and neuronal migration epochs. Nonetheless, it is interesting that in both the species, positioning of cortical neurons was affected.
The mechanisms of cocaine's effects on radial neuronal migration are not fully understood. Decreases in dorsal forebrain BDNF content could be a factor. The delayed GABA neuron migration may reduce dorsal forebrain GABA content, which could affect radial migration because GABA modulates neuronal migration (Behar et al., 1996; Bolteus and Bordey, 2004; Kriegstein, 2005). Equally importantly, cocaine alters monoamine neurotransmitter content. These neurotransmitters also can influence neuronal migration (Riccio et al., 2009; Bhide, 2009). The effects of prenatal cocaine exposure on the laminar destination of E15-generated cortical neurons are similar to the effects of prenatal l-DOPA exposure (McCarthy et al., 2007), underscoring the significance of dopamine in the mediation of cocaine's effects.
Cocaine's effects on laminar positioning of cortical neurons were apparent in the P60 MPFC and not the PFC (Fig. 7). Since the MPFC is medial to the PFC, it may mature later and may not be able to fully recover from cocaine's effects. In addition, the MPFC receives more robust dopaminergic inputs than the PFC, and may therefore be more vulnerable to cocaine's effects (Stanwood et al., 2001, 2005; Stanwood and Levitt, 2007).
We did not find significant effects of prenatal cocaine exposure on neurogenesis in the dorsal cerebral wall. Our findings are in contrast to previous reports in vivo (Lidow et al., 2001; Lidow and Song, 2001a,b; Lee et al., 2008, 2010) and in vitro (Zachor et al., 1994, 2000). At first glance, changes in the expression of Tbr2 (Fig. 3) and Tbr1 (Fig. 4) in the cocaine-exposed embryos in the present study could suggest altered neurogenesis. However, comparison of neighboring cortical areas (PFC vs MPFC) and different developmental stages (E13, E15, and E17) suggest that the decrease in Tbr2 and Tbr1 expression is transient. Moreover, direct examination of cell output using BrdU–Ki67 double labeling shows no effect on neurogenesis (Table 2).
The present and previous studies of the effects of prenatal cocaine exposure on neurogenesis differed in terms of the species used (mouse in the present study and monkey or rat in the earlier studies) and the duration of cocaine exposure. However, none of the previous studies measured cell output directly. One of the previous studies (Lidow and Song, 2001b) indicated that cocaine's effects on neurogenesis in the nonhuman primate cortex were different immediately upon cocaine exposure (decrease in S-phase labeling 1.5 h after cocaine) and at later periods (increase in S-phase labeling 10 h after cocaine), pointing out fluctuations in cocaine's effects. Therefore, although changes in transcription factor or cell cycle regulatory molecules may occur following cocaine exposure (Lee et al., 2008, 2010), these changes may be transient and the net effect on neurogenesis may not be significant.
Footnotes
This work was supported by U.S. Public Health Service Grants RO1DA020796, P30NS045776, and R01DA022339. We are grateful to Igor Bagayev for expert assistance with confocal microscopy and to the staff of the Massachusetts General Hospital's Center for Comparative Medicine for expert assistance with mouse colony management and drug administration.
References
- Anderson SA, Marin O, Horn C, Jennings K, Rubenstein JL. Distinct cortical migrations from the medial and lateral ganglionic eminences. Development. 2001;128:353–363. doi: 10.1242/dev.128.3.353. [DOI] [PubMed] [Google Scholar]
- Bayer SA, Altman J. Directions in neurogenetic gradients and patterns of anatomical connections in the telencephalon. ProgNeurobiol. 1987;29:57–106. doi: 10.1016/0301-0082(87)90015-3. [DOI] [PubMed] [Google Scholar]
- Behar TN, Li YX, Tran HT, Ma W, Dunlap V, Scott C, Barker JL. GABA stimulates chemotaxis and chemokinesis of embryonic cortical neurons via calcium-dependent mechanisms. J Neurosci. 1996;16:1808–1818. doi: 10.1523/JNEUROSCI.16-05-01808.1996. [DOI] [PMC free article] [PubMed] [Google Scholar]
- Bhide PG. Cell cycle kinetics in the embryonic mouse corpus striatum. J Comp Neurol. 1996;374:506–522. doi: 10.1002/(SICI)1096-9861(19961028)374:4<506::AID-CNE3>3.0.CO;2-5. [DOI] [PubMed] [Google Scholar]
- Bhide PG. Dopamine, cocaine and the development of cerebral cortical cytoarchitecture: a review of current concepts. Seminars Cell Dev Biol. 2009;20:395–402. doi: 10.1016/j.semcdb.2009.01.006. [DOI] [PubMed] [Google Scholar]
- Bolanos CA, Nestler EJ. Neurotrophic mechanisms in drug addiction. Neuromolecular Med. 2004;5:69–83. doi: 10.1385/NMM:5:1:069. [DOI] [PubMed] [Google Scholar]
- Bolteus AJ, Bordey A. GABA release and uptake regulate neuronal precursor migration in the postnatal subventricular zone. J Neurosci. 2004;24:7623–7631. doi: 10.1523/JNEUROSCI.1999-04.2004. [DOI] [PMC free article] [PubMed] [Google Scholar]
- Chasnoff IJ, Lewis DE, Griffith DR, Willey S. Cocaine and pregnancy: clinical and toxicological implications for the neonate. Clin Chem. 1989a;35:1276–1278. [PubMed] [Google Scholar]
- Chasnoff IJ, Griffith DR, MacGregor S, Dirkes K, Burns KA. Temporal patterns of cocaine use in pregnancy. Perinatal outcome. JAMA. 1989b;261:1741–1744. [PubMed] [Google Scholar]
- Chenn A, Walsh CA. Regulation of cerebral cortical size by control of cell cycle exit in neural precursors. Science. 2002;297:365–369. doi: 10.1126/science.1074192. [DOI] [PubMed] [Google Scholar]
- Chiriboga CA, Bateman DA, Brust JC, Hauser WA. Neurologic findings in neonates with intrauterine cocaine exposure. Pediatr Neurol. 1993;9:115–119. doi: 10.1016/0887-8994(93)90045-e. [DOI] [PubMed] [Google Scholar]
- Chiriboga CA, Starr D, Kuhn L, Wasserman GA. Prenatal cocaine exposure and prolonged focus attention. Poor infant information processing ability or precocious maturation of attentional systems? Dev Neurosci. 2009;31:149–158. doi: 10.1159/000207502. [DOI] [PubMed] [Google Scholar]
- Crandall JE, Hackett HE, Tobet SA, Kosofsky BE, Bhide PG. Cocaine exposure decreases GABA neuron migration from the ganglionic eminence to the cerebral cortex in embryonic mice. Cereb Cortex. 2004;14:665–675. doi: 10.1093/cercor/bhh027. [DOI] [PMC free article] [PubMed] [Google Scholar]
- Crandall JE, McCarthy DM, Araki KY, Sims JR, Ren JQ, Bhide PG. Dopamine receptor activation modulates GABA neuron migration from the basal forebrain to the cerebral cortex. J Neurosci. 2007;27:3813–3822. doi: 10.1523/JNEUROSCI.5124-06.2007. [DOI] [PMC free article] [PubMed] [Google Scholar]
- Delaney-Black V, Covington C, Ostrea E, Jr, Romero A, Baker D, Tagle MT, Nordstrom-Klee B, Silvestre MA, Angelilli ML, Hack C, Long J. Prenatal cocaine and neonatal outcome: evaluation of dose-response relationship. Pediatrics. 1996;98:735–740. [PubMed] [Google Scholar]
- Englund C, Fink A, Lau C, Pham D, Daza RA, Bulfone A, Kowalczyk T, Hevner RF. Pax6, Tbr2, and Tbr1 are expressed sequentially by radial glia, intermediate progenitor cells, and postmitotic neurons in developing neocortex. J Neurosci. 2005;25:247–251. doi: 10.1523/JNEUROSCI.2899-04.2005. [DOI] [PMC free article] [PubMed] [Google Scholar]
- Eyler FD, Warner TD, Behnke M, Hou W, Wobie K, Garvan CW. Executive functioning at ages 5 and 7 years in children with prenatal cocaine exposure. Dev Neurosci. 2009;31:121–136. doi: 10.1159/000207500. [DOI] [PMC free article] [PubMed] [Google Scholar]
- He N, Song Z, Lidow MS. Cocaine induces cell death within the primate fetal cerebral wall. Neuropathol Appl Neurobiol. 1999;25:504–512. doi: 10.1046/j.1365-2990.1999.00211.x. [DOI] [PubMed] [Google Scholar]
- Huang CC, Liang YC, Hsu KS. Prenatal cocaine exposure enhances long-term potentiation induction in rat medial prefrontal cortex. Int J Neuropsychopharmacol. 2011;14:431–443. doi: 10.1017/S1461145710000258. [DOI] [PubMed] [Google Scholar]
- Iwakura Y, Nawa H, Sora I, Chao MV. Dopamine D1 receptor-induced signaling through TrkB receptors in striatal neurons. J Biol Chem. 2008;283:15799–15806. doi: 10.1074/jbc.M801553200. [DOI] [PMC free article] [PubMed] [Google Scholar]
- Kaufman MH. The atlas of mouse development. Ed 2. New York: Academic; 1992. [Google Scholar]
- Kosofsky BE, Wilkins AS. A mouse model of transplacental cocaine exposure. Clinical implications for exposed infants and children. Ann N Y Acad Sci. 1998;846:248–261. [PubMed] [Google Scholar]
- Kosofsky BE, Wilkins AS, Gressens P, Evrard P. Transplacental cocaine exposure: A mouse model demonstrating neuroanatomic and behavioral abnormalities. J Child Neurol. 1994;9:234–241. doi: 10.1177/088307389400900303. [DOI] [PubMed] [Google Scholar]
- Kriegstein AR. Constructing circuits: neurogenesis and migration in the developing neocortex. Epilepsia. 2005;46(Suppl 7):15–21. doi: 10.1111/j.1528-1167.2005.00304.x. [DOI] [PubMed] [Google Scholar]
- Kubrusly RC, Bhide PG. Cocaine exposure modulates dopamine and adenosine signaling in the fetal brain. Neuropharmacology. 2010;58:436–443. doi: 10.1016/j.neuropharm.2009.09.007. [DOI] [PMC free article] [PubMed] [Google Scholar]
- Kuppers E, Beyer C. Dopamine regulates brain-derived neurotrophic factor (BDNF) expression in cultured embryonic mouse striatal cells. Neuroreport. 2001;12:1175–1179. doi: 10.1097/00001756-200105080-00025. [DOI] [PubMed] [Google Scholar]
- Lee CT, Chen J, Hayashi T, Tsai SY, Sanchez JF, Errico SL, Amable R, Su TP, Lowe RH, Huestis MA, Shen J, Becker KG, Geller HM, Freed WJ. A mechanism for the inhibition of neural progenitor cell proliferation by cocaine. PLoS Med. 2008;5:e117. doi: 10.1371/journal.pmed.0050117. [DOI] [PMC free article] [PubMed] [Google Scholar]
- Lee CT, Lehrmann E, Hayashi T, Amable R, Tsai SY, Chen J, Sanchez JF, Shen J, Becker KG, Freed WJ. Gene expression profiling reveals distinct cocaine-responsive genes in human fetal CNS cell types. J Addict Med. 2009;3:218–226. doi: 10.1097/ADM.0b013e318199d863. [DOI] [PMC free article] [PubMed] [Google Scholar]
- Lee CT, Chen J, Worden LT, Freed WJ. Cocaine causes deficits in radial migration and alters the distribution of glutamate and GABA neurons in the developing rat cerebral cortex. Synapse. 2010;65:21–34. doi: 10.1002/syn.20814. [DOI] [PMC free article] [PubMed] [Google Scholar]
- Le Foll B, Frances H, Diaz J, Schwartz JC, Sokoloff P. Role of the dopamine D3 receptor in reactivity to cocaine-associated cues in mice. Eur J Neurosci. 2002;15:2016–2026. doi: 10.1046/j.1460-9568.2002.02049.x. [DOI] [PubMed] [Google Scholar]
- Le Foll B, Diaz J, Sokoloff P. A single cocaine exposure increases BDNF and D3 receptor expression: implications for drug-conditioning. Neuroreport. 2005;16:175–178. doi: 10.1097/00001756-200502080-00022. [DOI] [PubMed] [Google Scholar]
- Lidow MS. Prenatal cocaine exposure adversely affects development of the primate cerebral cortex. Synapse. 1995;21:332–341. doi: 10.1002/syn.890210408. [DOI] [PubMed] [Google Scholar]
- Lidow MS, Song ZM. Primates exposed to cocaine in utero display reduced density and number of cerebral cortical neurons. J Comp Neurol. 2001a;435:263–275. doi: 10.1002/cne.1028. [DOI] [PubMed] [Google Scholar]
- Lidow MS, Song ZM. Effect of cocaine on cell proliferation in the cerebral wall of monkey fetuses. Cereb Cortex. 2001b;11:545–551. doi: 10.1093/cercor/11.6.545. [DOI] [PubMed] [Google Scholar]
- Lidow MS, Bozian D, Song Z. Cocaine affects cerebral neocortical cytoarchitecture in primates only if administered during neocortical neuronogenesis. Brain Res Dev Brain Res. 2001;128:45–52. doi: 10.1016/s0165-3806(01)00139-0. [DOI] [PubMed] [Google Scholar]
- Lobo MK, Covington HE, III, Chaudhury D, Friedman AK, Sun H, Damez-Werno D, Dietz DM, Zaman S, Koo JW, Kennedy PJ, Mouzon E, Mogri M, Neve RL, Deisseroth K, Han MH, Nestler EJ. Cell type-specific loss of BDNF signaling mimics optogenetic control of cocaine reward. Science. 2010;330:385–390. doi: 10.1126/science.1188472. [DOI] [PMC free article] [PubMed] [Google Scholar]
- Lu H, Lim B, Poo MM. Cocaine exposure in utero alters synaptic plasticity in the medial prefrontal cortex of postnatal rats. J Neurosci. 2009;29:12664–12674. doi: 10.1523/JNEUROSCI.1984-09.2009. [DOI] [PMC free article] [PubMed] [Google Scholar]
- Marin O, Rubenstein JL. A long, remarkable journey: tangential migration in the telencephalon. Nat Rev Neurosci. 2001;2:780–790. doi: 10.1038/35097509. [DOI] [PubMed] [Google Scholar]
- Marin O, Anderson SA, Rubenstein JL. Origin and molecular specification of striatal interneurons. J Neurosci. 2000;20:6063–6076. doi: 10.1523/JNEUROSCI.20-16-06063.2000. [DOI] [PMC free article] [PubMed] [Google Scholar]
- McCarthy D, Lueras P, Bhide PG. Elevated dopamine levels during gestation produce region-specific decreases in neurogenesis and subtle deficits in neuronal numbers. Brain Res. 2007;1182:11–25. doi: 10.1016/j.brainres.2007.08.088. [DOI] [PMC free article] [PubMed] [Google Scholar]
- Miyama S, Takahashi T, Nowakowski RS, Caviness VS., Jr A gradient in the duration of the G1 phase in the murine neocortical proliferative epithelium. Cereb Cortex. 1997;7:678–689. doi: 10.1093/cercor/7.7.678. [DOI] [PubMed] [Google Scholar]
- Nassogne MC, Evrard P, Courtoy PJ. Selective neuronal toxicity of cocaine in embryonic mouse brain cocultures. Proc Natl Acad Sci U S A. 1995;92:11029–11033. doi: 10.1073/pnas.92.24.11029. [DOI] [PMC free article] [PubMed] [Google Scholar]
- Nassogne MC, Louahed J, Evrard P, Courtoy PJ. Cocaine induces apoptosis in cortical neurons of fetal mice. J Neurochem. 1997;68:2442–2450. doi: 10.1046/j.1471-4159.1997.68062442.x. [DOI] [PubMed] [Google Scholar]
- Nobrega-Pereira S, Kessaris N, Du T, Kimura S, Anderson SA, Marin O. Postmitotic Nkx2-1 controls the migration of telencephalic interneurons by direct repression of guidance receptors. Neuron. 2008;59:733–745. doi: 10.1016/j.neuron.2008.07.024. [DOI] [PMC free article] [PubMed] [Google Scholar]
- Novikova SI, He F, Bai J, Badan I, Lidow IA, Lidow MS. Cocaine-induced changes in the expression of apoptosis-related genes in the fetal mouse cerebral wall. Neurotoxicol Teratol. 2005;27:3–14. doi: 10.1016/j.ntt.2004.08.004. [DOI] [PubMed] [Google Scholar]
- Polleux F, Whitford KL, Dijkhuizen PA, Vitalis T, Ghosh A. Control of cortical interneuron migration by neurotrophins and PI3-kinase signaling. Development. 2002;129:3147–3160. doi: 10.1242/dev.129.13.3147. [DOI] [PubMed] [Google Scholar]
- Riccio O, Potter G, Walzer C, Vallet P, Szabo G, Vutskits L, Kiss JZ, Dayer AG. Excess of serotonin affects embryonic interneuron migration through activation of the serotonin receptor 6. Mol Psychiatry. 2009;14:280–290. doi: 10.1038/mp.2008.89. [DOI] [PubMed] [Google Scholar]
- Russo SJ, Mazei-Robison MS, Ables JL, Nestler EJ. Neurotrophic factors and structural plasticity in addiction. Neuropharmacology. 2009;56(Suppl 1):73–82. doi: 10.1016/j.neuropharm.2008.06.059. [DOI] [PMC free article] [PubMed] [Google Scholar]
- Sadri-Vakili G, Bouzou B, Benn CL, Kim MO, Chawla P, Overland RP, Glajch KE, Xia E, Qiu Z, Hersch SM, Clark TW, Yohrling GJ, Cha JH. Histones associated with downregulated genes are hypo-acetylated in Huntington's disease models. Hum Mol Genet. 2007;16:1293–1306. doi: 10.1093/hmg/ddm078. [DOI] [PubMed] [Google Scholar]
- Sadri-Vakili G, Kumaresan V, Schmidt HD, Famous KR, Chawla P, Vassoler FM, Overland RP, Xia E, Bass CE, Terwilliger EF, Pierce RC, Cha JH. Cocaine-induced chromatin remodeling increases brain-derived neurotrophic factor transcription in the rat medial prefrontal cortex, which alters the reinforcing efficacy of cocaine. J Neurosci. 2010;30:11735–11744. doi: 10.1523/JNEUROSCI.2328-10.2010. [DOI] [PMC free article] [PubMed] [Google Scholar]
- Snapyan M, Lemasson M, Brill MS, Blais M, Massouh M, Ninkovic J, Gravel C, Berthod F, Gotz M, Barker PA, Parent A, Saghatelyan A. Vasculature guides migrating neuronal precursors in the adult mammalian forebrain via brain-derived neurotrophic factor signaling. J Neurosci. 2009;29:4172–4188. doi: 10.1523/JNEUROSCI.4956-08.2009. [DOI] [PMC free article] [PubMed] [Google Scholar]
- Stanwood GD, Levitt P. Prenatal exposure to cocaine produces unique developmental and long-term adaptive changes in dopamine D1 receptor activity and subcellular distribution. J Neurosci. 2007;27:152–157. doi: 10.1523/JNEUROSCI.4591-06.2007. [DOI] [PMC free article] [PubMed] [Google Scholar]
- Stanwood GD, Washington RA, Shumsky JS, Levitt P. Prenatal cocaine exposure produces consistent developmental alterations in dopamine-rich regions of the cerebral cortex. Neuroscience. 2001;106:5–14. doi: 10.1016/s0306-4522(01)00256-1. [DOI] [PubMed] [Google Scholar]
- Stanwood GD, Parlaman JP, Levitt P. Anatomical abnormalities in dopaminoceptive regions of the cerebral cortex of dopamine D(1) receptor mutant mice. J Comp Neurol. 2005;487:270–282. doi: 10.1002/cne.20548. [DOI] [PubMed] [Google Scholar]
- Tamamaki N, Yanagawa Y, Tomioka R, Miyazaki J, Obata K, Kaneko T. Green fluorescent protein expression and colocalization with calretinin, parvalbumin, and somatostatin in the GAD67-GFP knock-in mouse. J Comp Neurol. 2003;467:60–79. doi: 10.1002/cne.10905. [DOI] [PubMed] [Google Scholar]
- Tarui T, Takahashi T, Nowakowski RS, Hayes NL, Bhide PG, Caviness VS. Overexpression of p27Kip1, probability of cell cycle exit, and laminar destination of neocortical neurons. Cereb Cortex. 2005;15:1343–1355. doi: 10.1093/cercor/bhi017. [DOI] [PubMed] [Google Scholar]
- Theiler K. Development and normal stages from fertilization to 4 weeks of age. Berlin: Springer; 1972. The house mouse. [Google Scholar]
- Thomas MJ, Kalivas PW, Shaham Y. Neuroplasticity in the mesolimbic dopamine system and cocaine addiction. Br J Pharmacol. 2008;154:327–342. doi: 10.1038/bjp.2008.77. [DOI] [PMC free article] [PubMed] [Google Scholar]
- Whalen MJ, Dalkara T, You Z, Qiu J, Bermpohl D, Mehta N, Suter B, Bhide PG, Lo EH, Ericsson M, Moskowitz MA. Acute plasmalemma permeability and protracted clearance of injured cells after controlled cortical impact in mice. J Cereb Blood Flow Metab. 2008;28:490–505. doi: 10.1038/sj.jcbfm.9600544. [DOI] [PMC free article] [PubMed] [Google Scholar]
- Wichterle H, Turnbull DH, Nery S, Fishell G, Alvarez-Buylla A. In utero fate mapping reveals distinct migratory pathways and fates of neurons born in the mammalian basal forebrain. Development. 2001;128:3759–3771. doi: 10.1242/dev.128.19.3759. [DOI] [PubMed] [Google Scholar]
- Wilkins AS, Genova LM, Posten W, Kosofsky BE. Transplacental cocaine exposure 1: a rodent model. Neurotoxicol Teratol. 1998;20:215–226. doi: 10.1016/s0892-0362(97)00125-6. [DOI] [PubMed] [Google Scholar]
- Williams SN, Undieh AS. Dopamine D1-like receptor activation induces brain-derived neurotrophic factor protein expression. Neuroreport. 2009;20:606–610. doi: 10.1097/WNR.0b013e32832a0a98. [DOI] [PMC free article] [PubMed] [Google Scholar]
- Williams SN, Undieh AS. Brain-derived neurotrophic factor signaling modulates cocaine induction of reward-associated ultrasonic vocalization in rats. J Pharmacol Exp Ther. 2010;332:463–468. doi: 10.1124/jpet.109.158535. [DOI] [PMC free article] [PubMed] [Google Scholar]
- Zachor D, Cherkes JK, Fay CT, Ocrant I. Cocaine differentially inhibits neuronal differentiation and proliferation in vitro. J Clin Invest. 1994;93:1179–1185. doi: 10.1172/JCI117071. [DOI] [PMC free article] [PubMed] [Google Scholar]
- Zachor DA, Moore JF, Brezausek C, Theibert A, Percy AK. Cocaine inhibits NGF-induced PC12 cells differentiation through D(1)-type dopamine receptors. Brain Res. 2000;869:85–97. doi: 10.1016/s0006-8993(00)02355-6. [DOI] [PubMed] [Google Scholar]