Abstract
Background
High dietary fructose has structural and metabolic cardiac impact, but the potential for fructose to exert direct myocardial action is uncertain. Cardiomyocyte functional responsiveness to fructose, and capacity to transport fructose has not been previously demonstrated.
Objective
The aim of the present study was to seek evidence of fructose-induced modulation of cardiomyocyte excitation-contraction coupling in an acute, in vitro setting.
Methods and Results
The functional effects of fructose on isolated adult rat cardiomyocyte contractility and Ca2+ handling were evaluated under physiological conditions (37°C, 2 mM Ca2+, HEPES buffer, 4 Hz stimulation) using video edge detection and microfluorimetry (Fura2) methods. Compared with control glucose (11 mM) superfusate, 2-deoxyglucose (2 DG, 11 mM) substitution prolonged both the contraction and relaxation phases of the twitch (by 16 and 36% respectively, p<0.05) and this effect was completely abrogated with fructose supplementation (11 mM). Similarly, fructose prevented the Ca2+ transient delay induced by exposure to 2 DG (time to peak Ca2+ transient: 2 DG: 29.0±2.1 ms vs. glucose: 23.6±1.1 ms vs. fructose +2 DG: 23.7±1.0 ms; p<0.05). The presence of the fructose transporter, GLUT5 (Slc2a5) was demonstrated in ventricular cardiomyocytes using real time RT-PCR and this was confirmed by conventional RT-PCR.
Conclusion
This is the first demonstration of an acute influence of fructose on cardiomyocyte excitation-contraction coupling. The findings indicate cardiomyocyte capacity to transport and functionally utilize exogenously supplied fructose. This study provides the impetus for future research directed towards characterizing myocardial fructose metabolism and understanding how long term high fructose intake may contribute to modulating cardiac function.
Introduction
Evidence is emerging that high dietary fructose has structural and metabolic impact on the myocardium [1], [2], [3]. The extent to which myocardial cellular alterations reflect direct or indirect actions of elevated fructose intake is not known. Cellular fructose uptake and metabolism is most well described in hepatocytes [4], [5] and there is some evidence to suggest that skeletal muscle also has the capacity to utilize fructose [6]. Whether cardiomyocytes can similarly utilize fructose as a functional substrate has not been determined.
Cellular fructose uptake is mediated by insulin-independent transporters. Fructose is rapidly phosphorylated by fructokinase and bypasses the glycolytic rate-limiting enzyme, phosphofructokinase, proceeding through glycolysis to produce pyruvate and lactate in a less-controlled manner than glucose [7]. Thus, high throughput fructose may be associated with altered cellular glycolytic regulation. Basal plasma fructose concentrations are low (postprandial fructose ∼8–20 µM, human) but with elevated plasma fructose non-hepatic tissue metabolism of fructose may become significant [8].
The myocardial capacity for fructose metabolism is not well characterized, but some evidence suggests that fructose metabolism proceeds in cardiac tissue. The expression and activity of fructokinase has been detected in heart tissue [9], [10] and fructose-mediated myocardial lactate production has been reported [11]. Furthermore, cardiac fructokinase (ketohexokinase) gene expression is upregulated in diabetic mice [10]. Cardiomyocyte capacity for fructose uptake has not been defined. In humans and rodents the circulating fructose concentration is significantly lower than glucose. Thus, fructose uptake by transporters which mediate fructose and glucose entry competitively (e.g. GLUT11 and GLUT12 transporters [12], [13]), would be unlikely to occur in vivo. In contrast, GLUT5 has low affinity for glucose and could be a good candidate for a functional fructose transporter in the heart. However, cardiac GLUT5 expression and functional evidence of cardiomyocyte fructose uptake has not yet been reported.
Cardiomyocyte Ca2+ management is key to ensuring electromechanical functionality and stability. Although fatty acid oxidation supplies the majority of cardiomyocyte ATP production, there is evidence that ATP produced by glycolysis has a significant role in Ca2+ handling. The close association of glycolytic enzymes with Ca2+ transporters provides indication that specific cardiac excitation-contraction coupling processes are particularly reliant on glycolytically produced ATP [14]. Fructose-derived ATP generated through glycolysis could potentially support components of excitation-contraction coupling Ca2+ transport, but a role for fructose in direct cardiomyocyte functional modulation has not yet been demonstrated.
The aim of the present study was to seek evidence of fructose-induced modulation of cardiomyocyte excitation-contraction coupling in an acute, in vitro setting. Effect of fructose influence on cardiomyocyte function and Ca2+ handling was evaluated using isolated adult rat cardiomyocytes. Molecular evidence of expression of the fructose transporter GLUT5 was sought in both ventricular tissue and in cardiomyocytes. This is the first study to identify that fructose has direct action on cardiomyocyte contractile performance, and that cardiomyocytes express the fructose-specific GLUT5 transporter.
Materials and Methods
Ethical approval
This study was carried out in compliance with the recommendations in the Guide for the Care and Use of Laboratory Animals of the National Institutes of Health and the Australian Code of Practice for the Care and Use of Animals for Scientific Purposes. All experiments were approved by the Animal Ethics Committee at the University of Melbourne (#0703281).
Adult rat cardiomyocyte isolation
Ventricular cardiomyocytes were isolated from adult male Sprague Dawley rats. Briefly, rats were decapitated under deep isoflurane anaesthesia and hearts were excised and retrogradely perfused with bicarbonate-buffered Ca2+-free Krebs (in mM: 118 NaCl, 4.8 KCl, 1.2 KH2PO4, 1.2 MgSO47H2O, 25 NaHCO3, 11 glucose) followed by addition of Type II Collagenase (0.56 mg/ml, 295 U/mg, Worthington Biochemical Corporation, NJ, USA) for heart digestion. Left ventricular cells were dispersed in bicarbonate-buffered Krebs solution with 0.25 mM CaCl2 and 26 µg/ml trypsin inhibitor [15].
Myocyte twitch and Ca2+ transient measurements
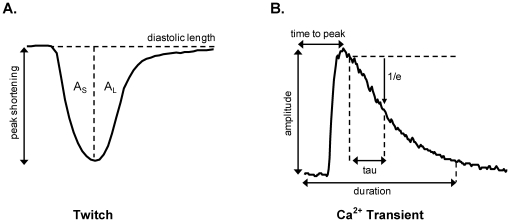
Cardiomyocytes were field stimulated at 4 Hz and superfused at 37°C with a HEPES-Krebs buffer (in mM: 146.2 NaCl, 4.69 KCl, 0.35 NaH2PO4H2O, 1.05 MgSO47H2O, 10 HEPES, 2 CaCl2) supplemented with energy substrate/inhibitor as described below. Cardiomyocyte twitch properties were assessed by video-based edge detection (IonOptix, Milton, MA, USA). The indices used to describe the twitch cycle (depicted in Figure 1A) were peak shortening amplitude (PS, µm), peak shortening normalized to diastolic cell length (% PS), area of the shortening phase (AS, µm*ms), area of the lengthening phase (AL, µm*ms) and area of the total twitch cycle (AT = AS+AL, µm*ms). Area values were determined between baseline and cell length and were normalized to peak shortening amplitude (AS/PS, AL/PS, AT/PS; µm*ms/µm) in order to compare the relative periods of the shortening and relaxation phases in different myocytes [16]. Maximum rates of cardiomyocyte shortening (max dL/dtS) and lengthening (max dL/dtL) were also calculated.
Figure 1. Cardiomyocyte excitation-contraction coupling analysis.
A. Parameters used to describe the myocyte twitch cycle were peak shortening (PS, µm), peak shortening normalized to diastolic cell length (%PS), area of the shortening phase (AS, µm*ms), area of the lengthening phase (AL, µm*ms) and area of the total twitch cycle (AT = AS+AL, µm*ms). Area values were determined between baseline and cell length and were normalized to peak shortening amplitude (AS/PS, AL/PS, AT/PS; µm*ms/µm) in order to compare the relative periods of the shortening and relaxation periods in different myocytes. B. Parameters used to describe the Ca2+ transient were amplitude (nM), time to peak (ms), time constant of decay (Tau, ms) fit from 10% below transient peak, and duration (to 90% Ca2+ transient decay, ms). Transient timing parameters (time to peak and duration) were referenced to time of stimulus delivery.
Cardiomyocytes were loaded with the Ca2+ fluorescent dye, Fura2-AM (25°C, 20 min incubation; Invitrogen, CA, USA). Myocyte Ca2+ signals were measured by microfluorimetry (IonOptix, Milton, MA, USA) [17]. The Fura2 Ca2+ ratiometric signal (F360∶380 nm) was converted to Ca2+ concentration based on in vitro standard curve calibration data employing an Rmin/Rmax scaling as previously described [18]. The indices used to describe the Ca2+ transient (depicted in Figure 1B) were amplitude (nM), time to peak (ms), time constant of decay (Tau, ms), and duration (to 90% Ca2+ transient decay, ms). Transient timing parameters were referenced to time of stimulus delivery. All indices were analyzed off-line using IonWizard (IonOptix, Milton, MA, USA) and were determined after averaging 10 steady-state transients for each myocyte.
Substrate superfusion conditions
To evaluate the effect of fructose on cardiomyocyte excitation-contraction coupling, myocytes were superfused with one of three buffer solutions (pH 7.40) defined by sugar substrate availability: a standard glucose buffer (11 mM glucose, HEPES-Krebs) as control; a glucose free/glucose metabolic inhibition buffer (11 mM 2-deoxyglucose, HEPES-Krebs) to deplete ATP and inhibit contractility; or a fructose buffer (11 mM 2-deoxyglucose (2 DG), 11 mM fructose, HEPES-Krebs). The latter buffer was constituted to determine whether fructose can be functionally utilized as an alternative energy source when glucose metabolism is inhibited. Simple glucose withdrawal (without 2 DG) was not sufficient to suppress function in this acute setting (consistent with occurrence of basal glycogen-derived glucose flux under these conditions). The fructose concentration (11 mM) was chosen as an equimolar replacement of glucose to ensure controlled superfusate conditions (this fructose level would not normally be observed in vivo). The glucose buffer composition was modeled on standard formulations used in previous in vitro studies and the glucose concentration employed is consistent with plasma glucose levels reported for rodents (generally higher than humans) [19], [20], [21]. Myocytes were superfused for 2–3 minutes to obtain steady-state, and measurements of intracellular Ca2+ and myocyte twitch kinetics were recorded for a 2 min treatment period for each cell.
Cardiac tissue collection & gene expression analysis
Hearts were excised from anaesthetized Sprague Dawley adult rats (isofluorane). Adult Sprague Dawley rat cardiomyocytes were isolated and the cell pellet snap-frozen. Ventricular and cardiomyocyte RNA was extracted and reverse-transcribed as previously described [22]. A reverse-transcription negative (i.e. ventricular RNA processed in the absence of Superscript® III RT enzyme) sample was used as a negative control and a small intestine cDNA sample was used as a positive control for all PCR analyses. Relative gene expression levels of cardiac GLUT5 (i.e. Slc2a5; Accession No. NM_031741) and the housekeeper gene (18S) in ventricular, cardiomyocyte and small intestine tissue were determined by real time RT-PCR as previously described [22]. Identification of single melt curve peaks was used to determine PCR product purity. To confirm the presence of GLUT5 in cardiac tissues, conventional RT-PCR was performed using Platinum Taq Polymerase (Invitrogen, CA, USA) with two consecutive runs of 30 PCR cycles to allow visualization of low expression genes. Primer sequences were: GLUT5 (Slc2a5; real time PCR): 5′-GAGTGAACGCGATTTACTACTA-3′ and 5′-AACCGTGACCATGGTCATGAAC-3′; 18S (real time PCR): 5′-TCGAGGCCCTGTAATTGGAA-3′ and 5′-CCCTCCAATGGATCCTCGTT-3′ and GLUT5 (Slc2a5; conventional PCR): 5′-CAGGTATATCTTCCAACGTGGTC-3′ and 5′-TAGTAGTAAATCGCGTTCACTC-3′.
Statistical analyses
Data are expressed as mean (± standard error) and were analyzed by 1-way ANOVA and Newman-Keuls post-hoc test, with p<0.05 considered statistically significant.
Results
Functional in vitro effect of fructose on cardiomyocytes
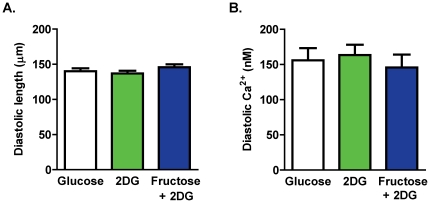
To establish cardiomyocyte capacity to access and utilize extracellular fructose in vitro, isolated myocytes were exposed to HEPES-Krebs superfusate containing fructose as the sole exogenous energy substrate in the presence of 2-deoxyglucose (2 DG, 11 mM) to inhibit endogenous glucose metabolism (hexokinase inhibition [23]). Fructose metabolism bypasses the 2 DG glycolytic inhibition point and proceeds through glycolysis [7]. Myocyte performance in this fructose-containing buffer was compared to performance in control glucose (11 mM) and zero glucose with 2 DG. Diastolic cell length and diastolic Ca2+ levels were not different for myocytes in any of these three superfusate treatment groups (Figure 2A & B). Cell viability was not observed to be affected by any of the superfusates.
Figure 2. Baseline twitch and Ca2+ transient parameters.
A. Diastolic cell length. B. Diastolic Ca2+ levels. Data presented as mean ± s.e.m. n = 10–28 cells/group.
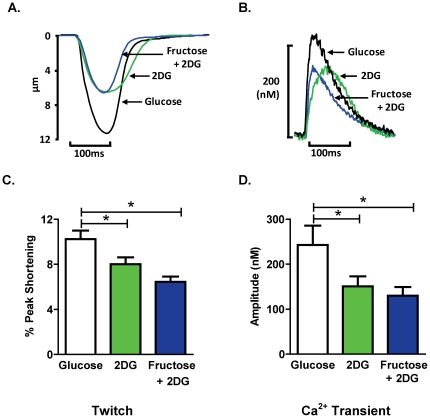
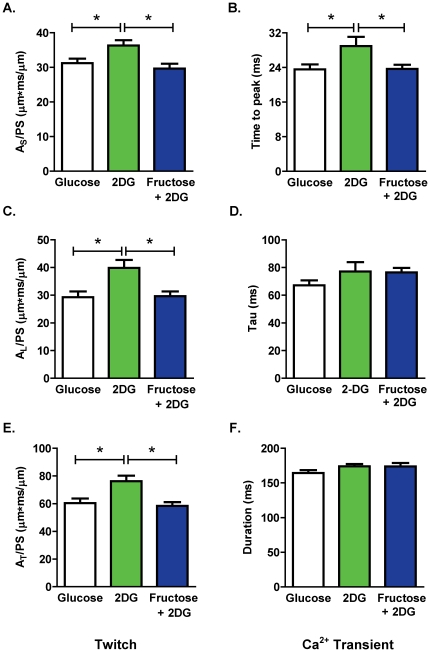
Figure 3A and B depict the representative twitch and Ca2+ transient profiles under the three substrate-defined cell superfusion conditions. The extent of myocyte shortening and Ca2+ transient amplitude was significantly reduced by 2 DG and the addition of fructose to the superfusate did not abrogate this effect (Figure 3C & D). In contrast, the 2 DG-induced increase in the area of the shortening phase of the twitch (AS/PS) and the delay in the Ca2+ transient time to peak were normalized by extracellular fructose (Figure 4A & B; fructose vs. 2 DG twitch: p<0.05; Ca2+ transient: p<0.05). Similarly, extracellular fructose normalized the 2 DG-induced increase in the area of the lengthening phase of the twitch (AL/PS; Figure 4C), and also suppressed the 2 DG-induced delay in time to 50% twitch lengthening (data not shown). The time constant of Ca2+ transient decay (Tau) was not significantly modified by addition of 2 DG alone or by fructose with 2 DG (Figure 4D). The area of the total twitch cycle (AT/PS) was increased by 2 DG and this increase was reversed by fructose (Figure 4E), but duration of the Ca2+ transient was not altered by 2 DG or fructose (Figure 4F). These findings indicate differential and selective cardiomyocyte twitch and Ca2+ transient responses to fructose substitution for glucose in vitro - in the presence of 2 DG, exogenous fructose can restore the shortening and lengthening phases of the active cycle, even though suppression of the twitch peak and Ca2+ transient amplitude is not relieved.
Figure 3. Effect of acute fructose on twitch and Ca2+ transient profiles.
A. Representative twitch profiles from cardiomyocytes superfused with glucose, 2 DG, or fructose +2 DG solutions. B. Representative Ca2+ transient profiles from cardiomyocytes superfused with glucose, 2 DG, or fructose +2 DG solutions. C. Twitch peak shortening, normalized to diastolic cell length (% PS). D. Ca2+ transient peak amplitude. Data presented as mean ± s.e.m. n = 10–28 cells/group. *p<0.05 (1-way ANOVA, Newman-Keuls post-hoc test).
Figure 4. Effect of acute fructose on cardiomyocyte shortening and Ca2+ handling kinetics.
A. Area of the shortening phase of the twitch cycle normalized to peak shortening (AS/PS) B. Time to peak Ca2+ transient relative to electrical stimulus. C. Area of the lengthening phase of the twitch cycle normalized to peak shortening (AL/PS). D. Time constant of Ca2+ transient decay (Tau). E. Area of the total twitch cycle normalized to peak shortening (AT/PS). F. Duration of the Ca2+ transient (time from stimulus to 90% Ca2+ transient decay). Data presented as mean ± s.e.m. n = 10–28 cells/group. *p<0.05 (1-way ANOVA, Newman-Keuls post-hoc test).
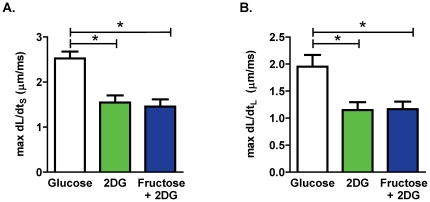
To investigate the effect of acute fructose on cardiomyocyte contractility, the maximum rate of shortening and lengthening were calculated. 2 DG significantly suppressed maximum dL/dtS and dL/dtL relative to control glucose conditions. The addition of fructose to the superfusate did not abrogate the 2 DG effect (Figure 5A and 5B).
Figure 5. Effect of fructose on cardiomyocyte contractility.
A. Maximum rate of cardiomyocyte shortening (max dL/dtS). B. Maximum rate of cardiomyocyte lengthening (max dL/dtL). Data presented as mean ± s.e.m. n = 10–28 cells/group. *p<0.05 (1-way ANOVA, Newman-Keuls post-hoc test).
To further explore the relationship between twitch and Ca2+ under the three substrate-defined conditions, correlation analyses were performed. Figure 6A depicts a significant positive correlation between the area of the total twitch cycle (AT/PS) and the Ca2+ transient duration under control glucose conditions. In contrast a loss of the relationship between these two parameters was observed in the 2 DG alone or 2 DG-containing fructose substituted buffer (Figure 6B & C).
Figure 6. Altered myocyte shortening-Ca2+ relationship.
A. Correlation of area of the total twitch cycle normalized to peak shortening (AT/PS) and Ca2+ transient duration for myocytes superfused under control glucose conditions (R2 = 0.416; *p<0.05). B. Correlation of area of the total twitch cycle normalized to peak shortening (AT/PS) and Ca2+ transient duration for myocytes superfused under 2 DG conditions (R2 = 0.028; p = ns). C. Correlation of area of the total twitch cycle normalized to peak shortening (AT/PS) and Ca2+ transient duration for myocytes superfused under fructose +2 DG conditions (R2 = 0.002; p = ns).
GLUT5 fructose transporter is expressed in myocardial tissue
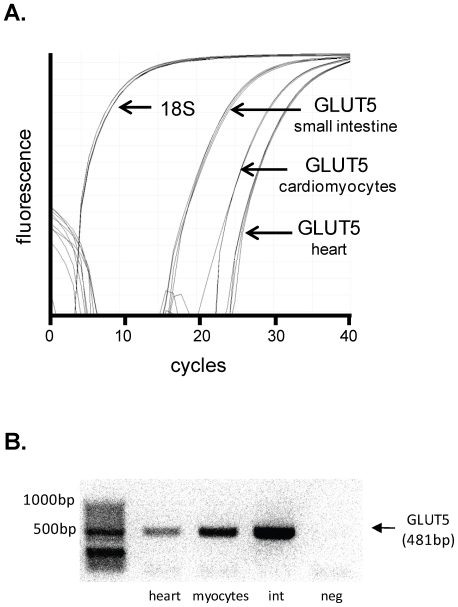
To investigate a possible route of cardiomyocyte fructose entry, real time RT-PCR analysis was utilized to detect GLUT5 expression in adult rat heart homogenate and isolated cardiomyocytes. Initial fluorescence for amplified GLUT5 PCR product in rat cardiomyocytes was approximately 20–22 cycles and rat heart was approximately 24 cycles (Figure 7A), indicating gene expression at a reproducible, albeit relatively low level. Initial fluorescence for GLUT5 in rat small intestine tissue was detected at approximately 15 cycles (Figure 7A). Reverse transcription ‘negative’ and ‘no template control’ samples did not amplify in PCR reactions. The melt curve, generated by progressive temperature increase to 95°C post-PCR amplification, revealed a single peak for GLUT5 samples indicating high PCR product purity (data not shown). Figure 7B presents an electrophoresis gel image of the GLUT5 conventional RT-PCR product band located at 481 bp in rat heart and cardiomyocyte samples. Rat small intestine represents a positive control. No evidence of the 481 bp product was observed in the negative control. Cardiac GLUT5 protein assessment could not be demonstrated using the commercially available antibody (Abcam, ab41533), as positive control immunoblots (kidney and gut) could not be generated (possibly indicating low antibody affinity or poor selectivity).
Figure 7. GLUT5 gene expression in cardiomyocytes.
A. Real time PCR fluorescence depicting GLUT5 (Slc2a5) gene expression relative to 18S in adult rat isolated cardiomyocytes, heart and small intestine (positive control). B. DNA gel image from conventional RT-PCR of GLUT5 (Slc2a5) in rat heart tissue and isolated cardiomyocytes. GLUT5 primers were designed to obtain a 481 bp PCR product. Small intestine (‘int’) tissue was used as a positive control. Negative control (‘neg’) was obtained by RNA that was not reverse-transcribed to cDNA.
Discussion
This investigation provides the first evidence that cardiomyocytes have the capacity to transport and to acutely respond to exogenous fructose availability. Under specific experimental conditions of in vitro glucose metabolic inhibition, fructose abrogated the 2 DG-induced prolongation of twitch timecourse (i.e. reversal of increased shortening and lengthening timecourse indices) and Ca2+ transient (i.e. reversal of increased time to peak Ca2+ transient). In a ‘proof-of-principle’ manner, this study provides functional demonstration that fructose may serve as a substrate to support cardiomyocyte excitation-contraction coupling in an acute setting. Furthermore, it is established that the fructose-specific transporter, GLUT5, is expressed in cardiomyocytes and may provide a route of cardiomyocyte fructose entry.
The finding that in the presence of the glucose metabolic inhibitor 2 DG with glucose deplete buffer, extracellular delivery of fructose is able to reverse the twitch (both AS/PS and AL/PS) and Ca2+ transient (time to peak) prolongation, could be indicative of an effect of fructose on Ca2+ release from the sarcoplasmic reticulum (via ryanodine receptor modulation) and on the re-uptake of Ca2+ (via activation of the sarcoplasmic reticulum Ca2+ ATPase (SERCA2)). Under normal conditions SERCA2 has been estimated to require 15% of ATP produced by the cardiomyocyte [23], [24] and is glycolysis-dependent [25]. A difficulty with this interpretation is the lack of effect of fructose (or 2 DG) on the value of the time constant of the Ca2+ transient decay (Tau, Figure 4D). It is conventional to assume that altered SERCA2 function is reflected in modified Tau. It may be that in this setting Tau is a relatively insensitive parameter (indicative of the kinetic of only a relatively limited portion of the Ca transient decay timecourse). Altered function of other Ca2+ transporters may also be involved in modulating the Ca2+ transient characteristics. The Na+Ca2+exchanger is indirectly glycolysis-dependent via the Na+K+ATPase which establishes the sarcolemmal Na+ electrochemical gradient. The Na+K+ATPase pump is closely associated with glycolytic enzymes at the sarcolemma and is dependent on glycolytic ATP [26], [27], [28]. In the present study, fructose may provide ATP for this transporter thus increasing the driving force for Na+Ca2+ exchange and promoting Ca2+ extrusion. This mechanism is also consistent with the lack of fructose effect observed on the rate parameters dL/dtS and dL/dtL indicating that fructose actions are likely occurring during the late phase of the shortening and lengthening cycle.
Interestingly we find that that the expected positive correlation between twitch cycle length and transient duration, prominent in the control glucose superfused myocytes, is absent in the 2 DG treated myocytes (Figure 6B & C). This suggests that in the glucose deficient state, the mechanisms which modify the combined shortening and lengthening phases of the cycle are different to the Ca2+ handling processes which dominate in the very late phase of relaxation. More extensive pharmacological investigation is required to establish precisely how fructose-derived ATP may interact with Ca2+ handling proteins to contribute to the Ca2+ and twitch modifications observed, at different phases during the contractile cycle. Although fructose had marked effects on the timecourse of the twitch and Ca2+ transient, the 2 DG-induced decrease in the extent of myocyte shortening and the Ca2+ transient amplitude was not reversed by fructose. The basis for the selective influence of fructose on cardiomyocyte excitation-contraction coupling is not clear. An effect of 2 DG per se on sarcoplasmic reticulum Ca2+ storage capacity could be implicated, but at present there is no evidence from other sources to evaluate this proposition.
The in vitro manoeuvre (with relatively high fructose) in the present study demonstrates that fructose is able to modify cardiomyocyte contraction and relaxation timecourse when applied acutely. The manner in which sustained high fructose exposure remodels cardiomyocyte excitation-contraction coupling in vivo may be qualitatively different - and potentially detrimental. In the present study cardiomyocyte viability was not affected by the acute fructose superfusion, but it has been recently reported that chronic dietary fructose exposure is associated with activation of myocardial autophagic programmed cell death signaling [29].
Long-term impacts of fructose-mediated phosphofructokinase bypass on cardiomyocyte metabolism may be ultimately detrimental to myocardial contractility involving oxidative stress and glycosylation-mediated dysfunction [17]. The high reactivity of fructose and its metabolites (relative to glucose) may contribute to the formation of intracellular advanced glycation end-products (AGEs) and intracellular protein modifications [30]. The hexosamine biosynthesis pathway mediates O-linked N-acetyl-glucosamine (O-GlcNAc) regulation of key proteins in cardiomyocytes driven by fructose-6-phosphate (a metabolite of glycolysis) [31], [32]. Although hepatocyte fructose conversion to fructose-6-phosphate is well established [7], in cardiomyocytes there has not previously been a rationale to prompt evaluation of fructose contribution to cardiomyocyte O-GlcNAcylation. The evidence of cardiomyocyte fructose access presented in this study, provides a basis to pursue further investigations in this field.
The novel finding that the fructose-specific transporter, GLUT5, is expressed in rodent cardiomyocytes suggests that cardiac fructose metabolism may be of functional importance, a possibility not previously identified. Earlier attempts to detect cardiac GLUT5 by northern blot were unsuccessful [33], [34], and no data have been previously presented to identify GLUT5 protein in the heart [35]. Using an alternative approach, involving both real time and conventional PCR, we have clearly demonstrated cardiomyocyte GLUT5 gene expression. Interestingly, the GLUT5 expression measured in cardiomyocytes is higher than in the heart homogenate, suggesting that the average GLUT5 expression is more prominent in cardiomyocytes than other cell types. Earlier failure to detect cardiac GLUT5 by Northern blot suggests this technique may not be sufficiently sensitive to detect this gene expressed at a low level. Fructose uptake by transporters which mediate fructose and glucose entry competitively (e.g. GLUT11 and GLUT12 [12], [13]) would be unlikely to occur in vivo. In contrast, GLUT5 has a low affinity for glucose. In the in vitro conditions of the present study, it cannot be determined whether fructose cardiomyocyte entry is via GLUT5, but these expression data provide evidence of cardiomyocyte capacity to transport fructose under in vivo conditions of relatively high glucose. Future investigation involving cardiomyocyte GLUT5 knockdown will elucidate the role of this transporter in cardiomyocyte fructose metabolism.
In conclusion, this is the first study to demonstrate an acute influence of fructose on cardiomyocyte excitation-contraction coupling. The findings indicate cardiomyocyte capacity to transport and functionally utilize exogenously supplied fructose. Further research directed towards characterizing myocardial fructose metabolism and evaluating the long-term modulation of myocardial function by elevated endogenous fructose is now warranted. Dietary fructose intake is increasing and a role for direct fructose action in the development of insulin resistant cardiomyopathy requires investigation.
Acknowledgments
The expert technical assistance provided by F. Abogodie and by A. Bei is acknowledged.
Footnotes
Competing Interests: The authors have declared that no competing interests exist.
Funding: This work was supported by the National Heart Foundation of Australia (www.heartfoundation.org.au). The funders had no role in study design, data collection and analysis, decision to publish, or preparation of the manuscript.
References
- 1.Mellor KM, Ritchie RH, Delbridge LM. Reactive oxygen species and insulin-resistant cardiomyopathy. Clin Exp Pharmacol Physiol. 2010;37:222–228. doi: 10.1111/j.1440-1681.2009.05274.x. [DOI] [PubMed] [Google Scholar]
- 2.Mellor KM, Ritchie RH, Davidoff AJ, Delbridge LMD. Elevated dietary sugar and the heart: experimental models and myocardial remodeling. Can J Physiol Pharmacol. 2010;88:525–540. doi: 10.1139/y10-005. [DOI] [PubMed] [Google Scholar]
- 3.Chess DJ, Xu W, Khairallah R, O'Shea KM, Kop WJ, et al. The antioxidant tempol attenuates pressure overload-induced cardiac hypertrophy and contractile dysfunction in mice fed a high fructose diet. Am J Physiol Heart Circ Physiol. 2008;295:H2223–2230. doi: 10.1152/ajpheart.00563.2008. [DOI] [PMC free article] [PubMed] [Google Scholar]
- 4.Henry RR, Crapo PA, Thorburn AW. Current issues in fructose metabolism. Annu Rev Nutr. 1991;11:21–39. [Google Scholar]
- 5.Tappy L, Le KA. Metabolic effects of fructose and the worldwide increase in obesity. Physiol Rev. 2010;90:23–46. doi: 10.1152/physrev.00019.2009. [DOI] [PubMed] [Google Scholar]
- 6.Ahlborg G, Bjorkman O. Splanchnic and muscle fructose metabolism during and after exercise. J Appl Physiol. 1990;69:1244–1251. doi: 10.1152/jappl.1990.69.4.1244. [DOI] [PubMed] [Google Scholar]
- 7.Mayes PA. Intermediary metabolism of fructose. Am J Clin Nutr. 1993;58:754S–765S. doi: 10.1093/ajcn/58.5.754S. [DOI] [PubMed] [Google Scholar]
- 8.Kawasaki T, Akanuma H, Yamanouchi T. Increased fructose concentrations in blood and urine in patients with diabetes. Diabetes Care. 2002;25:353–357. doi: 10.2337/diacare.25.2.353. [DOI] [PubMed] [Google Scholar]
- 9.Bais R, James HM, Rofe AM, Conyers RA. The purification and properties of human liver ketohexokinase. A role for ketohexokinase and fructose-bisphosphate aldolase in the metabolic production of oxalate from xylitol. Biochem J. 1985;230:53–60. doi: 10.1042/bj2300053. [DOI] [PMC free article] [PubMed] [Google Scholar]
- 10.Noh HL, Hu Y, Park TS, DiCioccio T, Nichols AJ, et al. Regulation of plasma fructose and mortality in mice by the aldose reductase inhibitor lidorestat. J Pharmacol Exp Ther. 2009;328:496–503. doi: 10.1124/jpet.108.136283. [DOI] [PMC free article] [PubMed] [Google Scholar]
- 11.Tavazzi B, Starnes JW, Lazzarino G, Di Pierro D, Nuutinen EM, et al. Exogenous fructose-1,6-bisphosphate is a metabolizable substrate for the isolated normoxic rat heart. Basic Res Cardiol. 1992;87:280–289. doi: 10.1007/BF00804337. [DOI] [PubMed] [Google Scholar]
- 12.Scheepers A, Schmidt S, Manolescu A, Cheeseman CI, Bell A, et al. Characterization of the human SLC2A11 (GLUT11) gene: alternative promoter usage, function, expression, and subcellular distribution of three isoforms, and lack of mouse orthologue. Mol Membr Biol. 2005;22:339–351. doi: 10.1080/09687860500166143. [DOI] [PubMed] [Google Scholar]
- 13.Rogers S, Chandler JD, Clarke AL, Petrou S, Best JD. Glucose transporter GLUT12-functional characterization in Xenopus laevis oocytes. Biochem Biophys Res Commun. 2003;308:422–426. doi: 10.1016/s0006-291x(03)01417-7. [DOI] [PubMed] [Google Scholar]
- 14.Xu KY, Zweier JL, Becker LC. Functional coupling between glycolysis and sarcoplasmic reticulum Ca2+ transport. Circ Res. 1995;77:88–97. doi: 10.1161/01.res.77.1.88. [DOI] [PubMed] [Google Scholar]
- 15.Delbridge LM, Connell PJ, Harris PJ, Morgan TO. Ethanol effects on cardiomyocyte contractility. Clin Sci (Lond) 2000;98:401–407. [PubMed] [Google Scholar]
- 16.Ren J, Davidoff AJ, Ingwall JS. Creatine kinase inhibitor iodoacetamide antagonizes calcium-stimulated inotropy in cardiomyocytes. Clin Exp Pharmacol Physiol. 2009;36:141–145. doi: 10.1111/j.1440-1681.2008.05034.x. [DOI] [PubMed] [Google Scholar]
- 17.Ren J, Gintant GA, Miller RE, Davidoff AJ. High extracellular glucose impairs cardiac E-C coupling in a glycosylation-dependent manner. Am J Physiol. 1997;273:H2876–2883. doi: 10.1152/ajpheart.1997.273.6.H2876. [DOI] [PubMed] [Google Scholar]
- 18.Grynkiewicz G, Poenie M, Tsien RY. A new generation of Ca2+ indicators with greatly improved fluorescence properties. J Biol Chem. 1985;260:3440–3450. [PubMed] [Google Scholar]
- 19.Tirosh A, Shai I, Tekes-Manova D, Israeli E, Pereg D, et al. Normal fasting plasma glucose levels and type 2 diabetes in young men. N Engl J Med. 2005;353:1454–1462. doi: 10.1056/NEJMoa050080. [DOI] [PubMed] [Google Scholar]
- 20.Schwanke ML, Dutta K, Podolin DA, Davidoff AJ. Cardiomyocyte dysfunction in insulin-resistant rats: a female advantage. Diabetologia. 2006;49:1097–1105. doi: 10.1007/s00125-006-0184-9. [DOI] [PubMed] [Google Scholar]
- 21.Hall JL, Sexton WL, Stanley WC. Exercise training attenuates the reduction in myocardial GLUT-4 in diabetic rats. J Appl Physiol. 1995;78:76–81. doi: 10.1152/jappl.1995.78.1.76. [DOI] [PubMed] [Google Scholar]
- 22.Mellor K, Ritchie RH, Meredith G, Woodman OL, Morris MJ, et al. High-fructose diet elevates myocardial superoxide generation in mice in the absence of cardiac hypertrophy. Nutrition. 2009;26:842–848. doi: 10.1016/j.nut.2009.08.017. [DOI] [PubMed] [Google Scholar]
- 23.Goldhaber J. Metabolism in normal and ischemic myocardium. In: Langer G, editor. The Myocardium. London: 2nd edn. Academic Press; 1997. [Google Scholar]
- 24.Gibbs CL, Chapman JB. Cardiac heat production. Annu Rev Physiol. 1979;41:507–519. doi: 10.1146/annurev.ph.41.030179.002451. [DOI] [PubMed] [Google Scholar]
- 25.Kockskamper J, Zima AV, Blatter LA. Modulation of sarcoplasmic reticulum Ca2+ release by glycolysis in cat atrial myocytes. J Physiol. 2005;564:697–714. doi: 10.1113/jphysiol.2004.078782. [DOI] [PMC free article] [PubMed] [Google Scholar]
- 26.Weiss JN, Venkatesh N. Metabolic regulation of cardiac ATP-sensitive K+ channels. Cardiovasc Drugs Ther. 1993;7(Suppl 3):499–505. doi: 10.1007/BF00877614. [DOI] [PubMed] [Google Scholar]
- 27.Van Emous JG, Vleggeert-Lankamp CL, Nederhoff MG, Ruigrok TJ, Van Echteld CJ. Postischemic Na(+)-K(+)-ATPase reactivation is delayed in the absence of glycolytic ATP in isolated rat hearts. Am J Physiol Heart Circ Physiol. 2001;280:H2189–2195. doi: 10.1152/ajpheart.2001.280.5.H2189. [DOI] [PubMed] [Google Scholar]
- 28.Pierce GN, Philipson KD. Binding of glycolytic enzymes to cardiac sarcolemmal and sarcoplasmic reticular membranes. J Biol Chem. 1985;260:6862–6870. [PubMed] [Google Scholar]
- 29.Mellor KM, Bell JR, Young MJ, Ritchie RH, Delbridge LM. Myocardial autophagy activation and suppressed survival signaling is associated with insulin resistance in fructose-fed mice. J Mol Cell Cardiol. 2011;50:1035–1043. doi: 10.1016/j.yjmcc.2011.03.002. [DOI] [PubMed] [Google Scholar]
- 30.Schalkwijk CG, Stehouwer CD, van Hinsbergh VW. Fructose-mediated non-enzymatic glycation: sweet coupling or bad modification. Diabetes Metab Res Rev. 2004;20:369–382. doi: 10.1002/dmrr.488. [DOI] [PubMed] [Google Scholar]
- 31.Laczy B, Fulop N, Onay-Besikci A, Des Rosiers C, Chatham JC. Acute Regulation of Cardiac Metabolism by the Hexosamine Biosynthesis Pathway and Protein O-GlcNAcylation. PLoS ONE. 2011;6:e18417. doi: 10.1371/journal.pone.0018417. [DOI] [PMC free article] [PubMed] [Google Scholar]
- 32.Davidoff AJ. Convergence of glucose- and fatty acid-induced abnormal myocardial excitation-contraction coupling and insulin signalling. Clin Exp Pharmacol Physiol. 2006;33:152–158. doi: 10.1111/j.1440-1681.2006.04343.x. [DOI] [PubMed] [Google Scholar]
- 33.Corpe CP, Bovelander FJ, Munoz CM, Hoekstra JH, Simpson IA, et al. Cloning and functional characterization of the mouse fructose transporter, GLUT5. Biochim Biophys Acta. 2002;1576:191–197. doi: 10.1016/s0167-4781(02)00284-1. [DOI] [PubMed] [Google Scholar]
- 34.Castello A, Guma A, Sevilla L, Furriols M, Testar X, et al. Regulation of GLUT5 gene expression in rat intestinal mucosa: regional distribution, circadian rhythm, perinatal development and effect of diabetes. Biochem J. 1995;309(Pt 1):271–277. doi: 10.1042/bj3090271. [DOI] [PMC free article] [PubMed] [Google Scholar]
- 35.Shepherd PR, Gibbs EM, Wesslau C, Gould GW, Kahn BB. Human small intestine facilitative fructose/glucose transporter (GLUT5) is also present in insulin-responsive tissues and brain. Investigation of biochemical characteristics and translocation. Diabetes. 1992;41:1360–1365. doi: 10.2337/diab.41.10.1360. [DOI] [PubMed] [Google Scholar]


