

Abstract
Background
Kidney disease in type 1 diabetes has been historically thought to be more prevalent in men. As recent data do not reflect this pattern, we evaluated whether a sex difference persists.
Study design
Prospective cohort study.
Setting and participants
We used 18-year follow-up data from the Pittsburgh Epidemiology of Diabetes Complications study (n=788; baseline mean age 27 and diabetes duration 19 years).
Predictor or factor
Sex and diagnosis interval (1950–64 or 1965–80).
Outcomes
The cumulative incidences of macroalbuminuria (albumin excretion rate >200 μg/min) and end-stage renal disease (ESRD, kidney failure, dialysis or transplant) were evaluated at 20, 25, and 30 years of diabetes duration. To address potential survival bias, death certificate information was included in determining ESRD for those who died before baseline (n=145). Analyses were stratified by diagnosis year (1950–64 or 1965–80).
Other measurements
Kidney disease risk factor information was available.
Results
A significant interaction was noted between sex and diagnosis cohort for ESRD incidence by 25 (p=0.002) and 30 (p<0.001) years’ duration. Thus, within the 1950–64 cohort (210 men, 180 women), ESRD was higher in men compared to women by 25 (30.6% vs. 18.0%, respectively) and 30 (43.4% vs. 24.6%, respectively) years duration. However, within the 1965–80 cohort (260 men, 283 women), incidence was higher in women (7.6% vs. 13.8% by 25 yrs [p=0.04] and 13.7% vs. 21.0% by 30 yrs [p=0.09] in men vs. women, respectively). Results were similar for macroalbuminuria.
Limitations
Study participants were not followed from the onset of diabetes and thus, risk factor data from that period are lacking.
Conclusions
Our data suggest that the male excess of type 1 diabetic kidney disease cases observed in the earlier cohort has been eliminated in the younger cohort. The reason for this dramatic change is currently unclear but should be addressed in subsequent studies.
Evidence from prospective studies on risk factors for end-stage renal disease (ESRD) development in individuals with type 1 diabetes is limited. Existing reports, however, concur that apart from baseline proteinuria, modifiable risk factors such as poor glycemic control, hypertension, and dyslipidemia play an important role in the development of ESRD (1–4). Non-modifiable risk factors related to ESRD incidence comprise age at onset of type 1 diabetes, with increased complication risk associated with a later age at diabetes onset, and sex, with men experiencing greater disease risk (5–12). Indeed, although the presence of diabetes mellitus reduces the protection women enjoy compared to men against the development of vascular complications, historically, kidney disease in type 1 diabetes has been thought to be more prevalent in men.
Thus, the combined prevalence of microalbuminuria and macroalbuminuria in individuals with diabetes of 30 years’ duration was reported to be 84% in men versus 59% in women among participants of the Pittsburgh Epidemiology of Diabetes Complications (EDC) study (8). Similar findings of greater rates of kidney disease outcomes in men have been previously reported from the Joslin clinic (9), the Wisconsin epidemiologic study of diabetic retinopathy (WESDR) (10), and the Steno diabetes center (12). Moreover, an increased annual age-adjusted incidence [ND1] of ESRD in white men (52.2% [95% CI, 42.8%–61.6%]) compared to women (21.2% [95% CI, 15.9%–26.4%]) was observed among individuals with type 1 diabetes reported to the Michigan Kidney Registry (11).
Interestingly, however, this historic excess of kidney complications among men, compared to women, has not always been reflected in more recent publications. Indeed, although the 10 year incidence of reduced kidney function (defined by the development of a serum creatinine of ≥2 mg/dL) was increased in men (RR, 1.59; 95% CI, 1.00–2.53) in the WESDR study, sex was not a significant covariate in multivariable models (13). Importantly, no significant excess of kidney complications in men compared to women existed in a Finnish cohort of all individuals diagnosed with type 1 diabetes before 30 years of age and followed for a median of 16.7 years (7). The overall incidence of ESRD in this cohort was 1.82 per 1,000 years. Moreover, there was no male predominance in the incidence of ESRD in Sweden among individuals with diabetes diagnosed prior to their 20th year of life and diabetes duration of at least 13 years who had been followed for a median of 20 years (6). An increased incidence in men was, however, observed in the subset diagnosed with diabetes after the age of 20 years. In this study, the reported incidence of ESRD was exceptionally low, at 0.53 per 1,000 person years.
Whether this apparent shift toward a balance in the proportion of incident cases of ESRD in men and women with type 1 diabetes is real has not been thoroughly investigated to date. Thus, our aim in the present study was to evaluate whether a sex difference noted in rates of ESRD within the EDC study twenty years ago (8) still persists, and whether modifiable risk factors could account for the excess risk previously observed among men. Given suggestions of a possible role of an individual’s age at the time of diabetes diagnosis (in particular, whether diagnosis occurred prior to or after puberty) on the subsequent risk of developing complications, age at diabetes diagnosis was also assessed.
Methods
Study population
The EDC study was based on a historical cohort of incident cases of childhood onset (<17 years) type 1 diabetes that were diagnosed or seen within one year of diagnosis at Children’s Hospital of Pittsburgh (8) between 1950 and 1980 and resided within 100 miles (or 2.5 hours) of the Pittsburgh Metropolitan area (n=1,124). This cohort has been shown to be representative of the Allegheny County, Pennsylvania, type 1 diabetes population (14). The first clinical assessment for the EDC study was conducted between 1986 and 1988, when the mean participant age and diabetes duration were 28 and 19 years, respectively. Subsequently, biennial examinations were conducted for 10 years, with a further examination at 18 years. Of the 1,124 patients identified, 145 (13%) died before study initiation, whereas 191 (17%) chose not to participate. Thus, 788 (70%) participated, with 130 (16%) only providing survey information. The University of Pittsburgh IRB approved the study protocol.
Risk factor assessment
Prior to each clinical visit, participants were sent questionnaires concerning demographic, health care, self-care, and medical history information. Blood pressure was measured with a random zero sphygmomanometer, after a five minute rest (15) and hypertension was defined as ≥140/90 mmHg or use of antihypertensive medication. Stable glycosylated hemoglobin (HbA1) was measured by ion exchange chromatography (Isolab, Akron, OH[ND2]) and subsequently by automated high-performance liquid chromatography (Diamat, BioRad, www.bio-rad.com). The two assays were highly correlated (r=0.95). Measured HbA1 (1986–1998) was converted to Diamat standard HbA1c values using a regression formula derived from duplicate analyses (Diamat HbA1c = (0.83 * EDC HbA1) + 0.14).
High density lipoprotein cholesterol (HDL) was determined enzymatically after precipitation with heparin and manganese chloride, with a modification (16) of the Lipid Research Clinics method (17). Cholesterol and triglycerides were measured enzymatically (18–19). Non-HDL cholesterol was calculated as total minus HDL cholesterol. White blood cell count was obtained using a counter S-plus IV and fibrinogen using a biuret colorimetric procedure and a clotting method. Serum and urinary albumin were measured by immunonephelometry (20–21) and serum creatinine was assayed by an Ectachem 400 Analyzer (Eastman Kodak Co., www.kodak.com), which unlike picric acid-based methods, does not overestimate creatinine concentrations (22). Microalbuminuria was defined as albumin excretion rate 20–200 μg/min (30–300 mg/24 hours) and macroalbuminuria as albumin excretion rate >200 μg/min (>300 mg/24 hours) in at least 2 of 3 validated timed biennial urine collections. In 10% of the urine collections were deemed inadequate based on creatinine excretion, albumin-creatinine ratio was used (microalbuminuria defined as 0.03–0.3 mg/mg and macroalbuminuria as >0.3 mg/mg) (21). Onset of ESRD was defined as starting dialysis or undergoing kidney transplant. Micro- and macroalbuminuria include individuals who later progressed to ESRD. Glomerular filtration rate was estimated by the CKD-EPI creatinine equation (23), although using the Cockcroft-Gault formula (24) or the IDMS-traceable four variable MDRD (Modification of Diet in Renal Disease) Study equation (25) did not alter findings. It should, however, be noted that serum creatinine was not calibrated in this study.
Statistical analysis
The cumulative incidences of macroalbuminuria and ESRD were evaluated at 20, 25, and 30 years of diabetes duration stratified by diabetes diagnosis year (prior to, or after, 1/1/1965). To overcome potential survival bias, information from death certificates from individuals who died prior to the baseline examination (n=145) and surveys from those who only provided survey data (n=130) was included in determining ESRD. To further address whether differences in the cumulative incidence of ESRD were related to a competing mortality risk, we also evaluated the cumulative incidence of the combined outcome of ESRD or death in men and women by diabetes duration and year of diagnosis.
Analyses of modifiable risk factors were restricted to the examined cohort for ESRD, for which a more complete follow-up was available (n=630 out of 658 with no ESRD at study entry). To assess the presence of differences between advanced kidney disease incident cases and non-cases by sex and diagnosis cohort, the student’s t-test or Wilcoxon 2-sample test for continuous variables and the χ2 or Fisher’s exact test, as appropriate, for categorical variables were used. Left truncation Cox proportional hazards models with backward elimination were constructed to further evaluate whether differences in modifiable risk factors could explain the observed sex differences in incidence by diagnosis cohort. Models were conducted with diabetes duration used as the time axis and including age at onset of diabetes as a covariate, the latter effectively representing age when diabetes duration is used as the time axis. The mean duration of diabetes at the time of death of individuals who died prior to study initiation was used as the left truncation limit. Median follow-up was 18.3 (95% CI, 18.2–18.4) years for macroalbuminuria and 16.7 (95% CI, 14.8–18.0) years for ESRD. Non-normally distributed variables were logarithmically transformed for entry into multivariable models. Statistical analyses were conducted using Statistical Analysis Software (SAS) version 9.1 (SAS Institute, www.sas.com).
Results
Participant characteristics at study entry are shown in Table 1 by sex and diabetes diagnosis cohort for the entire population (including pre-deceased, n=933) and also for those who participated in the examinations (n=658). No differences were observed in either group by sex in age, age at diabetes onset, duration of diabetes or HbA1c. Women, as expected, had a smaller waist to hip ratio, lower blood pressures and higher HDL cholesterol compared to men in both diagnosis cohorts. Moreover, sex differences (higher in men) for insulin dose per body weight, non-HDL cholesterol and albumin excretion rate were only observed in the earlier diagnosis cohort, whereas inflammatory markers (higher in women) differed by sex only in the younger cohort.
Table 1.
Baseline characteristics by sex and diabetes diagnosis cohort
| Diagnosis between 1950–64 | Diagnosis between 11965–80 | |||||
|---|---|---|---|---|---|---|
| Characteristics | Men | Women | p-value | Men | Women | p-value |
| Including pre-deceased | n=210 | n=180 | n=260 | n=283 | ||
| Age (years) | 36.9 +/−5.7 | 36.8 +/−5.0 | 0.8 | 23.4 +/−5.6 | 23.3 +/−5.6 | 0.8 |
| Age at onset (years) | 7.8 +/−3.9 | 8.0 +/−3.8 | 0.6 | 8.4 +/−4.2 | 8.7 +/−3.8 | 0.4 |
| Diabetes duration (years) | 29.1 +/−4.1 | 28.8 +/−3.6 | 0.4 | 15.0 +/−4.5 | 14.6 +/−4.5 | 0.3 |
| Examined cohort | n=115 | n=109 | n=218 | n=216 | ||
| Age (years) | 35.3 +/− 4.8 | 36.1 +/− 4.7 | 0.2 | 23.4 +/− 5.6 | 23.4 +/− 5.5 | 0.9 |
| Age at onset (years) | 7.2 +/− 3.8 | 8.0 +/− 3.8 | 0.1 | 8.4 +/− 4.3 | 8.8 +/− 3.9 | 0.3 |
| Diabetes duration (years) | 28.1 +/− 3.6 | 28.1 +/− 3.4 | 0.9 | 15.0 +/− 4.4 | 14.6 +/− 4.3 | 0.3 |
| Body mass index (kg/m2) | 24.0 +/− 2.7 | 23.4 +/− 3.7 | 0.2 | 23.4 +/− 3.2 | 23.4 +/− 3.2 | 0.8 |
| Waist-to-hip ratio | 0.90 +/− 0.05 | 0.78 +/− 0.06 | <0.001 | 0.86 +/− 0.05 | 0.77 +/− 0.06 | <0.001 |
| No. with data | 114 | 107 | 217 | 214 | ||
| Ever smoked | 66 (57.4) | 53 (48.6) | 0.2 | 70 (32.1) | 63 (29.2) | 0.5 |
| HbA1c (%) | 8.5 +/− 1.5 | 8.6 +/− 1.3 | 0.7 | 8.9 +/− 1.5 | 8.8 +/− 1.6 | 0.4 |
| Insulin dose/weight | 0.75 +/− 0.26 | 0.66 +/− 0.21 | 0.006 | 0.84 +/− 0.23 | 0.82 +/− 0.25 | 0.3 |
| No. with data | 111 | 107 | 204 | 208 | ||
| Systolic BP (mmHg) | 126.1 +/− 20.4 | 113.8 +/− 14.3 | <0.001 | 113.0 +/− 13.1 | 108.0 +/− 13.0 | <0.001 |
| Diastolic BP (mmHg) | 79.8 +/− 11.4 | 69.6 +/− 9.2 | <0.001 | 73.2 +/− 10.4 | 70.6 +/− 10.8 | 0.01 |
| BP medication | 30 (27.0) | 17 (15.9) | 0.05 | 13 (6.4) | 7 (3.4) | 0.1 |
| No. with data | 111 | 107 | 203 | 208 | ||
| Hypertension | 43 (37.4) | 24 (22.0) | 0.01 | 21 (9.7) | 18 (8.3) | 0.6 |
| No. with data | 115 | 109 | 217 | 216 | ||
| Pulse (beats/min) | 77.9 +/− 14.9 | 79.8 +/− 9.4 | 0.2 | 76.0 +/− 11.1 | 79.2 +/− 9.9 | 0.002 |
| HDL cholesterol (mg/dL) | 48.6 +/− 10.8 | 58.9 +/− 13.6 | <0.001 | 49.5 +/− 9.2 | 58.3 +/− 12.6 | <0.001 |
| Non-HDL cholesterol (mg/dL) | 157.8 +/− 47.3 | 139.6 +/− 40.3 | 0.002 | 131.9 +/− 40.4 | 131.5 +/− 41.7 | 0.9 |
| ACEi/ARB use | 7 (6.2) | 9 (8.3) | 0.5 | 4 (1.9) | 2 (0.9) | 0.4 |
| No. with data | 112 | 108 | 206 | 210 | ||
| SCr (mg/dL) | 1.1 (0.9, 1.5) | 0.8 (0.7, 1.0) | <0.001 | 0.9 (0.7, 1.1) | 0.7 (0.6, 0.9) | <0.001 |
| No. with data | 113 | 109 | 217 | 215 | ||
| eGFR (mL/min/1.73 m2)* | 83.4 +/− 34.0 | 86.6 +/− 34.4 | 0.5 | 111.6 +/− 28.6 | 109.2 +/− 28.4 | 0.4 |
| Hyperfiltration** | 2 (2.3) | 7 (8.2) | 0.1 | 59 (28.2) | 49 (23.8) | 0.3 |
| No. with data | 87 | 85 | 209 | 206 | ||
| Albumin excretion rate (μg/min) | 104.4 (13.6, 1066.7) | 24.2 (8.3, 211.7) | <0.001 | 11.5 (7.4, 54.3) | 12.4 (6.6, 69.4) | 0.7 |
| Prevalent microalbuminuria | 84 (75.0) | 57 (53.8) | 0.001 | 87 (42.6) | 83 (41.9) | |
| No. with data | 112 | 106 | 204 | 198 | ||
| Prevalent macroalbuminuria | 59 (53.1) | 33 (32.0) | 0.002 | 36 (18.1) | 43 (22.4) | 0.3 |
| No. with data | 111 | 103 | 199 | 192 | ||
| WBC count (x103/uL [ND5]) | 7.0 +/−2.2 | 6.9 +/−2.1 | 0.6 | 6.2 +/−1.5 | 6.6 +/−1.9 | 0.005 |
| Fibrinogen (mg/dl) | 300.0 (225.0, 340.0) | 300.0 (240.0, 360.0) | 0.4 | 250.0 (210.0, 300.0) | 280.0 (240.0, 350.0) | <0.001 |
| Having ever been pregnant | -- | 70 (67.3) | -- | 74 (34.9) | ||
| No. with data | 104 | 212 | ||||
| Hormone use | -- | 7 (6.4) | -- | 16 (7.4) | ||
Note: Continuous data are mean (SD) or median (25th, 75th percentile); categorical data are number (percent). Conversion factors for units: cholesterol in mg/dL to mmol/L, x0.02586; SCr in md/dL to mol/L, x88.4; fibrinogen in mg/dL to μmol/L, x0.0294, eGFR in ml/min/1.73m2 to ml/s/1.73 m2, x0.01667; no conversion necessary for WBC count in 10^3/uL and 10^9/L.
defined as eGFR ≥130 ml/min/1.73 m2 among individuals with baseline eGFR ≥60 ml/min/1.73 m2.
by CKD-EPI equation
eGFR, estimated glomerular filtration rate; HDL, high-density lipoprotein; SCr, serum creatinine, ACEi, angiotensin converting enzyme inhibitor; ARB, angiotensin receptor blocker; BP, blood pressure; WBC, white blood cell; HbA1c, glycosylated hemoglobin
The overall incidence rate for ESRD was 7.3 per 1,000 years’ exposure to diabetes, while the estimated cumulative ESRD incidence rates for the first 30 years of exposure to diabetes (allowing comparison by years of diabetes onset) were 10.6 and 6.3 per 1,000 years exposure for those diagnosed with diabetes during 1950–64 and 1965–80, respectively. Table 2 presents the cumulative incidence of macroalbuminuria and ESRD for individuals diagnosed prior to or after 1965 at 20, 25 and 30 years of diabetes duration. Significant effect modification was noted between sex and diagnosis cohort for both macroalbuminuria and ESRD incidence by 25 and 30 years of diabetes duration. Thus, the clear male preponderance among advanced cases of diabetic kidney disease observed in the earlier cohort (individuals with a diagnosis of type 1 diabetes prior to 1965) appears to have been eliminated in the younger cohort (individuals diagnosed at or after 1965). A graphic representation of ESRD incidence in men and women by diabetes duration and diagnosis year is given in Figure 1. Figure 1 also shows that although rates of ESRD appeared markedly lower in the most recently diagnosed compared to the earlier cohort for men, lesser and statistically non-significant declines were observed in women. Figure 2 presents the unadjusted ESRD-free survival curves by sex and diabetes duration for individuals diagnosed with type 1 diabetes prior to or after 1965. Results once again suggested that although female participants were less likely to develop ESRD disease among those diagnosed with type 1 diabetes prior to 1965 (HR, 0.59; 95% CI, 0.42–0.83; p-value = 0.003), this female protection was lost among individuals with a type 1 diabetes diagnosis at or after 1965 (HR, 1.48; 95% CI, 0.87–2.51; p-value = 0.1 [ND3]). When analyzed by sex, survival appeared to have dramatically improved among men in the younger cohort (HR, 0.28; 95% CI, 0.18–0.45; p-value < 0.001), but not among women (HR, 0.72; 95% CI, 0.45–1.14; p-value = 0.2). A greater cumulative incidence of the combined outcome of ESRD or death was also observed among men compared to women in the earlier cohort and approached significance after 30 years of diabetes duration (52.1% and 42.3% in men and women, respectively, p=0.06). In the younger cohort, however, the cumulative incidence of this combined outcome did not differ by sex (Figure 3).
Table 2.
Cumulative incidence of kidney disease by diabetes diagnosis year
| Diagnosed between 1950–1964 | Diagnosed between 1965–1980 | p for interaction* | |||||
|---|---|---|---|---|---|---|---|
| Men | Women | p-value | Men | Women | p-value | ||
| Macroalbuminuria | |||||||
| 20 y of T1DM | 0 (0.0) | 0 (0.0) | -- | 46 (25.8)† | 59 (32.6)† | 0.2 | -- |
| 25 y of T1DM | 28 (30.1) | 16 (18.0) | 0.06 | 55 (34.4) | 62 (38.0)† | 0.5 | 0.05 |
| 30 y of T1DM | 52 (56.5) | 29 (32.9) | 0.001 | 61 (46.2) | 64 (45.1) | 0.9 | 0.02 |
| ESRD | |||||||
| 20 y of T1DM | 25 (14.5) | 14 (9.5) | 0.2 | 11 (4.6)† | 14 (5.4) | 0.7 | 0.2 |
| 25 y of T1DM | 49 (30.6) | 25 (18.0) | 0.01 | 15 (7.6)† | 29 (13.8) | 0.04 | 0.002 |
| 30 y of T1DM | 66 (43.4) | 31 (24.6) | 0.001 | 20 (13.7)† | 32 (21.0) | 0.09 | <0.001 |
Note: diagnosis data shown as number (percent).
p-value for interaction between sex and diagnosis cohort (1950–64 versus 1965–80)
Significantly different from the cumulative incidence of those diagnosed prior to 1965 at α = 0.05
Abbreviation: ESRD, end-stage renal disease; T1DM, type 1 diabetes mellitus
Figure 1.

End-stage renal disease incidence in men and women by diabetes duration and diabetes diagnosis year. Differences in ESRD incidence for men and women between diagnosis cohorts were: Men: 20 yrs duration, p<0.001; 25 yrs duration, p<0.001; 30 yrs duration, p<0.001. Women: 20 yrs duration, p=0.1; 25 yrs duration, p=0.3; 30 yrs duration, p=0.5.[ND7]
Figure 2.
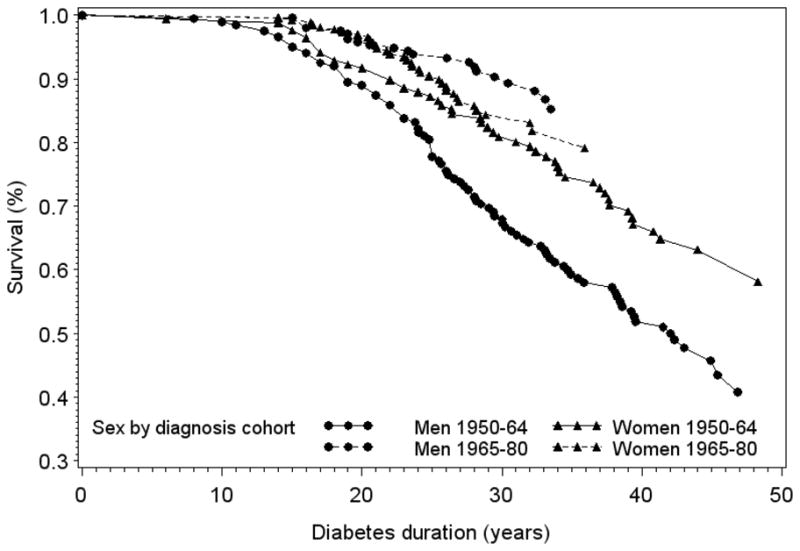
Cumulative survival free of end-stage renal disease by sex and diabetes diagnosis cohort during 18 years of follow-up in the EDC study
Figure 3.

Cumulative survival free of the combined outcome of end-stage renal disease or death by sex and diabetes diagnosis cohort during 18 years of follow-up in the EDC study
A diabetes diagnosis at or after 10 years of age was associated with the overall incidence of ESRD (p=0.009), although this relationship retained significance only among women (p=0.01) and the younger diagnosis cohort (p<0.001). To distinguish the effect of diagnosis cohort from a potential effect of age at diabetes onset, we also constructed ESRD survival curves for men and women stratifying the sample by diagnosis cohort and age at onset (not shown). Women appeared less likely to develop ESRD among the early diagnosis cohort regardless of age at diabetes diagnosis (HRs of 0.55 [95% CI, 0.35–0.85; p-value = 0.007] and 0.68 [95% CI, 0.38–1.19; p-value = 0.2] for age at onset 0–9 and ≥10 years, respectively), a protection that was completely lost in the most recent diagnosis cohort, whether the diagnosis of diabetes was made before or after a participant’s tenth birthday (HRs of 1.38 [95% CI, 0.58–3.27; p-value = 0.5] and 1.44 [95% CI, 0.74–2.81, p-value = 0.3] for age at onset 0–9 and ≥10 years, respectively).
We further investigated whether the relationship between risk factors and ESRD incidence differed by diagnosis cohort in men and women with type 1 diabetes, restricting analyses to the examined cohort. Indeed, although many of the risk factors evaluated related similarly to kidney disease incidence regardless of diagnosis cohort, others differed. Thus, among female participants in the later diagnosis cohort, HbA1c was higher in incident cases compared to non-cases, a difference that was not apparent in the earlier diagnosis cohort (Table S1, available as online supplementary material). Similar analyses conducted in men showed more striking hypertension and low HDL cholesterol differences in cases compared to non-cases in the earlier diagnosis cohort only (Table S2). Conversely, men who subsequently developed ESRD were more likely to have ever smoked and have a higher pulse compared to non-cases only within the younger diagnosis cohort.
We subsequently examined the effect of sex by diagnosis cohort using a left truncated Cox proportional hazards model that included an interaction term (sex*diagnosis cohort, p=0.03) in addition to the lower order terms. Adjustment for risk factors (with the exception of eGFR and albumin excretion rate) did not alter the significance of the interaction term (Table 3). We further examined whether the effect of diagnosis year could be explained by adjusting for ESRD risk factors in men and women with type 1 diabetes (Table 4). Due to the small number of cases, models were built allowing for up to four risk factors of interest, whereas the final model (Model 5) comprised statistically significant variables from Models 1 through 4. Differences in modifiable risk factors pushed the hazard ratio for diagnosis cohort closer to the null among men. In contrast, adjusting for differences in risk factor levels among women strengthened the increased risk of ESRD in the younger compared to the earlier diagnosis cohort.
Table 3.
Left truncated Cox proportional hazards models for the prediction of ESRD
| Baseline characteristics | Model 1 | Model 2 | Model 3 | Model 4 |
|---|---|---|---|---|
| Women | 0.61 (0.34–1.10) | 0.54 (0.30–0.98) | 0.68 (0.37–1.21) | 1.01 (0.54–1.89) |
| Diagnosed between 1965 and 1980 | 0.62 (0.30–1.27) | 0.59 (0.29–1.21) | 0.93 (0.45–1.92) | 1.17 (0.56–2.44) |
| Sex × diagnosis cohort | 2.76 (1.09–6.98) | 3.14 (1.24–7.98) | 2.99 (1.17–7.62) | 2.98 (1.16–7.64) |
| Age at diabetes onset (/1yr) | NS | NS | NS | NS |
| Ever smoked | NS | NA | NA | NA |
| HbA1c (/1%) | NA | 1.30 (1.14–1.49) | 1.37 (1.20–1.57) | 1.24 (1.07–1.45) |
| Insulin dose/weight | NA | 0.37 (0.13–1.11) | 0.38 (0.13–1.09) | 0.20 (0.06–0.61)) |
| Hypertension | NA | NA | 6.13 (3.82–9.83) | 5.02 (3.11–8.12) |
| HDL cholesterol (/1 mg/dL) | NA | NA | NA | 0.97 (0.95–0.99) |
| Non-HDL cholesterol (/1 mg/dL) | NA | NA | NA | 1.01 (1.006–1.015) |
| AIC | 870.500 | 855.674 | 804.990 | 781.324 |
Note: n=574; 78 events. Values in parentheses are 95% confidence intervals.[ND6]
Model 1 allowed for sex, diagnosis cohort, an interaction term between sex and diagnosis cohort, age at diabetes onset, and having ever smoked.
Model 2 allowed for sex, diagnosis cohort, an interaction term between sex and diagnosis cohort, age at diabetes onset, HbA1c and insulin dose/weight.
Model 3 allowed for sex, diagnosis cohort, an interaction term between sex and diagnosis cohort, age at diabetes onset, HbA1c, insulin dose/weight and hypertension.
Model 4 allowed for sex, diagnosis cohort, an interaction term between sex and diagnosis cohort, age at diabetes onset, HbA1c, insulin dose/weight, hypertension, HDL and non-HDL cholesterol.
AIC, Akaike information criterion; ESRD, end-stage renal disease; HDL, high-density lipoprotein; HbA1c, glycosylated hemoglobin; NA: Not made available; NS: Not selected.
Table 4.
Left truncated Cox proportional hazards models for the prediction of ESRD by sex
| Baseline characteristics | Model 1 | Model 2 | Model 3 | Model 4 | Model 5 |
|---|---|---|---|---|---|
| Men (n=283; 40 events) | |||||
| T1DM diagnosis in 1965–1980 | 0.68 (0.32–1.45) | 0.62 (0.29–1.32) | 0.97 (0.45–2.09) | 0.95 (0.44–2.06) | 1.07 (0.49–2.31) |
| Age at diabetes onset (/1yr) | NS | NS | NS | NS | NA |
| Ever smoked | NS | NA | NA | NA | NA |
| HbA1c (/1%) | NA | 1.39 (1.17–1.66) | NA | NA | 1.37 (1.11–1.70) |
| Insulin dose/weight | NA | NS | NA | NA | NA |
| Hypertension | NA | NA | 4.46 (2.34–8.47) | NA | 4.52 (2.35–8.67) |
| HDL cholesterol (/1mg/dL) | NA | NA | NA | NS | NA |
| Non-HDL cholesterol (/1mg/dL) | NA | NA | NA | 1.013 (1.01–1.02) | 1.01 (1.004–1.02) |
| AIC | 379.959 | 369.759 | 361.717 | 360.683 | 339.987 |
| Women (n=291; 38 events) | |||||
| T1DM diagnosis in 1965–1980 | 1.50 (0.72–3.10) | 1.76 (0.83–3.71) | 2.27 (1.05–4.89) | 1.61 (0.77–3.37) | 2.36 (1.11–5.02) |
| Age at diabetes onset (/1yr) | NS | NS | 1.08 (0.99–1.17) | 1.09 (1.00–1.19) | 1.10 (1.01–1.21) |
| Ever smoked | NS | NA | NA | NA | NA |
| HbA1c (/1%) | NA | 1.21 (0.99–1.48) | NA | NA | NA |
| Insulin dose/weight | NA | 0.22 (0.04–1.14) | NA | NA | NA |
| Hypertension | NA | NA | 6.88 (3.51–13.49) | NA | 5.22 (2.61–10.45) |
| HDL cholesterol (/1mg/dL) | NA | NA | NA | 0.97 (0.94–1.00) | NA |
| Non-HDL cholesterol (/1mg/dL) | NA | NA | NA | 1.015 (1.01–1.02) | 1.013 (1.01–1.02) |
| AIC | 383.044 | 379.361 | 356.462 | 363.196 | 346.821 |
Note. NA: Not made available; NS: Not selected.
Model 1 allowed for sex, age at diabetes onset, and having ever smoked.
Model 2 allowed for sex, age at diabetes onset, HbA1c and insulin dose/weight. Model 3 allowed for sex, age at diabetes onset, and hypertension. Model 4 allowed for sex, age at diabetes onset, HDL and non-HDL cholesterol. Model 5 allowed for statistically significant variables in Models 1–4.
AIC, Akaike information criterion; ESRD, end-stage renal disease; HDL, high-density lipoprotein; HbA1c, glycosylated hemoglobin; T1DM, type 1 diabetes mellitus
Discussion
These data suggest that the male preponderance among advanced cases of diabetic kidney disease observed in those diagnosed with type 1 diabetes prior to 1965 has been eliminated in the more recently diagnosed cohort (1965–1980), a finding that does not appear to have arisen due to a competing mortality risk. Moreover, although there were no significant differences in the cumulative incidence of macroalbuminuria by diagnosis cohort in men, rates were increased within the younger compared to the earlier cohort among women. Furthermore, the dramatic declines in the cumulative incidence of ESRD observed in the later compared to the earlier diagnosis cohort among men were not paralleled in women, where decreases in incidence rates were not as striking.
The excess risk of ESRD in men within the earlier cohort was partly explained by differences in HbA1c, hypertension, and lipid levels between the sexes. While the improved management of these risk factors might be expected to account for the loss of the male predominance among cases of kidney disease in the most recent cohort, the relatively steady rates of the cumulative incidence of macroalbuminuria among men may suggest that such risk factor management is either not adequate to prevent the initiation of macroalbuminuria or that it is adopted after its onset.
Surprisingly, the slight excess of female ESRD cases among individuals diagnosed with type 1 diabetes after 1965 could not be explained by differences in modifiable risk factors. Rather, such adjustments produced over a twofold increased risk in women compared to men. It is possible, that as diabetes diminishes the advantage women have relative to men under normoglycemia for vascular complications, adjustment for differences in risk factors merely reveals the true excess risk in women. Indeed, Cherney et al. (26) demonstrated that during clamped hyperglycemia, female adolescents with type 1 diabetes exhibited reductions in effective renal plasma flow and renal blood flow and increases in renal vascular resistance and filtration fraction, evidence of which was not seen in males. Providing treatment with ACE inhibitors produced declines in arterial pressure in both sexes in this study, however, females displayed a reduction in glomerular filtration rate as well as filtration fraction. Thus, even among adolescents with uncomplicated type 1 diabetes, there is evidence of a differing renal response to both hyperglycemia and ACE inhibition by sex. Nevertheless, as the number of ESRD cases in our cohort with a diabetes diagnosis after 1965 was quite small, further follow-up would be required to determine whether this increased risk in women persists. It is also of interest that unlike in men, the effect of diagnosis cohort among women was only strengthened after adjustments for modifiable risk factors. The observation of essentially unaltered incidence rates among women of a much younger age and with a much shorter duration of type 1 diabetes compared to those belonging in the older diagnosis cohort is alarming. Thus, although a longer follow-up would be required for a better assessment of differences in rates with longer diabetes durations by diagnosis cohort, it may be essential to suggest more aggressive risk factor management of women with type 1 diabetes to avoid the early presentation of advanced kidney complications.
The 10-year risk of kidney insufficiency was also not significantly different by sex among participants of the WESDR study after adjustment for risk factors (13). Recently published reports from Europe also suggest that the previously observed protection female sex conferred against the development of diabetic kidney disease may no longer persist. Indeed, a study based on the Finnish Diabetes Register reported [ND4] that the cumulative incidence of ESRD was 2.1% (95% CI, 1.7%–2.5%) and 8.3% (95% CI, 7.3%–9.3%) for males and 2.2% (95% CI, 1.7%–2.6%) and 7.8% (95% CI, 6.7%–8.8%) for females after 20 and 30 years of follow-up, respectively, and sex was not associated with risk of developing ESRD in multivariable analyses (7). Researchers from Sweden also observed no difference in the cumulative incidence of ESRD by sex among those diagnosed with type 1 diabetes before the age of 20 years (6). However, in this second study, an increased risk of disease was associated with male sex among individuals with adult onset type 1 diabetes, a finding that was not altered when taking death into account as a competing risk. The Pittsburgh Epidemiology of Diabetes study was based on individuals with childhood onset type 1 diabetes, diagnosed prior to 17 years of age. Thus, we could not replicate analyses of differences in disease rates between childhood onset and adult onset diabetes. However, age at diabetes onset did not appear to modify findings by diagnosis cohort, although being diagnosed with type 1 diabetes after 10 years of age increased ESRD risk, a relationship that was stronger among women and within the younger diagnosis cohort.
Finally, our findings must be considered in context with the weaknesses present in the data analyzed. Indeed, despite this cohort having been previously shown to be representative of the type 1 diabetes population of the Allegheny County, Pennsylvania, a limitation of this research study is that participants were not followed from the onset of type 1 diabetes but had already had diabetes for approximately 19 years upon study initiation. Thus, although an effort was made to include individuals who died prior to the examination conducted at study entry to address potential survival bias, it was not possible in this study to capture the very early cases of ESRD. However, as has been previously reported (6, 7, 27), incidence of kidney failure prior to 20 years of diabetes duration is especially low and it is unlikely that very many early cases of advanced kidney disease were missed. A further limitation is the lack of risk factor data from the time of diagnosis of type 1 diabetes, as well as the small number of cases in analyses stratified by diagnosis year, especially in the younger cohort.
Nevertheless, these data suggest that uncontrolled risk factors may account for the excess risk of advanced kidney disease among men that has been previously reported in cohorts of individuals with type 1 diabetes and which appears to have been eliminated in the younger diagnosis cohort in this study. Further follow-up is required to verify these findings and to investigate their origins.
Supplementary Material
Table S1: Baseline differences in risk factors by ESRD incidence within diabetes diagnosis cohort in women.
Table S2: Baseline differences in risk factors by ESRD incidence within diabetes diagnosis cohort in men.
Acknowledgments
We are indebted to the participants of the EDC study who have tirelessly volunteered their time for more than 20 years.
Support: This research was supported by NIH grant DK34818.
Footnotes
Financial Disclosure: The authors do not have conflicts of interest related to this research
Publisher's Disclaimer: This is a PDF file of an unedited manuscript that has been accepted for publication. As a service to our customers we are providing this early version of the manuscript. The manuscript will undergo copyediting, typesetting, and review of the resulting proof before it is published in its final citable form. Please note that during the production process errors may be discovered which could affect the content, and all legal disclaimers that apply to the journal pertain.
References
- 1.Cusick M, Chew EY, Hoogwerf B, et al. the Early Treatment Diabetic Retinopathy Study Research Group. Risk factors for renal replacement therapy in the Early Treatment Diabetic Retinopathy Study (ETDRS), Early Treatment Diabetic Retinopathy Study Report No. 26. Kidney Int. 2004;66(3):1173–1179. doi: 10.1111/j.1523-1755.2004.00869.x. [DOI] [PubMed] [Google Scholar]
- 2.Shankar A, Klein R, Klein BE, Moss SE. Association between glycosylated hemoglobin level and 16-year incidence of chronic kidney disease in type 1 diabetes. Exp Clin Endocrinol Diabetes. 2007;115(3):203–206. doi: 10.1055/s-2007-956170. [DOI] [PubMed] [Google Scholar]
- 3.Saraheimo M, Forsblom C, Thorn L, et al. FinnDiane Study Group. Serum adiponectin and progression of diabetic nephropathy in patients with type 1 diabetes. Diabetes Care. 2008;31(6):1165–1169. doi: 10.2337/dc07-2306. [DOI] [PubMed] [Google Scholar]
- 4.Tolonen N, Forsblom C, Thorn L, et al. FinnDiane Study Group. Lipid abnormalities predict progression of renal disease in patients with type 1 diabetes. Diabetologia. 2009;52(12):2522–2530. doi: 10.1007/s00125-009-1541-2. [DOI] [PubMed] [Google Scholar]
- 5.Svensson M, Nyström L, Schön S, Dahlquist G. Age at onset of childhood-onset type 1 diabetes and the development of end-stage renal disease: a nationwide population-based study. Diabetes Care. 2006;29(3):538–542. doi: 10.2337/diacare.29.03.06.dc05-1531. [DOI] [PubMed] [Google Scholar]
- 6.Möllsten A, Svensson M, Waernbaum I, et al. for the Swedish Childhood Diabetes Study Group, the Diabetes Incidence Study in Sweden, and the Swedish Renal Registry. Cumulative risk, age at onset, and sex-specific differences for developing end-stage renal disease in young patients with type 1 diabetes. Diabetes. 2010;59(7):1803–1808. doi: 10.2337/db09-1744. [DOI] [PMC free article] [PubMed] [Google Scholar]
- 7.Finne P, Reunanen A, Stenman S, Groop P-H, Grönhagen-Riska G. Incidence of end-stage renal disease in patients with type 1 diabetes. JAMA. 2005;294(14):1782–1787. doi: 10.1001/jama.294.14.1782. [DOI] [PubMed] [Google Scholar]
- 8.Orchard TJ, Dorman JS, Maser RE, et al. Prevalence of complications of IDDM by sex and duration. Pittsburgh Epidemiology of Diabetes Complications Study II. Diabetes. 1990;39(9):1116–1124. doi: 10.2337/diab.39.9.1116. [DOI] [PubMed] [Google Scholar]
- 9.Krolewski AS, Warram JH, Christlieb AR, Busick EJ, Kahn CR. The changing natural history of nephropathy in type I diabetes. Am J Med. 1985;78(5):785–94. doi: 10.1016/0002-9343(85)90284-0. [DOI] [PubMed] [Google Scholar]
- 10.Klein R, Klein BEK, Moss SE, Davis MD, Demets DL. The Wisconsin Epidemiologic Study of Diabetic Retinopathy. V. Proteinuria and retinopathy in a population of diabetic persons diagnosed prior to 30 years of age. In: Friedman EA, L’Esperance FA, editors. Diabetic Renal-Retinal Syndrome. Vol. 3. New York, NY: Grune & Stratton; 1986. pp. 245–264. [Google Scholar]
- 11.Cowie CC, Port FK, Wolfe RA, Savage PJ, Moll PP, Hawthorne VM. Disparities in incidence of diabetic end-stage renal disease according to race and type of diabetes. N Engl J Med. 1989;321(16):1074–1079. doi: 10.1056/NEJM198910193211603. [DOI] [PubMed] [Google Scholar]
- 12.Jacobsen P, Rossing K, Tarnow L, et al. Progression of diabetic nephropathy in normotensive type 1 diabetic patients. Kidney Int. 1999;71 (Suppl 56):S101–S105. doi: 10.1046/j.1523-1755.1999.07125.x. [DOI] [PubMed] [Google Scholar]
- 13.Klein R, Klein BE, Moss SE, Cruickshanks KJ, Brazy PC. The 10-year incidence of renal insufficiency in people with type 1 diabetes. Diabetes Care. 1999;22(5):743–751. doi: 10.2337/diacare.22.5.743. [DOI] [PubMed] [Google Scholar]
- 14.Wagener DK, Sacks JM, LaPorte RE, MacGregor JM. The Pittsburgh Study of insulin-dependent diabetes mellitus: risk for diabetes among relatives of IDDM. Diabetes. 1982;31(2):136–144. doi: 10.2337/diab.31.2.136. [DOI] [PubMed] [Google Scholar]
- 15.Borhani NO, Kass EH, Langford HGGH, Remington RD, Stamler J. The hypertension detection and follow-up program. Prev Med. 1976;5(2):207–215. doi: 10.1016/0091-7435(76)90039-6. [DOI] [PubMed] [Google Scholar]
- 16.Warnick GR, Albers JJ. Heparin-Mn2+ quantitaion of high density lipoprotein cholesterol: an ultrafiltration procedure for lipemic samples. Clin Chem. 1978;24(6):900–904. [PubMed] [Google Scholar]
- 17.National Institutes of Health and Dept. of Health. Lipid Research Clinics Program. Washington, DC: US Government Printing Office; 1975. [Google Scholar]
- 18.Allain CC, Poon LS, Chan CSG, Richmond W, Fu PC. Enzymatic determination of total serum cholesterol. Clin Chem. 1974;20(4):470–475. [PubMed] [Google Scholar]
- 19.Bucolo G, David H. Quantitative determination of serum triglycerides by the use of enzymes. Clin Chem. 1973;19(5):476–482. [PubMed] [Google Scholar]
- 20.Ellis D, Buffone GJ. A new approach to the evaluation of proteinuric states. Clin Chem. 1977;23(4):666–670. [PubMed] [Google Scholar]
- 21.Ellis D, Coonrod BA, Dorman JS, et al. Choice of urine sample predictive of microalbuminuria in patients with insulin-dependent diabetes mellitus. Am J Kidney Dis. 1989;13(4):321–328. doi: 10.1016/s0272-6386(89)80039-3. [DOI] [PubMed] [Google Scholar]
- 22.Assadi FK, John EG, Fornell L, Rosenthal IM. Falsely elevated serum creatinine concentration in ketoacidosis. J Pediatr. 1985;107(4):562–564. doi: 10.1016/s0022-3476(85)80021-4. [DOI] [PubMed] [Google Scholar]
- 23.Levey AS, Stevens LA, Schmid CH, et al. CKD-EPI (Chronic Kidney Disease Epidemiology Collaboration) A new equation to estimate glomerular filtration rate. Ann Intern Med. 2009;150(9):604–612. doi: 10.7326/0003-4819-150-9-200905050-00006. [DOI] [PMC free article] [PubMed] [Google Scholar]
- 24.Cockcroft D, Gault M. Prediction of creatinine clearance from serum creatinine. Nephron. 1976;16(1):31–41. doi: 10.1159/000180580. [DOI] [PubMed] [Google Scholar]
- 25.Levey AS, Coresh J, Greene T, et al. Chronic Kidney Disease Epidemiology Collaboration. Using standardized serum creatinine values in the modification of diet in renal disease study equation for estimating glomerular filtration rate. Ann Intern Med. 2006;145(4):247–254. doi: 10.7326/0003-4819-145-4-200608150-00004. [DOI] [PubMed] [Google Scholar]
- 26.Cherney DZI, Sochett EB, Miller JA. Gender differences in renal responses to hyperglycemia and angiotensin-converting enzyme inhibition in diabetes. Kidney Int. 2005;68(4):1722–1728. doi: 10.1111/j.1523-1755.2005.00588.x. [DOI] [PubMed] [Google Scholar]
- 27.Raile K, Galler A, Hofer S, et al. Diabetic nephropathy in 27,805 children, adolescents and adults with type 1 diabetes: effect of diabetes duration, HbA1c, hypertension, dyslipidemia, diabetes onset and gender. Diabetes Care. 2007;30(10):2523–2528. doi: 10.2337/dc07-0282. [DOI] [PubMed] [Google Scholar]
Associated Data
This section collects any data citations, data availability statements, or supplementary materials included in this article.
Supplementary Materials
Table S1: Baseline differences in risk factors by ESRD incidence within diabetes diagnosis cohort in women.
Table S2: Baseline differences in risk factors by ESRD incidence within diabetes diagnosis cohort in men.