Abstract
Two genes (MAT1A and MAT2A) encode for the essential enzyme methionine adenosyltransferase (MAT). MAT1A is silenced in hepatocellular carcinoma (HCC), and absence of MAT1A leads to spontaneous development of HCC in mice. Previous report correlated promoter methylation to silencing of MAT1A but definitive proof was lacking. Here we investigated the role of methylation in regulating MAT1A expression. There are three MspI/HpaII sites from −1913 to +160 of the human MAT1A gene (numbered relative to the translational start site) at position −977, +10, and +88. Bisulfite treatment and DNA sequencing, and Southern blot analysis showed that methylation at +10 and +88, but not −977, correlated with lack of MAT1A expression. MAT1A promoter construct methylated at −977, +10 or +88 position has 0.7-fold, 3-fold, and 1.6-fold lower promoter activity, respectively. Methylation at −977 and +10 did not inhibit the promoter more than methylation at +10 alone; while methylation at +10 and +88 reduced promoter activity by 60%. Mutation of +10 and +88 sites also resulted in 40% reduction of promoter activity. Reactivation of MAT1A correlated with demethylation of +10 and +88. In vitro transcription assay showed that methylation or mutation of +10 and +88 sites reduced transcription. In conclusion, our data support the novel finding that methylation of the MAT1A coding region can inhibit gene transcription. This represents a key mechanism for decreased MAT1A expression in HCC and a target for therapy. To our knowledge, this is the first example of coding region methylation inhibiting transcription of a mammalian gene.
Keywords: methionine adenosyltransferase 1A, hepatocellular carcinoma, coding region methylation, in vitro transcription
INTRODUCTION
Methionine adenosyltransferase (MAT) is an essential cellular enzyme that catalyzes the formation of S-adenosylmethionine (AdoMet, also known as SAM and SAMe), the principal biological methyl donor and the ultimate source of the propylamine moiety used in polyamine biosynthesis (Mato et al., 1997; Finkelstein 1990). In mammals, two different genes, MAT1A and MAT2A, encode for two homologous MAT catalytic subunits, α1 and α2 (Horikawa and Tsukada, 1992; Alvarez et al., 1993; Kotb et al., 1997). MAT1A is expressed mostly in liver and it encodes the α1 subunit found in two native MAT isozymes, which are either a dimer (MAT III) or tetramer (MAT I) of this single subunit (Kotb et al., 1997). MAT2A encodes for a catalytic subunit (α2) found in a native MAT isozyme (MAT II), which is associated with a catalytically inactive regulatory subunit (β) in lymphocytes encoded by MAT2B (Kotb et al., 1997; Halim et al., 1999). MAT2A is widely distributed (Horikawa and Tsukada, 1992; Alvarez et al., 1993; Kotb et al., 1997). MAT2A also predominates in the fetal liver and is progressively replaced by MAT1A during liver development (Horikawa et al., 1993; Gil et al., 1996). In adult liver, a switch in MAT expression occurs when the liver undergoes rapid growth or de-differentiation (Cai et al., 1996; Huang et al., 1998, 1999). In human hepatocellular carcinoma (HCC), MAT1A is transcriptionally silenced while MAT2A is induced (Cai et al., 1996). This switch in MAT gene expression plays an important pathogenetic role as MAT2A expression facilitates cancer cell growth (Cai et al., 1998). The influence of MAT expression on liver growth and injury was further demonstrated using a MAT1A knockout mouse model (Lu et al., 2001; Martínez-Chantar et al., 2002). In this model, absence of hepatic MAT1A is compensated by induction of MAT2A. These animals exhibit chronic hepatic AdoMet deficiency, are prone to liver injury and develop spontaneous HCC (Lu et al., 2001; Martínez-Chantar et al., 2002).
Given the importance of MAT expression in liver disease and cancer, we have been interested in understanding transcriptional regulation of MAT genes. We characterized the promoter region of both human MAT genes (Mao et al., 1998; Zeng et al., 2000) and showed previously that MAT1A expression is regulated by histone acetylation and methylation (Torres et al., 2000). Specifically, MAT1A gene expression in HepG2 cells can be induced by treatment with a demethylating agent or inhibitor of histone deacetylase (Torres et al., 2000). Furthermore, in HepG2 cells and in human cirrhotic livers, decreased MAT1A expression is associated with hypermethylation of a HpaII site at −977 position of the MAT1A promoter (Torres et al., 2000; Avila et al., 2000). However, these studies did not demonstrate directly that methylation at the −977 site of MAT1A can influence gene transcription. The aim of the current study was to examine the functional relationship between MAT1A gene methylation and expression. In the course of these studies, we have uncovered a highly novel finding, namely the ability of methylation of the coding region to influence the transcriptional activity of MAT1A. To our knowledge, this is the first example of coding region methylation affecting transcriptional activity of a mammalian gene.
MATERIALS AND METHODS
Materials
Cell culture media were purchased from Invitrogen (Carlsbad, CA). Fetal bovine serum was purchased from Atlas Biologicals (Fort Collins, CO). The Luciferase Assay System and the β-Galactosidase Enzyme Assay System were obtained from Promega (Madison, WI). All restriction enzymes and methylases were purchased from New England Biolabs (Beverly, MA) and Invitrogen. [α-32P] dCTP (10 μCi/μl) was purchased from Perkin Elmer (Wellesley, MA). pGL3-enhancer and pcDNA 3.1 vectors were purchased from Promega and Invitrogen, respectively. All other reagents were of analytical grade and were purchased from commercial sources.
Source of Normal and Cancerous Liver Tissue
Normal liver tissue was obtained from normal liver included in the resected liver specimens of patients with metastatic colon or breast carcinoma. Cancerous liver tissue was obtained from patients undergoing surgical resection for primary HCC. Written informed consent was obtained from each patient. The contamination of HCC samples with noncancerous tissue was less than 5% as determined by histopathology. These tissues were immediately frozen in liquid nitrogen for subsequent isolation of RNA, DNA, or nuclear proteins as described below.
The study protocol conformed to the ethical guidelines of the 1975 Declaration of Helsinki as reflected in a priori approval by Keck School of Medicine University of Southern California’s human research review committee.
Cell Culture
Primary cultures of human hepatocytes, Huh-7, HEK293, and HepG2 cells were obtained from the Cell Culture Core of the USC Liver Disease Research Center and grown according to instructions provided by the American Type Culture Collection (Rockville, MD) or as we previously described (Cai et al., 1996). Primary cultures of human hepatocytes were also obtained from CellzDirect (CellzDirect, Inc., Tucson, Az).
Nucleic Acids Extraction
RNA was isolated from frozen liver specimens, Huh-7, and HEK293 cells according to the method of Chomczynski and Sacchi (1987). Genomic DNA was isolated from frozen human liver specimens, primary cultures of human hepatocytes, Huh-7, and HEK293 cells as we described previously (Cai et al., 1996) and used for Southern blot analysis and sodium bisulfite genomic DNA sequencing (see below).
Reverse Transcription-Polymerase Chain Reaction (RT-PCR)
Aliquots of 2μg total RNA were reverse transcribed using MMLV (Invitrogen, Carlsbad, CA) and DecaPrime II decamers (Ambion, Austin, TX) by a 1 h incubation at 42ºC followed by 10 min at 90ºC to stop the reaction. Multiplex PCR using previously described primers (Avila et al., 2000) designed to flank intronic sequences of MAT1A and yield a 167 bp product and Alternate 18S internal standards (Ambion) to simultaneously amplify MAT1A and an 18S internal control was performed using Platinum Pfx DNA polymerase (Invitrogen). The PCR reaction parameters included an initial 20 sec incubation at 95ºC, followed by 28 cycles of incubation at 94ºC for 1 min, 54ºC for 1 min, 72ºC for 1 min, and a final extension time of 3 min at 72ºC. PCR products were visualized by ethidium bromide staining under UV light on a 2% agarose gel.
Sodium Bisulfite Genomic DNA Sequencing
In order to compare the methylation status of 15 CG sites in human MAT1A promoter from −1902 to −25 between the genomic DNAs of normal liver and the genomic DNAs of liver cancer cells, bisulfite-mediated genomic DNA sequencing was performed following the procedure of Paulin et. al. (1998). Basically, 2 μg of normal human liver genomic DNAs or liver cancer cell line Huh-7 genomic DNAs were digested by restriction enzymes to release four small areas of genomic DNAs that span MAT1A promoter from −1686 to −1398, −1228 to −778, −792 to −454 and −392 to −84. There is no CG site from −1902 to −1686, −1398 to −1228, −454 to −392, nor −84 to −25. Digested genomic DNAs were denatured, modified by bisulfite, purified, and desulphonated. The top strand (for example, −1686 as 5′ and −1398 as 3′) DNA was PCR using four sets of primers that complement to the bisulfite-modified DNA fragments. The first set of primers were: for the upper strand, 5′-GGGTTAGTAATGTTGAAATAGTT (annealed to modified MAT1A promoter from −1686 to −1663); for the lower strand, 5′-TAACTAATAACCAAACATCATCC (−1420 to −1398). The second set primers were: forward, 5′-ATTTTTTATTGTATTTTAGTGGGAA (−1228 to −1204); reverse, 5′-CCTAACCTATCAACTTCTCTAAAAA (−802 to −778). The third set of primers were: forward, 5′-AGTTGATAGGTTAGGTGGTTTT (−792 to −771); reverse, 5′-TCCTTCAACTCTTAACCAATCTT (−476 to −454). The fourth set of primers were: forward, 5′-GGTGTTTAGAGTTTGGAAAGTT (−392 to −371); reverse, 5′-CTTCTTCTTCTTCTTTCAACC (−104 to −84). PCR reaction was set up as follows: forward primer (5 μM) 0.8 μl, reverse primer (5 μM) 0.8 μl, 4dNTPs (10 mM) 0.15 μl, bisulfite treated genomic DNAs (normal liver or Huh-7) (1 mg/ml) 1 μl, and water 7.55 μl. The mixture was placed in the PCR machine and heated to 95ºC for 5 min. 3.95 μl of Taq polymerase mixture containing 1.25 μl 10X Taq buffer and 0.15 μl Taq polymerase were mixed with the heated sample. The cycling condition was as follows: 94ºC, 40 sec, 55ºC, 45 sec, 72ºC, 50 sec for 40 cycles, 72ºC for 10 mins, then 4ºC for at least 10 mins. PCR products were cloned into TOPO TA vector (Invitrogen). As many as 12 positive colonies with the insert from each PCR reaction were sequenced using the automated ABI Prism dRhodamine Terminator Cycle Sequencer (Sequencing Core Facility, Norris Cancer Center, Keck School of Medicine USC).
In a separate experiment, bisulfite-mediated genomic DNA sequencing was performed using genomic DNA from primary cultures of human hepatocytes (to avoid contamination from non-hepatocytes) and Huh-7 cells to compare the methylation pattern from −61 to +251. Following bisulfite treatment as described above, DNA was PCR using the primer pair: forward 5′-GGTAAAGTTATAGTTTTAAAATTGTTT-3′ (−61 to −35) and reverse 5′-AATACTCATATTATAAATTACTAATTTAA-3′ (+223 to +251). The cycling condition was as follows: 95ºC for 3 min, 94ºC, 40 sec for 40 cycles, 57ºC for 50 sec, 72ºC for 1 min, 72 C for 2 min. PCR products were cloned into TOPO TA vector (Invitrogen). Sixteen positive colonies were sequenced using the automated LI-COR 4200 Sequencer (LI-COR, Inc., Lincoln, NE).
Restriction Enzyme Digestion and Southern Blot Analysis
MspI and HpaII restriction endonucleases were used as described (Yang et al., 2001). MspI and HpaII can distinguish between the unmethylated and methylated cytoine in the nucleotide sequence 5′-CCGG. MspI is insensitive to the methylation status whereas HpaII will digest only if the internal cytosine is unmethylated. Genomic DNA (30 μg) was completely digested with EcoRI only, EcoRI and MspI, or EcoRI and HpaII overnight at 37ºC. The digested DNAs were separated on 1% agarose gels, Southern transferred and hybridized with [α-32P]dCTP-labeled −1666 to −1515 fragment of the human MAT1A promoter [16]. Autoradiography was performed by exposure the membranes to Kodak BioMax MR film at −80ºC. Southern blot of genomic DNA digested with HindIII only, HindIII and MspI, or HindIII and HpaII was probed with fragment −612 to −134 of the human MAT1A promoter.
In Vitro Methylation Reactions
To examine the effect of CG methylation at the three HpaII sites (−977, +10, and +88) on MAT1A promoter activity, different regions of human MAT1A (−1111 to +30, −839 to +30, and −839 to +112) were PCR amplified and inserted between KpnI and XhoI sites of pGL3-enhancer vector to generate pGL3-1111/+30, pGL3-839/+30 and pGL3-839/+112. The human MAT1A promoter fragments were isolated by XhoI and KpnI double digestion and purified for methylation experiments. These fragments were either mock methylated (incubated with HpaII methylase in the absence of AdoMet), or methylated by HpaII methylase. The status of methylation was determined by digestion with HpaII restriction enzyme. Methylated and mock-methylated MAT1A promoter fragments were then ligated into XhoI and KpnI sites of pGL3-enhancer vector. The ligated pGL3-839/+30 plasmid (mock-methylated or HpaII methylated) was isolated from 1% agarose gel using Gel Purification Kit from Qiagen. The ligated pGL3-1111/+30 (mock-methylated or HpaII methylated) plasmids, and the ligated pGL3-839/+112 (mock-methylated or HpaII methylated) plasmids were also isolated and purified using the same protocol as described above for the ligated pGL3-839/+30 plasmid. Concentration of each purified ligated plasmid was measured by spectrophotometer to ensure equal amount of ligated DNA was used for cell transfection. This was further verified by electrophoresis on 1% agarose gel.
To examine the effect of each specific site, site-directed mutagenesis was performed with the Site-directed Mutagenesis kit from Stratagene (Cedar Creek, TX). Site-directed mutagenesis was carried out on pGL3-839/+112 to mutate +10 HpaII site, +88 HpaII site, or both. In every mutation, the 5′CCGG HpaII site was mutated to 5′CCAG. Each mutation was verified by sequencing using the automated ABI Prism dRhodamine Terminator Cycle Sequencer performed by the Sequencing Core Facility, Norris Cancer Center, Keck School of Medicine USC. The mutated MAT1A plasmids were subjected to the same methylation and ligation treatments as described above.
Transfection Assays
To study the effect of methylation on relative transcriptional activities of the MAT1A promoter fragments, HepG2 cells (5 × 10⁵ cells in 1 ml medium) were transiently transfected with 400–500 ng of unmethylated or methylated MAT1A promoter-pGL-3 enhancer constructs and 500 ng of a β-galactosidase expression plasmid (as an internal standard of transfection efficiency) using the Superfect Transfection Reagent (Qiagen, Valencia, CA) as we described (Yang et al., 2002). After 48 hours, cells were harvested and lysed in 100 μl of reporter lysis buffer (Luciferase Assay System, Promega). The luciferase activity was measured using a TD-20/20 Luminometer (Promega). The β-galactosidase assay was done according to the supplier’s instructions (β-Galactosidase Enzyme Assay System, Promega). The luciferase activity of each transfection was expressed as luciferase activity/β-galactosidase activity.
In vitro Transcription
RNA transcripts were synthesized in vitro with T7 RNA polymerase using the TranscriptAid™ T7 High Yield Transcription Kit (Fermentas, Glen Burnie, Maryland) from 1 μg templates consisting of the −839/+112 region of MAT1A promoter contained in pcDNA3.1 vector linearized with XhoI. RNA synthesized in vitro was digested with RNase-free DNase I, precipitated with isopropanol, washed in ethanol, and transcription reaction products were analyzed by gel electrophoresis.
Statistical Analysis
Data are given as mean±SEM. Statistical analysis was performed using ANOVA followed by Fisher’s test for multiple comparisons. Significance was defined by p<0.05.
RESULTS
MAT1A Expression and Bisulfite-Mediated Genomic DNA Sequencing
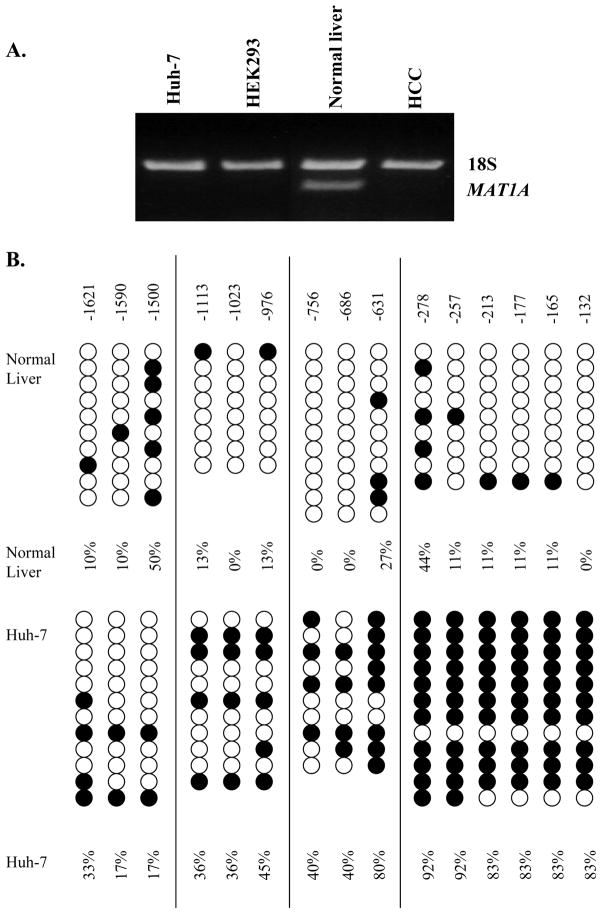
We first examined whether there is a correlation between MAT1A expression and the specific site of promoter methylation. RT-PCR indicates that while MAT1A is expressed in normal liver, it is not expressed in Huh-7 and 293 cells, or in HCC (Fig. 1A). Sodium bisulfite genomic sequencing was carried out to identify the site(s) of methylation. Figure 1B shows that there is an increase in overall methylation of the MAT1A promoter in Huh-7 cells, which do not express MAT1A. The five CpG sites within nucleotides −257 to −132 showed the most dramatic methylation increases in Huh-7 cells while the CpG sites more upstream showed less methylation differences to the normal liver control.
Fig 1.
A. MAT1A expression in Huh-7, HEK293 cells, normal liver and HCC. MAT1A expression was assessed by RT-PCR as described in Methods. B. Sodium bisulfite genomic DNA sequencing. Genomic DNA from normal liver and Huh-7 cells were extracted and subjected to bisulfite treatment and DNA sequencing as described in Methods. Cytosine residues are shown from −1621 to −132. Open circle is unmethylated and closed circle is methylated.
MAT1A Expression and Methylation at HpaII Sites
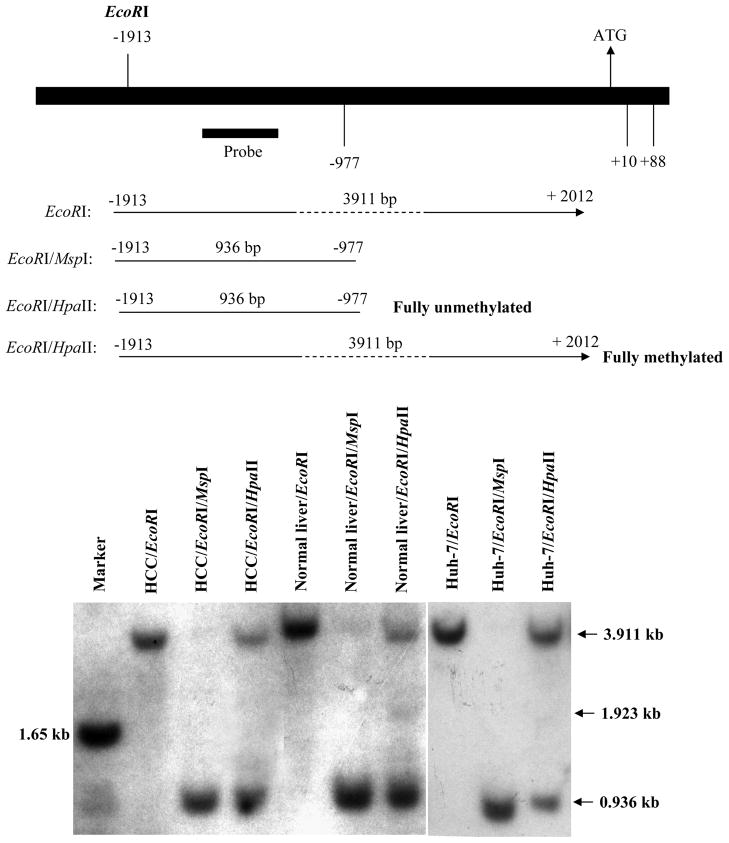
The HpaII site at −977 was previously reported to be methylated in cirrhotic liver specimens with decreased MAT1A expression (Avila et al., 2000). To further examine this site, Southern Blot Analysis was carried out in HCC, normal liver and Huh-7 cells. Figure 2 shows that the site at −977 is partially methylated in all three specimens. There is an additional band around 1.923 kb that is present only in normal liver DNA treated with EcoRI and HpaII. This suggests the HpaII site at +10 is partly unmethylated in normal liver but methylated in both HCC and Huh-7 cells.
Fig 2.
Methylation pattern at −977 and +10 sites of MAT1A in HCC, normal liver and Huh-7 cells. DNA from HCC, normal liver and Huh-7 cells were first digested with EcoRI, which cleaves at −1913 and +2012 of MAT1A as depicted on top. The DNA is then digested with MspI, which is insensitive to methylation of the internal cytosine residue of CCGG sequences, or HpaII, which is inhibited if the internal cytosine is methylated and Southern blot hybridization was performed using the labeled human MAT1A probe as shown on top. Note that digestion of all three samples with HpaII results in both a low molecular weight (0.936 kb) and a high molecular weight (3.911 kb) band, consistent with the site at −977 being partially methylated. In normal liver but not in HCC or Huh-7 cells, HpaII digestion also result in a band of about 1.923 kb, consistent with the notion that +10 is partially unmethylated.
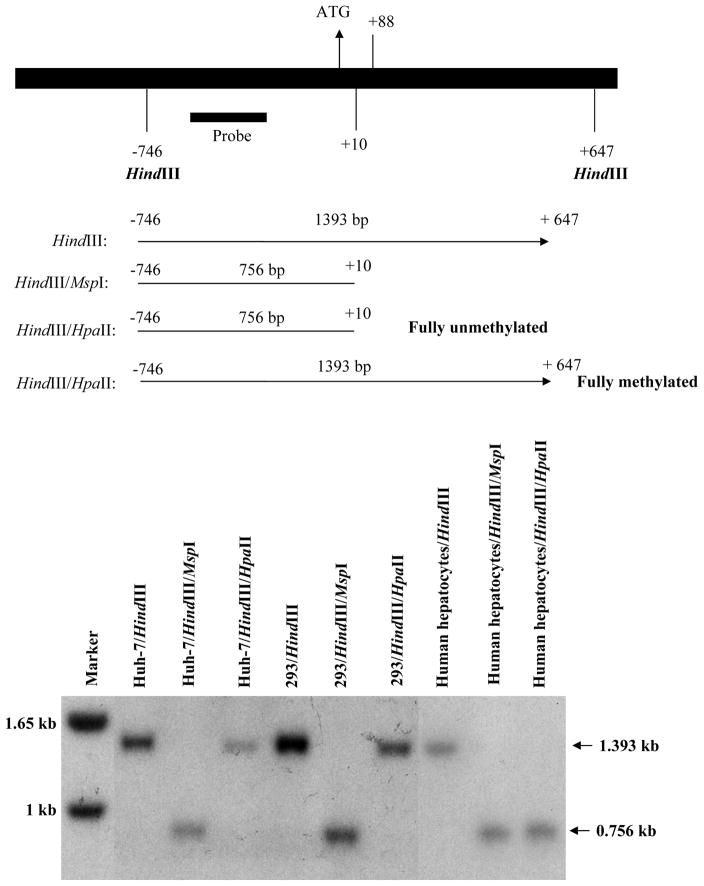
Using a separate probe designed to investigate the +10 site more carefully, both Huh-7 and 293 cells have methylation at +10 and +88 sites, since HpaII was unable to digest the DNA and results in a band similar to HindIII digestion alone. However, primary cultures of human hepatocytes (to avoid any contamination from other cell types in human liver specimens) have the +10 site fully unmethylated (Fig. 3).
Fig 3.
Methylation pattern at +10 and +88 sites of MAT1A in Huh-7, HEK293 (293), and primary human hepatocytes. DNA from Huh-7, 293 cells, and human hepatocytes were first digested with HindIII, which cleaves at −746 and +647 of MAT1A as depicted on top. The DNA is then digested with MspI or HpaII and Southern blot hybridization was performed using the labeled human MAT1A probe as shown on top. Note that digestion of Huh-7 and 293 cells with HpaII results in only a high molecular weight (1.393 kb) band, the same size as with HindIII alone, which is consistent with the sites at +10 and +88 being fully methylated. In contrast, HpaII digestion of human hepatocytes results only in a low molecular weight band (0.756 kb), the same size as with MspI which is consistent with the notion that +10 is unmethylated.
To confirm the results of the Southern blots, bisulfite-mediated genomic DNA sequencing was also carried out to compare methylation pattern spanning the region from −61 to +207 of MAT1A in primary cultures of human hepatocytes to Huh-7 cells. There are six methylation sites in this region at position −23, +10, +65, +88, +123, and +207. Human hepatocytes are completely unmethylated at all of these sites (16 out of 16 clones) while Huh-7 cells have all of these sites methylated (16 out of 16 clones) with the exception of the +88 site where 11 out of 16 clones were methylated.
HpaII Site Methylation and MAT1A Promoter Activity
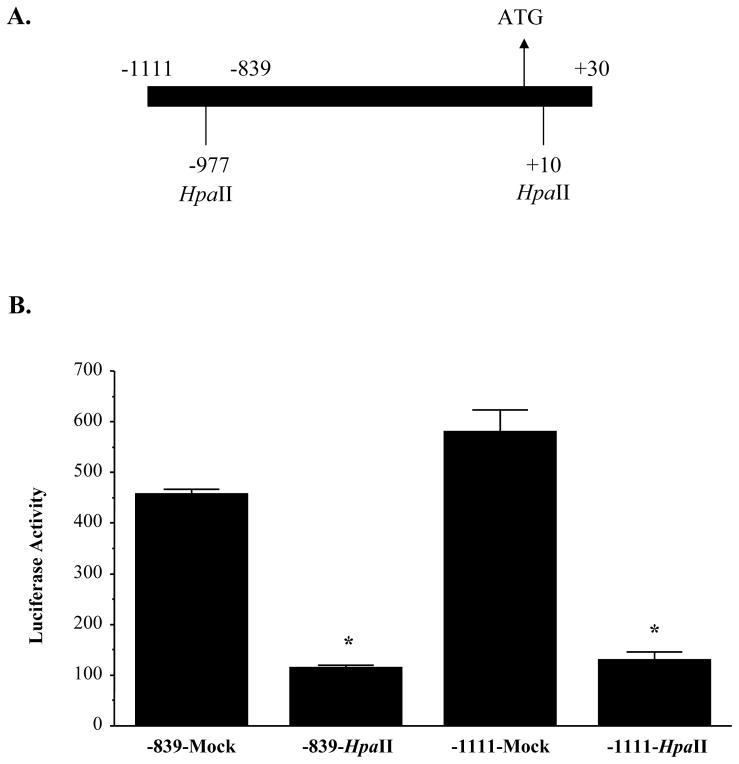
To assess directly the influence of methylation of each of the HpaII sites (−977, +10 and +88) on MAT1A promoter activity, DNA fragments containing these sites were in vitro methylated by HpaII and re-ligated back to the pGL-3 enhancer vector for transient transfection analysis in HepG2 cells. Figure 4 shows the results of these experiments using constructs −1111/+30-LUC and −839/+30-LUC. When either of the constructs is in vitro methylated by HpaII, the promoter activity is decreased by 3-fold (Fig. 4B).
Fig 4.
Effect of methylation at the −977 and +10 sites of MAT1A on luciferase expression driven by the MAT1A promoter. Human MAT1A DNA fragments −1111 to +30 and −839 to +30 were HpaII methylated or mock methylated in vitro and re-ligated back to the promoterless luciferase pGL-3 enhancer vector as described in Methods. Numbering is relative to the translational start site (Zeng et al., 2000). Part A shows the MAT1A constructs used and the HpaII sites. Part B shows the effect of HpaII methylation of the constructs on luciferase activity. Results represent mean±SEM from three independent experiments performed in triplicates. The luciferase activity of each transfection was expressed as luciferase activity/β-galactosidase activity. Data are expressed as relative luciferase activity to that of pGL-3 enhancer vector control, which is assigned a value of 1.0. *p<0.05 vs. its own mock methylated control.
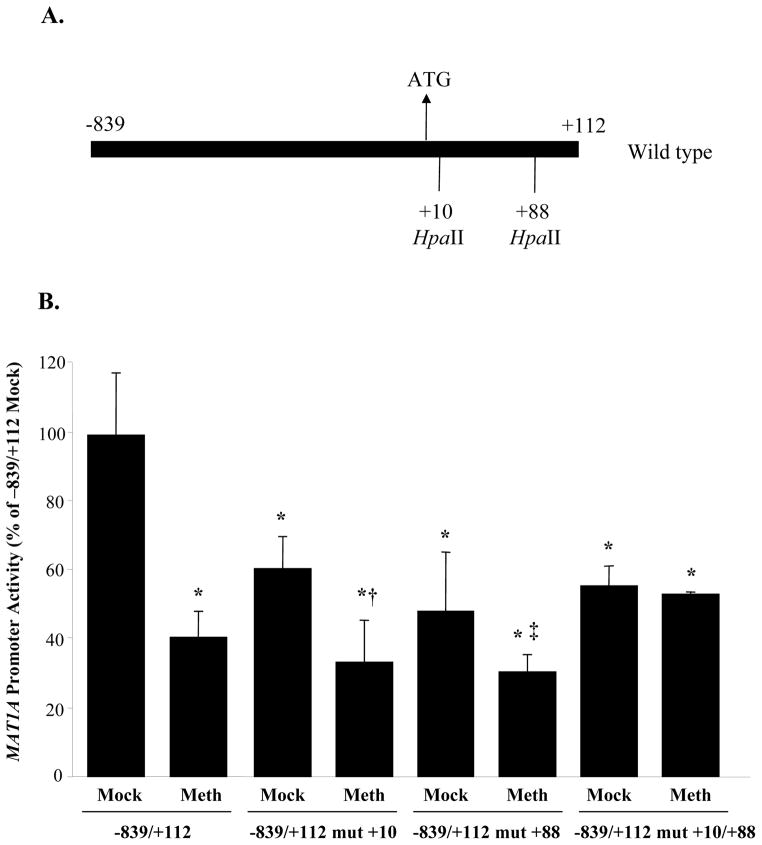
To assess the importance of the HpaII sites at +10 and +88, MAT1A construct −839/+112 was used (Fig. 5). When both sites are methylated, there is a 60% decrease in luciferase activity. Mutation of either +10 (labeled as −839/+112 mut +10) or +88 (labeled as −839/+112 mut +88) or both (labeled as −839/+112 mut +10/+88) also reduced basal promoter activity of this construct by about 40%. With either the +10 or +88 site mutated, HpaII methylation reduced the promoter activity by about 40%. However, if both sites are mutated, HpaII methylation no longer inhibited the promoter activity.
Fig 5.
Effect of methylation at the +10 and +88 sites of MAT1A on luciferase expression driven by the MAT1A promoter. Human MAT1A DNA fragments −839 to +112, either wild type or mutated at the +10 site (mut +10), +88 site (mut +88), or both (mut +10/+88) were generated, HpaII methylated or mock methylated in vitro and re-ligated back to the promoterless luciferase pGL-3 enhancer vector as described in Methods. Results represent mean±SEM from three independent experiments performed in triplicates. The luciferase activity of each transfection was expressed as luciferase activity/β-galactosidase activity. Data are expressed as % of −839/+112 Mock control. *p<0.001 vs. −839/+112 Mock, †p<0.02 vs. −839/+112 Mock mut+10, ‡p<0.04 vs. −839/+112 Mock mut+88.
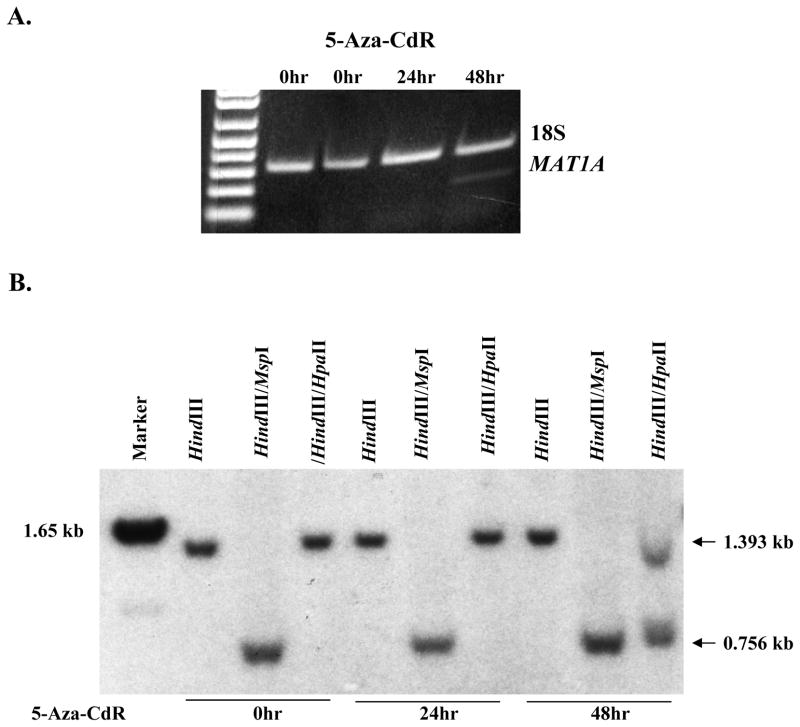
To confirm that methylation status of +10 and +88 correlates with MAT1A expression, Huh-7 cells were treated with an inhibitor of DNA methylation, 5′aza-2′-deoxycytidine (5-Aza-CdR, 0.1 μM for 24 or 48 hrs). 5-Aza-CdR induced the expression of MAT1A after 48 hrs (Fig. 6A) and Southern blot analysis using the probe designed to examine methylation status of +10 and +88 (see Fig. 3) shows that these sites became partially demethylated as MAT1A was reactivated (Fig. 6B).
Fig 6.
Effect of 5′aza-2′-deoxycytidine (5-Aza-CdR) on MAT1A expression (part A), and methylation pattern at +10 and +88 (part B). Huh-7 cells were treated with 5-Aza-CdR (0.1 μM for 24 or 48 hrs). RNA and DNA were extracted for determination of MAT1A expression by RT-PCR or methylation pattern at +10 and +88 by Southern blot analysis as described in Methods. MAT1A is reactivated 48 hrs following 5-Aza-CdR treatment (part A). Southern blot analysis showed that at 0hr, digestion with HindIII/HpaII results in only a high molecular weight (1.393 kb) band, the same size as with HindIII alone which is consistent with the sites at +10 and +88 being fully methylated. After 48 hrs of treatment with 5-Aza-CdR, HindIII/HpaII digestion results in two low molecular weight bands and one high molecular weight band, consistent with the notion that +10 and +88 are partially unmethylated (part B).
Methylation or Mutation at +10 and +88 Sites Decrease Transcription of MAT1A
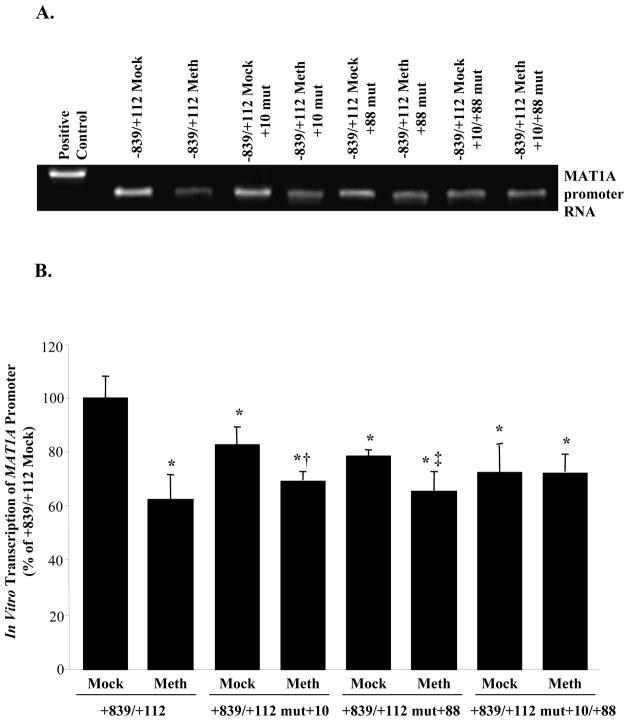
To verify that methylation or mutation of +10 and +88 sites in the MAT1A coding region can inhibit transcription, we employed an in vitro transcription assay system. Figure 7 shows that similar to what we observed with reporter activity driven by these constructs, methylation of +10 and +88 sites as well as mutation of these sites all reduced the amount of a single transcript from MAT1A promoter, with methylation causing a greater reduction than mutation.
Fig 7.
Effect of methylation at the +10 and +88 sites of MAT1A on in vitro transcription. Human MAT1A DNA fragments −839 to +112, either wild type or mutated at the +10 site (mut +10), +88 site (mut +88), or both (mut +10/+88) were generated, HpaII methylated or mock methylated in vitro and re-ligated back to the T7 promoter for in vitro transcription assay as described in Methods. Amount of MAT1A promoter RNA transcript was visualized by gel electrophoresis and subjected to densitometric analysis. Part A shows a representative gel and part B shows the densitometric summary of four independent experiments expressed as mean±SEM % of −839/+112 Mock control. *p<0.02 vs. −839/+112 Mock, †p<0.05 vs. −839/+112 Mock mut+10, ‡p<0.04 vs. −839/+112 Mock mut+88.
DISCUSSION
MAT is a critical cellular enzyme because it catalyzes the only reaction that generates AdoMet. The MAT gene is one of 482 genes absolutely required for survival of an organism (Mato et al., 1997). In mammals, two distinct genes encode for MAT (Horikawa and Tsukada, 1992; Alvarez et al., 1993; Kotb et al., 1997). MAT1A is expressed in the liver shortly before birth and becomes the major form of MAT as the liver matures (Gil et al., 1996). It is a marker for differentiated or mature liver phenotype. In contrast, MAT2A is expressed in all non-hepatic tissues as well as during periods of rapid liver growth and de-differentiation (Mato et al., 2002). Although the two MAT genes are highly homologous, the enzymes they encode for are different in the kinetic profiles and regulatory property (Mato et al., 2002). Due to these differences, the type of MAT expressed can influence the steady state AdoMet level in the cell. Using a cell line model that differs only in the type of MAT expressed, cells that expressed MAT1A had the highest intracellular AdoMet level whereas cells that expressed MAT2A had the opposite (Cai et al., 1998). Interestingly, cells that expressed MAT2A grew faster than cells that expressed MAT1A (Cai et al., 1998). Thus, the switch in MAT expression in liver cancer is pathogenetically important since it offered the cancerous cell a growth advantage.
Decreased hepatic MAT activity is well known in patients with liver cirrhosis (Mato et al., 1997, 2002; Avila et al., 2000). Both decreased MAT1A mRNA levels and inactivation of MAT I/III isoenzymes occur with the consequence of decreased AdoMet biosynthesis (Avila et al., 2000; Mato et al., 2002). The importance of MAT expression on AdoMet level and liver phenotype was also confirmed in the MAT1A knockout mouse model where replacement of MAT1A with MAT2A resulted in chronic hepatic AdoMet depletion, predisposition to liver injury, and eventual development of HCC (Lu et al., 2001; Martínez-Chantar et al., 2002). Given the importance of maintaining MAT1A expression, it is important to understand how its expression is regulated. We had previously reported that MAT1A expression is regulated by histone acetylation and methylation (Torres et al., 2000). However, in those studies we did not directly demonstrate that methylation of MAT1A can influence MAT1A expression. We also did not examine sites other than 977. The current work investigated in detail whether methylation of MAT1A can influence its transcriptional activity and if so, how.
Using a combination of sodium bisulfite treatment genomic sequencing and Southern blot analysis, we found that methylation at the −977 site of the MAT1A promoter does not correlate with MAT1A expression, as both Huh-7 cells and normal liver exhibit partial methylation of this site. There is better correlation with methylation closer to the transcriptional start site, and near perfect correlation with methylation at both +10 and +88 sites and the lack of MAT1A expression. Promoter methylation has been extensively studied and is well known to inhibit gene expression (Razin, 1998). However, methylation of the coding region has not been reported to influence mammalian gene expression. Methylation of the coding region has been reported to influence luciferase gene expression on an episome (Irvine et al., 2002). Methylation of the coding region of the herpes simplex virus tk gene was shown to inhibit tk expression (Graessmann et al., 1994). Interestingly, methylation of single HpaII sites, as far as 571 downstream from the transcription start site, blocked expression of the tk gene (Graessmann et al., 1994). This prompted us to examine in more detail whether methylation at the +10 and +88 of MAT1A can influence its expression.
To examine the effect of methylation on MAT1A promoter activity, MAT1A promoter constructs were methylated in vitro by HpaII methylase and subsequently used for transfection experiments. Using the constructs −839/+30-Luc and −1111/+30-Luc, we found that methylation at the +10 site led to a 3-fold reduction in promoter activity, while methylation at both the +10 and −977 site reduced the promoter activity by an additional 4% or so (Fig. 4B). This suggests it is the +10 site that is more critical for reporter activity. This prompted us to further examine the role of the two coding region methylation at +10 and +88. Methylation of both of these sites reduced the promoter activity by 60%, while mutation of these sites reduced the activity by 40% (Fig. 5B). These results clearly establish the ability of methylation of these two HpaII sites in the coding region to inhibit MAT1A transcription. Furthermore, the in vivo significance is demonstrated by the reactivation of MAT1A as these sites became demethylated.
Methylation of the promoter region of genes is thought to inhibit gene expression by either directly blocking the binding of transcription factors to important enhancer elements, or indirectly by recruiting proteins that bind to methylated cytosines. These proteins are thought to modify chromatin structure by recruiting histone deacetylase, leading to a condensed and inactive chromatin (Razin, 1998; Jones et al., 1998). Coding region methylation in the herpes simplex virus tk gene is thought to block at the level of transcription elongation (Graessmann et al, 1994). We next examined whether methylation and/or mutation of +10 and +88 sites inhibit either transcription initiation and/or elongation using an in vitro T7 transcription system. We found that either methylation or mutation reduced the amount of a single transcript suggesting that they are more likely to influence transcription initiation and not elongation, as transcripts of shorter sizes would have been expected. However, we cannot exclude the possibility that elongation very close to the initiation site was inhibited.
Mutation at the +10/+88 sites also exert an inhibitory effect on MAT1A transcription, but to a lesser extent than methylation. We speculate that methylation of these sites may affect the binding of factor(s) that are important for MAT1A transcription, whereas a single mutation may not completely abrogate the binding of such factor(s).
Our findings suggest that coding region methylation is a key mechanism for reduced MAT1A expression in HCC. Recently we demonstrated that forced expression of MAT1A reduced in vivo HCC growth and angiogenesis (Li et al., 2010). Understanding how the +10/+88 sites of MAT1A become hypermethylated in HCC and whether this can be reversed may lead to novel strategy for HCC treatment.
In summary, we have uncovered a highly novel finding, the ability of coding region methylation of a human gene to regulate gene transcription. This has not been previously reported to our knowledge and adds another layer of complexity to how methylation can regulate gene expression.
Acknowledgments
Grant information: This work was supported by NIH grants R01 DK51719 (to SC Lu), R01 AT004896 (SC Lu and JM Mato), F32 AA020150 (ML Tomasi), and Plan Nacional of I+D SAF 2008-04800, and HEPADIP-EULSHM-CT-205 (to JM Mato). Primary cultures of human hepatocytes, HepG2, Huh-7, and 293 cells were provided by the Cell Culture Core of the USC Research Center for Liver Diseases (P30 DK48522). Normal and cancerous liver tissues were obtained from the Translational Pathology Core Facility of the USC/Norris Comprehensive Cancer Center (P30 CA14089).
We thank Dr. Chih-Lin Hsieh for her assistance with bisulfite-mediated genomic DNA sequencing.
References
- Alvarez L, Corrales F, Martín-Duce A, Mato JM. Characterization of a full-length cDNA encoding human liver S-adenosylmethionine synthetase: tissue-specific gene expression and mRNA levels in hepatopathies. Biochem J. 1993;293:481–486. doi: 10.1042/bj2930481. [DOI] [PMC free article] [PubMed] [Google Scholar]
- Avila MA, Berasain C, Torres L, Martín-Duce A, Corrales FJ, Yang HP, Prieto J, Lu SC, Caballería J, Rodés J, Mato JM. Reduced mRNA abundance of the main enzymes involved in methionine metabolism in human liver cirrhosis and hepatocellular carcinoma. J Hepatol. 2000;33:907–914. doi: 10.1016/s0168-8278(00)80122-1. [DOI] [PubMed] [Google Scholar]
- Cai J, Mao Z, Hwang JJ, Lu SC. Differential expression of methionine adenosyltransferase genes influences the rate of growth of human hepatocellular carcinoma cells. Cancer Research. 1998;58:1444–1450. [PubMed] [Google Scholar]
- Cai J, Sun WM, Hwang JJ, Stain S, Lu SC. Changes in S-adenosylmethionine synthetase in human liver cancer: molecular characterization and significance. Hepatology. 1996;24:1090–1097. doi: 10.1002/hep.510240519. [DOI] [PubMed] [Google Scholar]
- Chomczynski P, Sacchi N. Single-step method of RNA isolation by acid guanidinium thiocyanate-phenol-chloroform extraction. Anal Biochem. 1987;162:156–159. doi: 10.1006/abio.1987.9999. [DOI] [PubMed] [Google Scholar]
- Finkelstein JD. Methionine metabolism in mammals. J Nutr Biochem. 1990;1:228–237. doi: 10.1016/0955-2863(90)90070-2. [DOI] [PubMed] [Google Scholar]
- Gil B, Casado M, Pajares M, Boscá L, Mato JM, Martín-Sanz P, Alvarez L. Differential expression pattern of S-adenosylmethionine synthetase isoenzymes during rat liver development. Hepatology. 1996;24:876–881. doi: 10.1002/hep.510240420. [DOI] [PubMed] [Google Scholar]
- Graessmann A, Sandberg G, Guhl E, Graessmann M. Methylation of single sites within the herpes simplex virus tk coding region and the simian virus 40 T-antigen intron causes gene inactivation. Mol Cell Biol. 1994;14:2004–2010. doi: 10.1128/mcb.14.3.2004. [DOI] [PMC free article] [PubMed] [Google Scholar]
- Halim A, Leighton L, Geller A, Kotb M. Expression and functional interaction of the catalytic and regulatory subunits of human methionine adenosyltransferase in mammalian cells. J Biol Chem. 1999;274:29720–297257. doi: 10.1074/jbc.274.42.29720. [DOI] [PubMed] [Google Scholar]
- Horikawa S, Tsukada K. Molecular cloning and developmental expression of a human kidney S-adenosylmethionine synthetase. FEBS Lett. 1992;312:37–41. doi: 10.1016/0014-5793(92)81405-b. [DOI] [PubMed] [Google Scholar]
- Horikawa S, Ozasa H, Ota K, Tsukada K. Immunohistochemical analysis of rat S-adenosylmethionine synthetase isozymes in developmental liver. FEBS Lett. 1993;330:307–311. doi: 10.1016/0014-5793(93)80894-z. [DOI] [PubMed] [Google Scholar]
- Huang ZZ, Mao Z, Cai J, Lu SC. Changes in methionine adenosyltransferase during liver regeneration in the rat. Am J Physiol. 1998;275:G14–21. doi: 10.1152/ajpgi.1998.275.1.G14. [DOI] [PubMed] [Google Scholar]
- Huang Z, Mato JM, Kanel G, Lu SC. Differential effect of thioacetamide on hepatic methionine adenosyltransferase expression in the rat. Hepatology. 1999;29:1471–1478. doi: 10.1002/hep.510290525. [DOI] [PubMed] [Google Scholar]
- Irvine RA, Lin G, Hsieh CL. DNA methylation has a local effect on transcription and histone acetylation. Mol Cell Biol. 2002;22:6689–6696. doi: 10.1128/MCB.22.19.6689-6696.2002. [DOI] [PMC free article] [PubMed] [Google Scholar]
- Jones PL, Veenstra GJC, Wade PA, Vermaak D, Kass SU, Landsberger N, Strouboulis J, Wolff AP. Methylated DNA and MeCP2 recruit histone deacetylase to repress transcription. Nature Genetics. 1998;19:187–191. doi: 10.1038/561. [DOI] [PubMed] [Google Scholar]
- Kotb M, Mudd SH, Mato JM, Geller AM, Kredich NM, Chou JY, Cantoni GL. Consensus nomenclature for the mammalian methionine adenosyltransferase genes and gene products. Trends in Genetics. 1997;13:51–52. doi: 10.1016/s0168-9525(97)01013-5. [DOI] [PubMed] [Google Scholar]
- Li J, Ramani K, Sun Z, Zee C, Grant EG, Yang HP, Xia M, Oh P, Ko K, Mato JM, Lu SC. Forced expression of methionine adenosyltransferase 1A in human hepatoma cells suppresses in vivo tumorigenesis in mice. Am J Pathol. 2010;176:2456–2466. doi: 10.2353/ajpath.2010.090810. [DOI] [PMC free article] [PubMed] [Google Scholar]
- Lu SC, Alvarez L, Huang ZZ, Chen LX, An W, Corrales FJ, Avila MA, Kanel G, Mato JM. Methionine adenosyltransferase 1A knockout mice are predisposed to liver injury and exhibit increased expression of genes involved in proliferation. Proc Nat Acad Sci, USA. 2001;98:5560–5565. doi: 10.1073/pnas.091016398. [DOI] [PMC free article] [PubMed] [Google Scholar]
- Mao Z, Liu S, Cai J, Huang ZZ, Lu SC. Cloning and functional characterization of the 5′-flanking region of human methionine adenosyltransferase 2A gene. Biochem Biophys Res Commun. 1998;248:479–484. doi: 10.1006/bbrc.1998.8965. [DOI] [PubMed] [Google Scholar]
- Martínez-Chantar ML, Corrales FJ, Martínez-Cruz A, García-Trevijano ER, Huang ZZ, Chen LX, Kanel G, AvilA MA, Mato JM, Lu SC. Spontaneous oxidative stress and liver tumors in mice lacking methionine adenosyltransferase 1A. FASEB J. 2002;16:1292–1294. doi: 10.1096/fj.02-0078fje. [DOI] [PubMed] [Google Scholar]
- Mato JM, Alvarez L, Ortiz P, Pajares MA. S-adenosylmethionine synthesis: molecular mechanisms and clinical implications. Pharmacol Ther. 1997;73:265–280. doi: 10.1016/s0163-7258(96)00197-0. [DOI] [PubMed] [Google Scholar]
- Mato JM, Corrales FJ, Lu SC, Avila MA. S-Adenosylmethionine: a control switch that regulates liver function. FASEB J. 2002;16:15–26. doi: 10.1096/fj.01-0401rev. [DOI] [PubMed] [Google Scholar]
- Paulin R, Grigg GW, Davey MW, Piper AA. Urea improves efficiency of bisulphite-mediated sequencing of 5′-methylcytosine in genomic DNA. Nucl Acid Res. 1998;26:5009–5010. doi: 10.1093/nar/26.21.5009. [DOI] [PMC free article] [PubMed] [Google Scholar]
- Razin A. CpG methylation, chromatin structure and gene silencing-a three-way connection. Embo J. 1998;17:4905–4908. doi: 10.1093/emboj/17.17.4905. [DOI] [PMC free article] [PubMed] [Google Scholar]
- Torres L, Avila MA, Carretero MV, Latasa MU, Caballería J, López-Rodas G, Boukaba A, Lu SC, Franco L, Mato JM. Liver-specific methionine adenosyltransferase MAT1A gene expression is associated with a specific pattern of promoter methylation and histone acetylation: implications for MAT1A silencing during transformation. FASEB J. 2000;14:95–102. doi: 10.1096/fasebj.14.1.95. [DOI] [PubMed] [Google Scholar]
- Yang HP, Huang ZZ, Zeng ZH, Chen CJ, Selby RR, Lu SC. Role of promoter methylation in increased methionine adenosyltransferase 2A expression in human liver cancer. Am J Physiol. 2001;280:G184–190. doi: 10.1152/ajpgi.2001.280.2.G184. [DOI] [PubMed] [Google Scholar]
- Yang HP, Zeng Y, Lee TD, Yang Y, Ou XP, Chen LX, Haque M, Rippe R, Lu SC. Role of AP-1 in the coordinate induction of rat glutamate-cysteine ligase and glutathione synthetase by tert-butylhydroquinone. J Biol Chem. 2002;277:35232–35239. doi: 10.1074/jbc.M203812200. [DOI] [PubMed] [Google Scholar]
- Zeng ZH, Huang ZZ, Chen CJ, Yang HP, Mao Z, Lu SC. Cloning and functional characterization of the 5′-flanking region of human methionine adenosyltransferase 1A gene. Biochem J. 2000;346:475–482. [PMC free article] [PubMed] [Google Scholar]


