

Abstract
Microsomal prostaglandin E synthase-1 (mPGES-1) is an inducible prostaglandin E synthase after exposure to pro-inflammatory stimuli and, therefore, represents a novel target for therapeutic treatment of acute and chronic inflammatory disorders. It is essential to identify mPGES-1 inhibitors with novel scaffolds as new leads or hits for the purpose of drug design and discovery that aim to develop the next-generation anti-inflammatory drugs. Herein we report novel mPGES-1 inhibitors identified through a combination of large-scale structure-based virtual screening, flexible docking, molecular dynamics simulations, binding free energy calculations, and in vitro assays on the actual inhibitory activity of the computationally selected compounds. The computational studies are based on our recently developed three-dimensional (3D) structural model of mPGES-1 in its open state. The combined computational and experimental studies have led to identification of new mPGES-1 inhibitors with new scaffolds. In particular, (Z)-5-benzylidene-2-iminothiazolidin-4-one is a promising novel scaffold for the further rational design and discovery of new mPGES-1 inhibitors. To our best knowledge, this is the first time a 3D structural model of the open-state mPGES-1 is used in structure-based virtual screening of a large library of available compounds for the mPGES-1 inhibitor identification. The positive experimental results suggest that our recently modeled trimeric structure of mPGES-1 in its open state is ready for the structure-based drug design and discovery.
Introduction
Prostaglandin E2 (PGE2) is one of the most important prostanoids with diverse biological activity.1 The biosynthetic pathway of PGE2 has been well characterized and involves three sequential enzymatic actions.2 The first step in this pathway, involves the release of arachidonic acid (AA) from the membrane, by the action of phospholipase A2 (PLA2).2 This is followed by the conversion of AA to prostaglandin H2 (PGH2) by the action of cyclooxygenase COX-1 or COX-2.2 Finally, PGH2 is converted to PGE2 by the action of terminal prostaglandin E synthase (PGES) enzymes,3 particularly microsomal PGES-1 (mPGES-1).4 It has been known that mPGES-1 couples with COX-25–6 and plays a key role in a number of disease conditions, including inflammation, arthritis, fever, pain, cancer, stroke, and bone disorders.7–13 Human mPGES-1 has been recognized as a promising target of next-generation therapeutics for the above diseases.14
As well known, the currently available non-steroidal anti-inflammatory drugs (NSAIDs) inhibit either cyclooxygenase (COX)-1 or COX-2 or both.15 These inhibitors have several deleterious side effects including ulcers, bleeding within the gastrointestinal tract, or increased risk of cardiovascular events.16 The withdrawal of rofecoxib (Vioxx) due to side effects further highlights the need to develop improved, safer anti-inflammatory drugs.15 The COX inhibitors prevent the production of all prostaglandins downstream of PGH2, which results in a lot of problems. For example, blocking the production of prostaglandin-I2 (PGI2) has been reported to play a role in cardiovascular events.17 Unlike COX inhibition, inhibition of terminal mPGES-1 will only block the production of PGE2 without affecting the normal production of other prostaglandins including PGI2. Reported knock-out studies identified mPGES-1 as an essential central switch in pyresis.18 The mPGES-1 knock-out studies also revealed a decrease in inflammatory response in a collagen-induced arthritis model.19 In contrast to COX-2, mPGES-1-deficient mice were reported to be viable, fertile and have normal phenotype.19 Ischemic stroke induced in mPGES-1 null mice was reported to show significant reduction in the infarct size and volume.10, 14 Thus, mPGES-1 inhibitors are expected to retain the anti-inflammatory effect as COX inhibitors without the side effects of COX inhibitors.
An effective approach to inhibit mPGES-1 is the blockage of its interaction with the PGH2 substrate. Therefore, molecules that show similar structure to the mPGES-1 substrate may function as competitive inhibitors. Although mPGES-1 inhibitors are expected to be potentially valuable therapeutic agents, few inhibitors of mPGES-1 were identified in experimental screening efforts. The COX-2 inhibitor NS-398, 5-Lipoxygenase activating protein (FLAP) inhibitor MK-886, and the active metabolite of another NSAID sulindac, were found to inhibit mPGES-1 with an IC50 of 20, 1.6, and 80 μM, respectively.20–21,22 Leukotriene C4 was reported to inhibit mPGES-1 with micromolar IC50, probably by competing with glutathione (GSH).20 In addition to small molecules,23 several polyunsaturated fatty acids and stable analogs of PGE2 were reported to inhibit mPGES-1.24 Riendeau22 recently reported a series of mPGES-1 inhibitors. These compounds were synthesized based on the scaffold of MK-886 (FLAP inhibitor). Some of these newly synthesized mPGES-1 inhibitors are potent, with an IC50 value of a few nM in vitro. Unfortunately, all of these inhibitors are inactive against mPGES-1 in vivo. It is highly desirable to design and discover novel inhibitors of mPGES-1 with different scaffolds in development of next-generation therapeutics for inflammation-related diseases.
Even though high-throughput screening has been used successfully with the goal of identifying new leads in drug discovery, it remains a costly and time-consuming process. Alternatively, virtual screening has emerged as a complementary approach.25 Structure-based computational approaches for evaluating binding propensities within large ligand sets are widely used in modern rational drug design.26–31 An important class of such methods is based on virtual screening with a pharmacophore or a 2D pattern derived from known active substances.
A second class of virtual screening methods is provided by docking and scoring techniques that predict the positions of bound ligands and the related binding affinities for cases where the 3D structure of the protein target is known. Advanced docking algorithms can in general accurately sample the conformational space of protein–ligand complexes, including those of conformationally flexible binders. Analytical scoring functions of differing composition and accuracy are used for estimating protein–ligand interaction energies and to rank the binding affinities of the docked protein-ligand complexes. Both high-throughput virtual library screen and docking methods may generate false hits and miss promising compounds.27 Nevertheless, despite the inherent limitations, virtual screening methods provide a valuable tool for rational selection of potential hits for bioassay studies.
While all docking programs use the structure of the target protein to detect active molecules, they differ greatly in the details of their implementation. Two of the basic parts of any docking program are the docking algorithm that creates trial poses within the active site and the scoring function that evaluates the fitness of each pose and the relative fitness of different ligands. However, several analyses32–34 revealed that most docking programs are effective overall but highly inconsistent; one program might work well for one target protein, but poorly for another.
Despite the obvious limitations, rigid-body docking methods implemented in FRED35 or DOCK36–38 are interesting because they are much faster than the flexible docking algorithms and because significant noise can be generated with fully flexible docking of large collections. A common approach to improve the results (decrease the false positive hits) from rigid-body docking is to further simulate the obtained ligand binding poses using MD simulations.
Recently, as part of a large program of design, synthesis, in silico, and in vitro screening of new classes of mPGES-1 inhibitors, we reported the 3D structural model of the mPGES-1 trimer and its binding with substrates and inhibitors.39 Further experimental and computational studies40 of the mPGES-1 were carried out to validate and identify the specific residues of the enzyme’s active site involved in the binding of the substrate and cofactor ligands. The present study has three mains goals: (I) validation of the constructed mPGES-1 trimeric structure and identification of the key residues involved in the inhibition mechanism; (II) assessment of how our improved structure-based design protocol is suited for inhibitor design and docking experiments; and (III) identification of novel mPGES-1 inhibitors with new scaffolds.
Although several compounds have been recently identified through the ligand-based modeling approach,41–42 the optimization process of the lead compounds will be an elaborate step without knowing the binding mode of the ligands with the mPGES-1 target.
The ultimate goal of this study is to identify new classes of mPGES-1 inhibitors using structure-based computational approaches with subsequent bioassay experiments to provide a starting point for lead optimization and preclinical drug development. Lead optimization will be required to produce more drug-like inhibitors which should possess biological activity at clinically relevant concentrations.
In order to identify novel compounds that can inhibit mPGES-1 and to develop a predictive tool for the design of more potent mPGES-1 inhibitors, we have developed a hierarchical, combined computational/experimental procedure which includes a robust and efficient structure-based drug design route using our recently developed trimer model of mPGES-1 in its open state, leading to identification of novel mPGES-1 inhibitors with new scaffolds.
Methods
Structure-based virtual screening
We have used the ligand-based screening, rigid docking, flexible docking, and molecular dynamics (MD) simulations followed by MM-GBSA calculations as screening filters in virtual screening. The flow chart of steps used in our virtual screening strategy is given in Figure 1.
Figure 1.

Structure-based virtual screening workflow
To identify potential inhibitors of human mPGES-1, the trimeric structure of mPGES-1 was retrieved from our previous computational modeling work.39–40 The compounds screened were available in a compound library at Genomics Research Institute (GRI) at the University of Cincinnati (UC). The UC/GRI compound library containing structural information for 345,447 compounds was provided by Procter & Gamble (P&G) and belonged to a Consortium including University of Kentucky as a member. In our virtual screening of the compound library (database), initially, the database was cleaned by removing waters, solvent, counter ions, etc. Subsequent ligand preparation, including generation of tautomers, stereoisomers, ring conformations, and a variety of ionization states, resulted in a total of ~2.1 million structures.
For our virtual screening study, we decided to use the previously identified binding pocket of mPGES-1 as the target of interest.40 The active site was defined as all atoms within a radius of ~12 Ǻ from the ligand in the binding pocket.
Generation of conformations
Starting from the structural data (SD) files available, we first generated various molecular orientations and multiple conformations of each ligand in the database by using OMEGA (OpenEye Scientific Software).43–45 OMEGA sampling is capable of selecting a ligand conformation similar to that of the targeted X-ray crystal structure by using an appropriate option (default) including a low-energy cutoff to discard high-energy conformations, a low root-mean-square deviation (RMSD) value below which two conformations are considered to be similar.45 Atom typing, energy calculations, and geometry optimization in OMEGA were performed using the Merck Molecular Force Field (MMFF). The maximum allowed conformations per compound was set to 200 and the energy window (the value used to discard high-energy conformations) was set to 10 kcal/mol. The default values of the OMEGA program were used for other parameters.
Shape filter
Shape-based screening using ROCS program46–47 was used as the first filter in our virtual screening. The program was used to find the similarity between the molecules based on shape. The basic idea behind ROCS is that two objects cannot have the same shape if their volumes are not the same. This method tries to find and quantify the maximum overlap of the volume of two molecules. The goal of this method is to find molecules that can adopt shapes extraordinarily similar to the query without necessarily having similar atom types and bonding patterns.46 Consequently, molecules are optimally aligned and matches are based on volume overlap. Similarity is measured by the shape Tanimoto score. The shape Tanimoto score has a value of 1.0 if two shapes are identical, and 0.0 if completely different.46 In the present work, ROCS shape searching with chemical complementarity is used. The chemical complementarities searches used the ImplicitMillsDean chemical forcefield, (also called color forcefield) which defines six chemical types: hydrogen-bond donors, hydrogen-bond acceptors, hydrophobes, anions, cations, and rings. Both shape Tanimoto and color forcefield were used in the ranking of ligands by ROCS. Thus, the multi-conformational database generated using OMEGA was filtered with ROCS program and the AM1-bcc atomic partial charges of the ligands were determined by using the Molcharge program (OpenEye Scientific Software).
We utilized molecular structures of two known mPGES-1 inhibitors, 3-(1-(4-chlorobenzyl)-3-methyl-1H-indol-2-yl)-2,2-dimethylpropanoic acid (MK-886, 1) and its derivative 3-(1-(4-chlorobenzyl)-5-(2-fluoro-[1,1′-biphenyl]-4-yl)-3-methyl-1H-indol-2-yl)-2,2-dimethylpropanoic acid (2) described by Riendeau et al.22 as the ligand query and selected the top ~33% hits for each query (Figure 2). The two query molecules were retrieved from our previous work.39
Figure 2.

(Left) Molecular structures of known inhibitors of mPGES-1: compounds 1 and 2. (Right) Topographical interaction model of compound 2 with mPGES-1 active site.
Rigid molecular docking
FRED (OpenEye Scientific Software) was used in this study to dock the generated ROCS shape-based screening library mentioned above.35 The strategy of FRED is to exhaustively dock and score all possible positions of each ligand in the binding site. This rigid docking roughly consists of two steps, i.e. shape fitting and optimization. During the shape fitting, the ligand was placed into a 0.5 Å-resolution grid box encompassing all active-site atoms (including hydrogen atoms) using a smooth Gaussian potential.48 A series of two optimization filters were then processed, consisting of a rigid-body optimization and optimization of the ligand pose in the dihedral angle space.
In our study, FRED docking involves exhaustive docking of multi-conformer ligand and generation of poses. The pose ensemble was then filtered to reject poses that do not have sufficient shape complimentarily with the active site of the protein followed by rejection of poses that do not have at least one heavy atom making a hydrogen bond with Arg110 side chain. The top-ranked poses are optimized by solid body optimization and refined with MMFF force field. In the optimization step, four scoring functions are available: Gaussian shape scoring,48 ChemScore,49 PLP,50 and ScreenScore.51 Preliminary docking trials led us to select the consensus score for the optimization filters. The resulting shape-filtered database (693,000 non-redundant compounds) set was split into 3,600 sub-databases which were docked separately using our in-house script programs for faster processing. The binding pose of the top-ranked 100 hits (~50%) from each cluster (depending on the sub-database size) were then merged into a set of 346,000 ligands which were refined (see below for Flexible Molecular Docking) using MD simulations for a more accurate search routine.
The receptor file was setup up automatically by the interactive GUI interface of FRED_receptor program using the structure of the target protein with ligand bound. The box enclosing the active site was determined by creating an initial box around the bound ligand and then extending each side of the box by 7 Å.
Flexible molecular docking
In separate docking runs, the ligand structures that passed the shape-fitting, optimization filters, and hydrogen bonding to the Arg110 side chain were submitted for energy minimization followed by 20 ps and 100 ps MD simulations using Amber10.52
The molecular mechanics parameters for the protein and ligands were assigned with Antechamber module of Amber10. In particular, the ligand atoms were assigned generalized amber force field (gaff)53 atom types, while Amber ff03 parameters were assigned to all the protein atoms.
During the energy minimization and MD simulation, only the ligand and residue side chains in the binding pocket were permitted to move freely. The nonbonded interaction cutoff and the dielectric constant were set to a group-based 20 Ǻ cutoff distance and distance-dependent (ε= 4r),54–55 respectively, so as to mimic the solvent environment. The last 5 to 20 snapshots of the simulated structure from 20 ps and 100 ps MD trajectory were used to perform the MM-GBSA calculations (see below).
MM-GBSA calculation
The binding free energies were calculated using the MM-GBSA method implemented in Amber10.52 Our MM-GBSA calculation for each snapshot was carried out in the same way as we did for other protein-ligand systems.40 Since the calculation of the entropic contribution (−TΔS) requires some further approximations and because we only needed to have a rough estimate of the relative binding free energies in this stage, the entropic contribution was neglected in our binding free energy calculations.
Molecular dynamics in explicitly solvated system
The general procedure for carrying out the MD simulations in water is essentially the same as that used in our previously reported other computational studies.56–58 Briefly, the MD simulations were performed using the Sander module from Amber10.52
The mPGES-1-ligand binding complex was neutralized by adding appropriate counter ions and was solvated in a rectangular box of TIP3P water molecules with a minimum solute-wall distance of 10 Å. The solvated systems were energy-minimized and carefully equilibrated. These systems were gradually heated from T = 10 K to T = 298.15 K in 50 ps before running an MD simulation. The MD simulations were performed with a periodic boundary condition in the NPT ensemble at T = 298.15 K with Berendsen temperature coupling59 and constant pressure (P = 1 atm) with isotropic molecule-based scaling. A time step of 2.0 fs was used, with a cutoff of 12 Å for the nonbonded interactions, and the SHAKE algorithm was employed to keep all bonds involving hydrogen atoms rigid.60 Long-range interactions were handled using the particle mesh Ewald (PME) algorithm.61 During the energy minimization and MD simulation, only the ligand and residue side chains in the binding pocket were permitted to move. We used the constraint to prevent any changes in the mPGES-1 structure due to the presence of residues in the loops on the top of the protein active site. A residue-based cutoff of 12 Å was utilized for non-covalent interactions. MD simulations were then carried out for 1 ns. During the simulations, the coordinates of the system were collected every 1 ps. The last 50 snapshots of the simulated structure of the MD trajectory were used to perform the MM-PB(GB)SA calculations (see below).
Binding free energy estimation using MM-PBSA method
The binding free energies ΔGbind were calculated by using the molecular mechanics-Poisson-Boltzmann surface area (MM-PBSA) free energy calculation method. We have used the Sietraj program to calculate the free energy of binding from the simulated trajectories.62 The program calculates the solvated interactions energies (SIE) using five terms and three parameters that have been fitted to reproduce the binding free energies of a data set of 99 ligand protein complexes by Naim et al.62 The Sietraj (http://www2.bri.nrc.ca/ccb/pub/sietraj_main.php) is a substitute of MM/PBSA methodology.63 The SIE calculates the intermolecular coulomb and van der Waals (vdW) interaction energies in the bound state, and the electrostatic contribution for solvation free energy to the binding is the difference of reaction field energy between bound and free states. The reaction field energy is computed by solving Poisson equation with the boundary element method.64 The internal dielectric constant of 2.25 and a solvent dielectric constant of 78.5 were used. The package calculates the free energy ΔGbind by using the solvated interaction energy formula (Eq. 1).
| (1) |
in which the standard scaling factor α value of 0.104758 was used.62 ΔECoul and ΔEvdw are the intermolecular coulomb and van der Waals interaction energies, respectively, in the bound state. The electrostatic contribution for solvation free energy ΔGreact.field to the binding is the difference of reaction field energy between the bound and free states. The ΔGnp term is the nonpolar solvation free energy, proportional to the solvent accessible surface area (Eq. 2):
| (2) |
in which the standard scaling coefficient γ value (0.012894 kcal/mol.Å2)62 was used for the non-polar solvation free energy calculation. The atomic radii were scaled by a value of rscale = 1.1 for the reaction field energy calculations, and a fitting constant C of value −2.89 kcal mol−1 was used. The scaling can be considered a crude treatment of entropy-enthalpy compensation.62,65 Here, we estimated ΔGbind by averaging the results calculated for the last 50 snapshots of the MD simulation on each protein-ligand complex.
In vitro experimental tests
Cloning of mPGES-1 and the protocol of the protein preparation were described in our previous reports.40,66 Briefly, on the basis of our previous experimental work, FreeStyle Max Expression System was used to express the wild-type mPGES-1. FreeStyle 293-F cells were cultured following manufacturer’s manual in FreeStyle 293 expression medium on orbit rotate shaker in 8% CO2 incubator at 37°C. Cells were transfected with 1.5 μg/mL of mPGES-1/pcDNA3 construct using FreeStyle Max reagent at a cell density of 1 × 10⁶ for 2 days. Transfected cells were collected, washed, and sonicated in TSES buffer (15 mM Tris-HCl, pH 8.0 plus 0.25 M sucrose, 0.1 mM EDTA and 1 mM DTT) on ice. The broken cells were first centrifuged at 12,500 × g for 10 min. The supernatant was further centrifuged at 105,000 × g for 1 hr at 4°C. The pellet was washed and homogenized in PBS buffer. The crude microsomal mPGES-1 preparation was aliquoted and stored at −80°C. The crude protein concentration was 8 mg/mL.
The enzyme activity assays were performed on ice in 1.5 ml microfuge tubes by using the expressed mPGES-1. The reaction mixture contained: 0.2 M Na2HPO4/NaH2PO4, pH 7.2, 10 μL; 0.1 M GSH, 2.5 μL; diluted microsomal enzyme (80 μg/mL), 1 μL; PGH2 (0.31 mM in DMF), 5 μL; 1 μL inhibitor; and H2O in a final reaction volume of 100 μL. PGH2 was stored in dry ice and used to initiate the reaction. Compounds were incubated with the enzyme for 15 min at room temperature before the addition of cold PGH2 (1 μM final) to initiate the enzyme reaction. After 30 s, 10 μL of SnCl2 (40 mg/mL) in ethanol was added to stop the reaction. The nonenzymatic conversion of PGH2 to PGE2 was performed in the same buffer devoid of enzyme. The reaction mixture was placed on ice until PGE2 production was determined by the PGE2 enzyme immunoassay as described earlier. IC50 values of the inhibitors were calculated by using the GraphPad Prism 4.0 program.
Results and Discussion
Structure-based virtual screening is the most efficient way for identifying small-molecule inhibitors from a large drug-like database. At the present time, no experimental structure has been reported for an mPGES-1-inhibitor complex, which remains as a major obstacle in structure-based virtual screening. Before the design of PGH2-competitive inhibitors of mPGES-1, the active site of the trimeric structure was studied. We recently published the construction of a three dimensional homology model of the bound state of mPGES-1 complexed with its substrate PGH2 and cofactor GSH or known inhibitors.39 We also described its potential use in generating small-molecule inhibitors of mPGES-1. However, while a crystal structure of mPGES-1 became available more recently,67 we elected not to use that structure since its compact conformation suggested an inactive form.40, 67
In an effort to address our overall objective, we first virtually screened a large database of lead compounds to retrieve putative mPGES-1 inhibitors. From that screening, we generated a primary topographical interaction model to guide the subsequent virtual screening process. Through mutational studies and comparative affinity determinations based on known compound binding,39–40 essential amino acids involved in antagonist recognition were identified. In studying additional mutational studies performed on mPGES-1 by Jegerschold et al.,67 we derived a reasonable topographical interaction model (Fig. 2). According to our homology model and these mutational data, the plausible inhibitor’s binding pocket of the mPGES-1 receptor overlaps with both the binding site of the PGH2 substrate and GSH cofactor in MPGES-1 protein.
Thus, owing to the high affinity of these known mPGES-1 inhibitors, we reasoned that novel inhibitors with differing scaffolds would need to participate in some of these key interactions and compete for and displace PGH2 from the active site. Hence, an improved virtual screening strategy was employed to identify small-molecules that favorably occupy the active site of mPGES-1 (Fig. 1).
Results from the large-scale virtual screening
In the first stage of the virtual screening protocol, the generated approximately 2.1 million structures from the database (corresponding to 345,447 compounds) were subjected to a shape-based screening technique implemented in the ROC program.47 Recent reports have shown success with ligand-based virtual screening approaches such as the ROCS in identifying the known inhibitors and in new lead identification. Because of its speed and excellent performance in previously reported virtual screening studies, ROCS was chosen as the first ligand-based virtual screening filter.68–69
In this method, two previously proven active compounds are used as query molecules in ROCS shape filter to search collections of molecules for “hits” that exhibit similar 3D shapes (Fig. 2). One of these compounds is strongly active against mPGES-1 in vitro, although both ligands are inactive in vivo. The objective of our shape filtering protocol here was to use a highly active but “compromised” compound as a template to identify novel molecular structures that exhibit similar 3D shapes but different scaffolds.
Furthermore, the reason for using two different scaffolds simultaneously is that the choice of the ligand molecule will have a critical effect on the results from ligand-based screening and the use of diverse ligands in their conformational binding state will help us to overcome the bias of using any one ligand as the query molecule. Moreover, it has reported that similarity searching is effective for recognizing active compounds within data sets of varying size and compound diversity and has been successfully used to select compounds for experimental screening, synthesis, and optimization.70–72 Our shape filtering search based on this strategy identified ~693,000 preliminary hits (workflow depicted in Fig. 1). All of these hit structures were subsequently docked into the mPGES-1 active site using the fast and rigid docking protocol implemented in FRED program.35
Results from the rigid docking of the filtered ligand set
We started the search for mPGES-1 inhibitors by performing a pharmacophore search of the generated shape-filtered database. To reduce the search space of the rigid docking procedure and to obtain only docking poses that are in agreement with experimental data, distance constraints were defined according to the interactions indicated in the Fig. 2. The search queries were generated using information from mutational residues and compounds (MK-886 and its derivative) whose structures are complexed with mPGES-1 protein.22, 39-–40 The corresponding pharmacophore model consists of three hydrogen-bond acceptors and two hydrophobic centers with a tolerance criterion of 2.5 Ǻ (Fig. 2).
All poses of the ensemble that pass the filtering steps are scored by the FRED exhaustive scoring function. The poses returned from exhaustive docking and optional optimization protocols are re-scored and ordered by consensus structure score. By using this straightforward ligand ranking, we implicitly assumed that the computed docking scores may at least partially reflect experimental binding affinities. Thus, the resulting molecular structures from several clusters match sufficiently with the template position of the reference structure. As a result, we select the top-346,000 ranked poses for further optimization and filtering process. The docking and scoring results serve as a starting point for the next step, identified as the selection strategy. The mPGES-1-ligand structures extracted from the rigid docking were subject to subsequent flexible docking simulations via MD simulations as discussed below.
Predictions from the flexible docking simulations
A critical issue in molecular docking includes the prediction of the reasonable binding pose and the estimation of the corresponding binding affinity. Despite the enormous size of the conformational space for a given ligand, current docking methodologies have been successfully employed by our group in reproducing crystallographic evidences as well as to predict putative binding modes.39, 57, 73–74
As a consequence, we selected molecular structures that could potentially fit into the binding pocket based on the pharmacophore model criteria, shape complementarity (Fig. 1 workflow) and characterized by a similar docking mode in the putative binding site of the mPGES-1. The conformational flexibility of the selected molecular candidates and mPGES-1 was further taken into account, according to the Flexible Docking procedure described in Methods Section.
All resulting mPGES-1-ligand complexes were further refined by conducting energy-minimization followed by 20 ps MD simulations in implicit solvent model and the final ligand binding structures were ranked according to the binding free energies obtained from the MM-GBSA calculations.
Thus, in the initial 20 ps of the MD simulation of the mPGES-1 complexed with the reference compound structures 1 and 2, the computed binding energy was ΔGGBSA(1) = −38.1 kcal/mol and ΔGGBSA(2) = −43.1 kcal/mol, respectively. Therefore, all structures with a threshold of −20 kcal/mol or lower were assembled to create a data set consisting of ~47,000 non-redundant compounds (Fig. 1). These simulated complexes were re-submitted for 100 ps MD simulations and re-scored (Fig. 3). Among them, 21 compounds with a top docking score (ΔGbindGBSA) were selected for in vitro activity tests against mPGES-1 (see Table S1 in Sup. Inf. for molecular structures).
Figure 3.
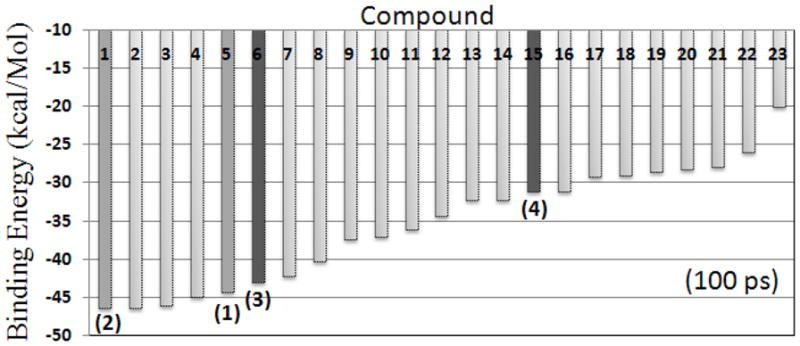
Diagram view of the scored ligands (21 compounds + 2 references), i.e. compounds 1 to 23, according to the calculated binding energies (ΔGbindGBSA) after 100-ps MD simulation in an implicit solvent model. The references (1 and 2) and the currently identified new active compounds (3 and 4) are indicated.
Inhibitory activity against mPGES-1
All 21 compounds were assayed in vitro for their inhibitory activity against recombinant mPGES-1. The initial in vitro assays were performed with a single concentration (10 μM) of the inhibitor for all of the 21 compounds. Each of the 21 compounds at 10 μM assayed showed some inhibitory activity against mPGES-1, ~10% to 83% inhibition of the mPGES-1 activity (see Table 1). The most potent two compounds, i.e. 3 and 4, inhibited the enzyme activity of mPGES-1 for ~83%. These two compounds were further assayed with varying concentrations to determine their IC50 against mPGES-1, showing that IC50 = 3.5 μM for compound 3 and IC50 = 4.6 μM for compound 4. The same in vitro activity protocol was also performed for compound 1, and we obtained IC50 = 2.6 μM for compound 1. Our determined IC50 value of 2.6 μM for compound 1 is slightly larger than the previously reported IC50 value of 1.6 μM.22 The in vitro data show that the predictions from the virtual screening were not perfect, but it did lead to identification of the new hits with novel scaffolds.
Table 1.
The estimated binding energies (ΔGbind in kcal/mol) and experimentally determined actual inhibitory activity of the 21 compounds selected from the virtual screening. Standard Deviation of ΔGbind is in parentheses.
| Compound | ΔGbind (Calc.) | Inhibition % at 10 μMa | IC50 (μM) |
|---|---|---|---|
| 3 | −42.93 (±1.21) | 83% | 3.5 |
| 4 | −31.14 (±0.98) | 83% | 4.6 |
| 5 | −46.32 (±1.10) | 45% | - |
| 6 | −46.02 (±1.11) | 20% | - |
| 7 | −45.00 (±0.89) | 38% | - |
| 8 | −42.17 (±1.30)) | 15% | - |
| 9 | −40.34 (±1.14) | 26% | - |
| 10 | −37.32 (±0.97) | 28% | - |
| 11 | −36.98 (±1.11) | 43% | - |
| 12 | −36.06 (±1.13) | 31% | - |
| 13 | −34.33 (±1.10) | 34% | - |
| 14 | −32.28 (±1.00) | 50% | - |
| 15 | −32.27 (±1.21) | 40% | - |
| 16 | −31.12 (±1.13) | 41% | - |
| 17 | −29.15 (±1.24) | 39% | - |
| 18 | −28.97 (±1.27) | 10% | - |
| 19 | −28.60 (±0.98) | 12% | - |
| 20 | −28.28 (±1.28) | 36% | - |
| 21 | −27.84 (±1.21) | 45% | - |
| 22 | −25.94 (±1.13) | 16% | - |
| 23 | −19.35 (±1.15) | 39% | - |
The inhibition was based on the measured decrease in the concentration of the produced reaction product.
Binding modes of mPGES-1 with the new hits according to the MD simulations in the implicit solvent
Based on the identification of the new hits with novel scaffolds, we further analyzed the detailed binding modes for mPGES-1 binding with the computationally selected compounds (particularly those depicted in Fig. 4), as understanding the binding modes of the hits will be of great help in further lead identification and optimization studies in the future. The simulated binding structures revealed that the carboxyl moiety of the compounds in both structures form salt bridges with Arg110 side chain and hydrogen bond with Thr129, while the (Z)-5-benzylidene-2-iminothiazolidin-4-one (compound 3) or phenyl acrylic acid (compound 4) ring (scaffold) binds at the interface between the first two subunits of the homotrimeric mPGES-1 enzyme. Figs. 5 & 6 show the binding modes of these compounds with mPGES-1.
Figure 4.

Molecular structures of novel mPGES-1 inhibitors (compounds 3 and 4) identified by virtual screening. (IC50(3) = 3.5 μM, IC50(4) = 4.6 μM). The scaffold ((Z)-5-benzylidene-2-iminothiazolidin-4-one) of compound 3 is also displayed.
Figure 5.

Views of the binding mode for the MD-simulated structures of compounds 3 and 4 in the active site of mPGES-1 trimer.
Figure 6.

Views from two different orientations of the binding mode for the MD-simulated structure of compound 4 in the active site of mPGES-1 trimer. Solvent accessible surface area of the active site of mPGES-1–4 complex is also displayed.
Inspection of the MD trajectories revealed that the RMSD of the positions of the heavy atoms in both compounds 3 and 4 from those in the initial structure was small, ~0.5 Å. The compounds fit into the pocket by establishing strong electrostatic interactions with the guanidinium of Arg110 and hydroxyl group of Thr129 side chain. The scaffold ring of each compound is stabilized in the pocket by two π–π stacking interactions with His72′ (i.e. His72 of the second subunit of the trimer) and Arg126 residues, while the N-phenyl group of 3 or S-phenyl(Methyl) group of 4 plugs into a positively charged pocket surrounded by the side chains of Arg73, Arg73′ (i.e. Arg73 of the second subunit of the trimer), Arg73″ (i.e. Arg73 of the third subunit of the trimer), and Met76′ (i.e. Met76 of the second subunit of the trimer) (Figs. 5 & 6). In addition, two significant dipole-quadrupole interactions are also observed between the scaffold ring of the compounds and residues Arg126 and Arg73.
As observed in all virtual screening projects, the presence of the “false positive” inhibitors in the final set of 21 selected compounds may be due to the protein side-chain distortion and/or uncertain ligand binding mode that could overestimate the binding affinity of a ligand with mPGES-1. In addition, the limitations of the docking scoring function associated with the inaccuracy in the estimation of intramolecular, desolvation, and conformational entropy penalties may overestimate the binding affinity of the ligand. Another possible factor is associated with the lack of a term in the MM-GBSA scoring that describes enthalpy-entropy compensation. A comparative molecular docking study conducted by Wang et al.75 demonstrated that the performance of different scoring functions is influenced by the nature of the protein ligand interactions. In other words, the scoring functions tuned to a wide variety of binding sites fail quite frequently, unless some weighting factors or some force field parameters are corrected on a case-by-case basis.
Binding free energies estimated from the MD simulations in aqueous solution
In order to more reasonably simulate the binding modes and binding free energies of compounds 2 to 4, for each inhibitor we further performed 1 ns MD simulations on the explicitly solvated system to relax the binding complex and obtain deeper insights into the positioning of the inhibitor in the mPGES-1 trimer. In this procedure, the computational binding free energy data (ΔGbindGBSA and ΔGbindPBSA) were not intended to reproduce the exact binding free energies of the compounds as measured experimentally. Here, our objective was to provide a detailed energetic estimate of the interactions between compounds (2 to 4) and the key residues in the binding cavity of mPGES-1-ligand complex.
A detailed check of the simulated binding structures revealed that the MD simulations in aqueous solution did not significantly change the binding structures. The calculated binding free energies of the active compounds and contributions from vdW, electrostatic interaction, and solvation using the single MD trajectory and MM-PBSA method are listed in Table 2. The detailed analysis of the energetic terms suggests that the major favorable contributions to the binding are vdW and electrostatic terms, whereas polar solvation energies oppose binding. On the other hand, nonpolar solvation free energies contribute favorably, albeit slightly. As seen in Table 2, the predicted binding free energies are qualitatively consistent with the experimental data (the relative magnitudes of the IC50 values) in terms of the ranking, i.e. ΔGbind(2) < ΔGbind(3) < ΔGbind(4) corresponding to IC50(2) < IC50(3) < IC50(4).
Table 2.
Components of the binding free energies (kcal/mol) of compounds 2 to 4 with mPGES-1. Standard Deviation of ΔGbindCalc is in parentheses. The experimental binding affinities, IC50 (μM) and ΔGbindExp are also reported. ΔGbindExp (kcal/mol) = −RTln(Kd) ≈ −RTln (IC50), where R is the ideal gas constant and T is the temperature in K.
| (2) | (3) | (4) | |
|---|---|---|---|
| ΔEvdW | −62.51 (±0.71) | −63.77 (±0.35) | −47.03 (±0.62) |
| ΔECoul | −175.55 (±0.45) | −172.49 (±0.71) | −163.32 (±0.84) |
| ΔEReac. field | 174.06 (±0.58) | 181.03 (±0.64) | 164.92 (±0.68) |
| ΔECavity | −11.28 (±0.10) | −11.07 (±0.09) | −8.44 (±0.11) |
| ΔGbindCalc. | −10.78 (±0.65) | −9.84 (±0.58) | −8.53 (±0.71) |
|
| |||
| IC50 (μM) | 0.007 | 3.5 | 4.6 |
|
| |||
| ΔGbindExp | −11.13 (±) | −7.44 | −7.29 |
The experimental value for 2 is from reference:22
Decomposition of binding free energy on a per-residue basis
In order to gain a better understanding of the origin of the interaction energy between the ligands and the residues in the mPGES-1 binding pocket, we carried out MM-GBSA decomposition analysis on the binding energies following the MD simulation in aqueous solution. The energy decomposition is used to probe which residues generate significant intermolecular contributions to the binding ligands (2, 3, and 4) and serves as a more computationally efficient alternative to the computational alanine scanning mutagenesis. The per-atom contributions can be summed over atomic groups such as residues, backbones, and side chains to obtain their contributions to the total binding free energy. Summarized in Table 3 (and Table S2 in Sup. Inf.) are the decomposition of ΔGgas+solv on a per-residue basis for mPGES-1.
Table 3.
Decomposition of ΔGbindGBSA (kcal/mol) on a per-residue basis for the interaction of compounds 2, 3, and 4 with mPGES-1 (see Sup. Inf. for the detailed results). The key residues are displayed in bold.
| (2) | (3) | (4) | |
|---|---|---|---|
| R110 | −5.09 | −2.12 | −2.49 |
| T129 | −2.07 | −0.73 | −1.26 |
| R126 | −0.87 | −0.85 | −1.19 |
| I125 | −1.07 | −1.05 | −0.90 |
| Y117 | 0.01 | −0.27 | −0.01 |
| H72′ | −0.97 | −0.23 | 0.02 |
| L69′ | −0.97 | −1.66 | −0.65 |
| M76′ | −0.91 | −0.87 | −0.68 |
| Y80′ | −0.56 | −0.51 | 1.05 |
| R73′ | −2.12 | −1.35 | −0.92 |
| R73″ | −0.12 | −0.02 | 0.01 |
| R73 | −4.51 | −2.61 | −2.93 |
| E77 | 4.88 | 0.98 | 3.75 |
As observed for mPGES-1 binding with compound 2,39 the ligand binding is also driven by the salt bridges between the carboxylate group of the ligand and the Arg110 and Thr129 side chains of mPGES-1 as well as by hydrophobic-hydrophobic interactions between the phenyl group of the ligand and the binding cavity formed by the Arg73, Arg73′, and Arg73″ side chains of mPGES-1. These interactions are accompanied by the π-π interaction between the scaffold of the ligand and the H72′ side chain.
The decomposition of the binding energy of the mPGES-1–2 complex showed that Arg110 and Thr129 have the major contributions to the binding affinity of 2 (or 1) carboxylate group, whereas H72′ is important for the ligand scaffold stability. The affinity of the ligand to mPGES-1 is improved by the strong interaction of Arg73 and Arg73′ side chains. To gain better insight into the interactions of compounds 3 and 4 in the mPGES-1 binding pocket, we compared the decomposition of the binding energies of these ligands with that of 2. From the analysis of the data in Table 3, we observed that the Arg73, Arg73′, Leu69′, Arg110, and Thr129 residues showed the largest contributions, suggesting that they play an important role in the ligand binding due primarily to the electrostatic energy term ΔEelec (Table S2 in Sup. Inf.). The contributions of the Arg73 and Arg73′ residues arise more from the side chains than the backbone atoms and are recognized as critical residues (Figs. 5 & 6). Ignoring van der Waals contacts, electrostatic interactions from the side chain of these residues contribute substantially to the binding free energy (Table 3). Arg73 contributes −.51 kcal/mol to the binding affinity of 2, which originates from the guanidinium side chain, according to the free energy decomposition.
Interestingly, the results of the energy decomposition show that most of the contribution of Arg73 and Arg73′ for binding comes from electrostatic interaction and also appears to favor the 3 and 4 binding, but to a lesser extent (−2.7 kcal/mol). Thus, in comparison with the Cl-phenyl group of 1 or 2, the missing Cl atom or the presence of a methyl group at position para to the ligand phenyl group decreased the binding contribution of the residues in the cavity due to the loss of a favorable electrostatic interaction between the ligand and the Arg73 and Arg73′ side chains. This is in excellent agreement with the experimental data of Riendeau et al.22 where the substitution of the Cl atom of the phenyl group by hydrogen or methyl group decreased dramatically the binding affinity of the compound 1 to the mPGES-1 enzyme.22 Therefore, these results may reasonably explain why the binding affinity of compounds 3 and 4 to mPGES-1 is lower than that of compound 2.
More importantly, we noted some common protein-inhibitor interactions in the simulated mPGES-1-inhibitor complexes for (compounds 2 to 4). In particular, the scaffolds of compounds 2 to 4 are all stabilized by the π-π stacking interaction with the H72′ ring while, on the opposite side, the carboxylate Glu77 side chain contributes unfavorably to the mPGES-1-ligand binding. The results of the structure-based drug design associated with the binding energy decomposition highlighted two new scaffolds (i.e. (Z)-5-benzylidene-2-iminothiazolidin-4-one and phenyl acrylic groups) with up to 5-fold less unfavorable interaction energy with the key Glu77 residues of the mPGES-1 binding cavity. Indeed, the carboxylate group of Glu77 side chain added an unfavorable +4.88 kcal/mol contribution to the binding free energy, derived mostly from the electrostatic term (ΔΔEelec = +17.33 kcal/mol) with 2, while the same residue contributed +3.75 kcal/mol for 4, and only +1.0 kcal/mol for 3 compound binding (Table 3 and Table S2 in Sup. Inf.). As a result, based on the mPGES-1-inhibitor binding modes, the novel (Z)-5-benzylidene-2-iminothiazolidin-4-one scaffold of compound 3 may be used as new starting point in future de novo drug design and discovery efforts.
Conclusion
A robust virtual screening cascade protocol coupled with biochemical assays was applied to identify new inhibitors of human mPGES-1. The protocol, which is a combination of large-scale structure-based virtual screening, flexible docking, molecular dynamics simulations, and binding free energy calculations, was based on the use of our previously modeled trimeric structure of mPGES-1 in its open state. The combined computational and experimental studies have led to identification of novel mPGES-1 inhibitors, including compound 3 (IC50 = 3.5 μM) and compound 4 (IC50 = 4.6 μM), with new scaffolds. The positive experimental results suggest that the modeled trimeric structure of mPGES-1 in its open state and the simulated enzyme-inhibitor binding mode are ready for the structure-based drug design and discovery. A detailed analysis of the binding structures and the corresponding energetics reveals valuable clues for future rational design of new, more potent inhibitors of mPGES-1 starting from the identified new hits.
Supplementary Material
Acknowledgments
This work was supported in part by the NIH (grant RC1MH088480 to C.-G. Zhan). The authors also acknowledge the Center for Computational Sciences (CCS) at University of Kentucky for supercomputing time on IBM X-series Cluster with 340 nodes or 1,360 processors and a Dell Supercomputer Cluster consisting of 388 nodes or 4,816 processors.
Footnotes
Supplementary material. Two additional tables for molecular structures of the 21 compounds selected from the virtual screening (Table S1) and for more detailed energetic results from the binding energy decomposition (Table S2).
Publisher's Disclaimer: This is a PDF file of an unedited manuscript that has been accepted for publication. As a service to our customers we are providing this early version of the manuscript. The manuscript will undergo copyediting, typesetting, and review of the resulting proof before it is published in its final citable form. Please note that during the production process errors may be discovered which could affect the content, and all legal disclaimers that apply to the journal pertain.
References
- 1.Serhan CN, Levy B. Proc Natl Acad Sci U S A. 2003;100:8609. doi: 10.1073/pnas.1733589100. [DOI] [PMC free article] [PubMed] [Google Scholar]
- 2.Kudo I, Murakami M. J Biochem Mol Biol. 2005;38:633. doi: 10.5483/bmbrep.2005.38.6.633. [DOI] [PubMed] [Google Scholar]
- 3.Fahmi H. Current Opinion in Rheumatology. 2004;16:623. doi: 10.1097/01.bor.0000129664.81052.8e. [DOI] [PubMed] [Google Scholar]
- 4.Park JY, Pillinger MH, Abramson SB. Clinical Immunology. 2006;119:229. doi: 10.1016/j.clim.2006.01.016. [DOI] [PubMed] [Google Scholar]
- 5.Murakami M, Nakatani Y, Tanioka T, Kudo I. Prostaglandins Other Lipid Mediators. 2002;68–9:383. doi: 10.1016/s0090-6980(02)00043-6. [DOI] [PubMed] [Google Scholar]
- 6.Murakami M, Naraba H, Tanioka T, Semmyo N, Nakatani Y, Kojima F, Ikeda T, Fueki M, Ueno A, Oh-ishi S, Kudo I. J Biol Chem. 2000;275:32783. doi: 10.1074/jbc.M003505200. [DOI] [PubMed] [Google Scholar]
- 7.Uematsu S, Matsumoto M, Takeda K, Akira S. Journal of Immunology. 2002;168:5811. doi: 10.4049/jimmunol.168.11.5811. [DOI] [PubMed] [Google Scholar]
- 8.Kamei D, Murakami M, Nakatani Y, Ishikawa Y, Ishii T, Kudo I. Journal of Biological Chemistry. 2003;278:19396. doi: 10.1074/jbc.M213290200. [DOI] [PubMed] [Google Scholar]
- 9.Kamei D, Yamakawa K, Takegoshi Y, Mikami-Nakanishi M, Nakatani Y, Oh-ishi S, Yasui H, Azuma Y, Hirasawa N, Ohuchi K, Kawaguchi H, Ishikawa Y, Ishii T, Uematsu S, Akira S, Murakami M, Kudo I. Journal of Biological Chemistry. 2004;279:33684. doi: 10.1074/jbc.M400199200. [DOI] [PubMed] [Google Scholar]
- 10.Ikeda-Matsuo Y, Ota A, Fukada T, Uematsu S, Akira S, Sasaki Y. Proceedings of the National Academy of Sciences of the United States of America. 2006;103:11790. doi: 10.1073/pnas.0604400103. [DOI] [PMC free article] [PubMed] [Google Scholar]
- 11.Murakami M, Kudo I. Progress in Lipid Research. 2004;43:3. doi: 10.1016/s0163-7827(03)00037-7. [DOI] [PubMed] [Google Scholar]
- 12.Claveau D, Sirinyan M, Guay J, Gordon R, Chan CC, Bureau Y, Riendeau D, Mancini JA. Journal of Immunology. 2003;170:4738. doi: 10.4049/jimmunol.170.9.4738. [DOI] [PubMed] [Google Scholar]
- 13.Oshima H, Oshima M, Inaba K, Taketo MM. EMBO Journal. 2004;23:1669. doi: 10.1038/sj.emboj.7600170. [DOI] [PMC free article] [PubMed] [Google Scholar]
- 14.Friesen RW, Mancini JA. Journal of Medicinal Chemistry. 2008;51:4059. doi: 10.1021/jm800197b. [DOI] [PubMed] [Google Scholar]
- 15.Samuelsson B, Morgenstern R, Jakobsson PJ. Pharmacological Reviews. 2007;59:207. doi: 10.1124/pr.59.3.1. [DOI] [PubMed] [Google Scholar]
- 16.Scholich K, Geisslinger G. Trends in Pharmacological Sciences. 2006;27:399. doi: 10.1016/j.tips.2006.06.001. [DOI] [PubMed] [Google Scholar]
- 17.Cheng Y, Wang M, Yu Y, Lawson J, Funk CD, FitzGerald GA. Journal of Clinical Investigation. 2006;116:1391. doi: 10.1172/JCI27540. [DOI] [PMC free article] [PubMed] [Google Scholar]
- 18.Engblom D, Saha S, Engstrom L, Westman M, Audoly LP, Jakobsson PJ, Blomqvist A. Nature Neuroscience. 2003;6:1137. doi: 10.1038/nn1137. [DOI] [PubMed] [Google Scholar]
- 19.Trebino CE, Stock JL, Gibbons CP, Naiman BM, Wachtmann TS, Umland JP, Pandher K, Lapointe JM, Saha S, Roach ML, Carter D, Thomas NA, Durtschi BA, McNeish JD, Hambor JE, Jakobsson PJ, Carty TJ, Perez JR, Audoly LP. Proceedings of the National Academy of Sciences of the United States of America. 2003;100:9044. doi: 10.1073/pnas.1332766100. [DOI] [PMC free article] [PubMed] [Google Scholar]
- 20.Thoren S, Jakobsson PJ. Eur J Biochem. 2000;267:6428. doi: 10.1046/j.1432-1327.2000.01735.x. [DOI] [PubMed] [Google Scholar]
- 21.Mancini JA, Blood K, Guay J, Gordon R, Claveau D, Chan CC, Riendeau D. J Biol Chem. 2001;276:4469. doi: 10.1074/jbc.M006865200. [DOI] [PubMed] [Google Scholar]
- 22.Riendeau D, Aspiotis R, Ethier D, Gareau Y, Grimm EL, Guay J, Guiral S, Juteau H, Mancini JA, Methot N, Rubin J, Friesen RW. Bioorg Med Chem Lett. 2005;15:3352. doi: 10.1016/j.bmcl.2005.05.027. [DOI] [PubMed] [Google Scholar]
- 23.De Simone R, Chini MG, Bruno I, Riccio R, Mueller D, Werz O, Bifulco G. Journal of Medicinal Chemistry. 2011;54:1565. doi: 10.1021/jm101238d. [DOI] [PubMed] [Google Scholar]
- 24.Quraishi O, Mancini JA, Riendeau D. Biochem Pharmacol. 2002;63:1183. doi: 10.1016/s0006-2952(02)00844-4. [DOI] [PubMed] [Google Scholar]
- 25.Shoichet BK. Nature. 2004;432:862. doi: 10.1038/nature03197. [DOI] [PMC free article] [PubMed] [Google Scholar]
- 26.Abagyan R, Totrov M. Curr Opin Chem Biol. 2001;5:375. doi: 10.1016/s1367-5931(00)00217-9. [DOI] [PubMed] [Google Scholar]
- 27.Doman TN, McGovern SL, Witherbee BJ, Kasten TP, Kurumbail R, Stallings WC, Connolly DT, Shoichet BK. J Med Chem. 2002;45:2213. doi: 10.1021/jm010548w. [DOI] [PubMed] [Google Scholar]
- 28.Rastelli G, Pacchioni S, Sirawaraporn W, Sirawaraporn R, Parenti MD, Ferrari AM. J Med Chem. 2003;46:2834. doi: 10.1021/jm030781p. [DOI] [PubMed] [Google Scholar]
- 29.Kitchen DB, Decornez H, Furr JR, Bajorath J. Nat Rev Drug Discovery. 2004;3:935. doi: 10.1038/nrd1549. [DOI] [PubMed] [Google Scholar]
- 30.Congreve M, Murray CW, Blundell TL. Drug Discovery Today. 2005;10:895. doi: 10.1016/S1359-6446(05)03484-7. [DOI] [PubMed] [Google Scholar]
- 31.Alonso H, Bliznyuk AA, Gready JE. Med Res Rev. 2006;26:531. doi: 10.1002/med.20067. [DOI] [PubMed] [Google Scholar]
- 32.Cross JB, Thompson DC, Rai BK, Baber JC, Fan KY, Hu Y, Humblet C. Journal of Chemical Information and Modeling. 2009;49:1455. doi: 10.1021/ci900056c. [DOI] [PubMed] [Google Scholar]
- 33.Liebeschuetz JW. Journal of Computer-Aided Molecular Design. 2008;22:229. doi: 10.1007/s10822-008-9169-8. [DOI] [PubMed] [Google Scholar]
- 34.Graves AP, Shivakumar DM, Boyce SE, Jacobson MP, Case DA, Shoichet BK. Journal of Molecular Biology. 2008;377:914. doi: 10.1016/j.jmb.2008.01.049. [DOI] [PMC free article] [PubMed] [Google Scholar]
- 35.Fred V. 2007 www.eyesopen.com.
- 36.Shoichet BK, Bodian DL, Kuntz ID. Journal of Computational Chemistry. 1992;13:380. [Google Scholar]
- 37.Meng EC, Shoichet BK, Kuntz ID. Journal of Computational Chemistry. 1992;13:505. [Google Scholar]
- 38.Kuntz ID, Blaney JM, Oatley SJ, Langridge R, Ferrin TE. Journal of Molecular Biology. 1982;161:269. doi: 10.1016/0022-2836(82)90153-x. [DOI] [PubMed] [Google Scholar]
- 39.Hamza A, AbdulHameed MDM, Zhan CG. J Phys Chem B. 2008;112:7320. doi: 10.1021/jp8007688. [DOI] [PubMed] [Google Scholar]
- 40.Hamza A, Tong M, AbdulHameed MD, Liu J, Goren AC, Tai HH, Zhan CG. J Phys Chem B. 2010;114:5605. doi: 10.1021/jp100668y. [DOI] [PMC free article] [PubMed] [Google Scholar]
- 41.Roersch F, Wobst I, Zettl H, Schubert-Zsilavecz M, Groesch S, Geisslinger G, Schneider G, Proschak E. Journal of Medicinal Chemistry. 2010;53:911. doi: 10.1021/jm9012505. [DOI] [PubMed] [Google Scholar]
- 42.Waltenberger B, Wiechmann K, Bauer J, Markt P, Noha SM, Wolber G, Rollinger JM, Werz O, Schuster D, Stuppner H. Journal of Medicinal Chemistry. 2011;54:3163. doi: 10.1021/jm101309g. [DOI] [PMC free article] [PubMed] [Google Scholar]
- 43.Omega-22. 2007 www.eyesopen.com.
- 44.Bostrom J. J Comput-Aided Mol Des. 2001;15:1137. doi: 10.1023/a:1015930826903. [DOI] [PubMed] [Google Scholar]
- 45.Bostrom J, Greenwood JR, Gottfries J. J Mol Graphics Modell. 2003;21:449. doi: 10.1016/s1093-3263(02)00204-8. [DOI] [PubMed] [Google Scholar]
- 46.Rush TS, Grant JA, Mosyak L, Nicholls A. J Med Chem. 2005;48:1489. doi: 10.1021/jm040163o. [DOI] [PubMed] [Google Scholar]
- 47.ROCS V. 2007 www.eyesopen.com.
- 48.McGann MR, Almond HR, Nicholls A, Grant JA, Brown FK. Biopolymers. 2003;68:76. doi: 10.1002/bip.10207. [DOI] [PubMed] [Google Scholar]
- 49.Eldridge MD, Murray CW, Auton TR, Paolini GV, Mee RP. J Comput-Aided Mol Des. 1997;11:425. doi: 10.1023/a:1007996124545. [DOI] [PubMed] [Google Scholar]
- 50.Gehlhaar DK, Verkhivker GM, Rejto PA, Sherman CJ, Fogel DB, Fogel LJ, Freer ST. Chem Biol. 1995;2:317. doi: 10.1016/1074-5521(95)90050-0. [DOI] [PubMed] [Google Scholar]
- 51.Stahl M, Rarey M. J Med Chem. 2001;44:1035. doi: 10.1021/jm0003992. [DOI] [PubMed] [Google Scholar]
- 52.Case DA, Darden TA, Cheatham TE, Simmerling CL, Wang J, Duke RE, Luo R, Crowley M, Walker RC, Zhang W, Merz KM, Wang B, Hayik S, Roitberg A, Seabra G, Kolossváry I, Wong KF, Paesani F, Vanicek J, Wu X, Brozell SR, Steinbrecher T, Gohlke H, Yang L, Tan C, Mongan J, Hornak V, Cui G, Mathews DH, Seetin MG, Sagui C, Babin V, Kollman PA. San Francisco, CA: University of California; 2008. [Google Scholar]
- 53.Wang JM, Wolf RM, Caldwell JW, Kollman PA, Case DA. Journal of Computational Chemistry. 2004;25:1157. doi: 10.1002/jcc.20035. [DOI] [PubMed] [Google Scholar]
- 54.Guenot J, Kollman PA. Protein Sci. 1992;1:1185. doi: 10.1002/pro.5560010912. [DOI] [PMC free article] [PubMed] [Google Scholar]
- 55.Harvey SC. Proteins-Structure Function and Genetics. 1989;5:78. [Google Scholar]
- 56.Fairchild SZ, Peterson MW, Hamza A, Zhan CG, Cerasoli DM, Chang WE. Journal of Molecular Modeling. 2010 doi: 10.1007/s00894-010-0693-9. [DOI] [PubMed] [Google Scholar]
- 57.Hamza A, Zhan CG. J Phys Chem B. 2009;113:2896. doi: 10.1021/jp8082612. [DOI] [PubMed] [Google Scholar]
- 58.Zhang T, Hamza A, Cao XH, Wang B, Yu SW, Zhan CG, Sun DX. Mol Cancer Ther. 2008;7:162. doi: 10.1158/1535-7163.MCT-07-0484. [DOI] [PubMed] [Google Scholar]
- 59.Berendsen HJC, Postma JPM, Vangunsteren WF, Dinola A, Haak JR. J Chem Phys. 1984;81:3684. [Google Scholar]
- 60.Ryckaert JP, Ciccotti G, Berendsen HJC. J Comput Phys. 1977;23:327. [Google Scholar]
- 61.Darden T, York D, Pedersen L. J Chem Phys. 1993;98:10089. [Google Scholar]
- 62.Naim M, Bhat S, Rankin KN, Dennis S, Chowdhury SF, Siddiqi I, Drabik P, Sulea T, Bayly CI, Jakalian A, Purisima EO. J Chem Inf Model. 2007;47:122. doi: 10.1021/ci600406v. [DOI] [PubMed] [Google Scholar]
- 63.Kollman PA, Massova I, Reyes C, Kuhn B, Huo SH, Chong L, Lee M, Lee T, Duan Y, Wang W, Donini O, Cieplak P, Srinivasan J, Case DA, Cheatham TE. Acc Chem Res. 2000;33:889. doi: 10.1021/ar000033j. [DOI] [PubMed] [Google Scholar]
- 64.Purisima EO. J Comput Chem. 1998;19:1494. [Google Scholar]
- 65.Chen W, Chang CE, Gilson MK. Biophys J. 2004;87:3035. doi: 10.1529/biophysj.104.049494. [DOI] [PMC free article] [PubMed] [Google Scholar]
- 66.Huang XQ, Yan WL, Gao DQ, Tong M, Tai H-H, Zhan C-G. Bioorg Med Chem. 2006;14:3553. doi: 10.1016/j.bmc.2006.01.010. [DOI] [PubMed] [Google Scholar]
- 67.Jegerschold C, Paweizik SC, Purhonen P, Bhakat P, Gheorghe KR, Gyobu N, Mitsuoka K, Morgenstern R, Jakobsson PJ, Hebert H. Proc Natl Acad Sci U S A. 2008;105:11110. doi: 10.1073/pnas.0802894105. [DOI] [PMC free article] [PubMed] [Google Scholar]
- 68.Venhorst J, Nunez S, Terpstra JW, Kruse CG. J Med Chem. 2008;51:3222. doi: 10.1021/jm8001058. [DOI] [PubMed] [Google Scholar]
- 69.Hawkins PCD, Skillman AG, Nicholls A. J Med Chem. 2007;50:74. doi: 10.1021/jm0603365. [DOI] [PubMed] [Google Scholar]
- 70.Franke L, Schwarz O, Muller-Kuhrt L, Hoernig C, Fischer L, George S, Tanrikulu Y, Schneider P, Werz O, Steinhilber D, Schneider G. J Med Chem. 2007;50:2640. doi: 10.1021/jm060655w. [DOI] [PubMed] [Google Scholar]
- 71.Cramer RD, Poss MA, Hermsmeier MA, Caulfield TJ, Kowala MC, Valentine MT. J Med Chem. 1999;42:3919. doi: 10.1021/jm990159q. [DOI] [PubMed] [Google Scholar]
- 72.Cramer RD, Jilek RJ, Guessregen S, Clark SJ, Wendt B, Clark RD. J Med Chem. 2004;47:6777. doi: 10.1021/jm049501b. [DOI] [PubMed] [Google Scholar]
- 73.Hamza A, Zhan CG. J Phys Chem B. 2006;110:2910. doi: 10.1021/jp0550762. [DOI] [PubMed] [Google Scholar]
- 74.Bargagna-Mohan P, Hamza A, Kim YE, Ho YKA, Mor-Valknin N, Wendschlag N, Li JJ, Evans RM, Markovitz DM, Zhan CG, Kim KB, Mohan R. Chem Biol. 2007;14:623. doi: 10.1016/j.chembiol.2007.04.010. [DOI] [PMC free article] [PubMed] [Google Scholar]
- 75.Wang RX, Lu YP, Wang SM. J Med Chem. 2003;46:2287. doi: 10.1021/jm0203783. [DOI] [PubMed] [Google Scholar]
Associated Data
This section collects any data citations, data availability statements, or supplementary materials included in this article.