

Abstract
The influence of sex as an effect modifier of childhood lead poisoning has received little systematic attention. Considering the paucity of information available concerning the interactive effects of lead and sex on the brain, the current study examined the interactive effects of lead and sex on gene expression patterns in the hippocampus, a structure involved in learning and memory. Male or female rats were fed either 1500 ppm lead-containing chow or control chow for 30 days beginning at weaning. Blood lead levels were 26.7 ± 2.1 μg/dl and 27.1 ± 1.7 μg/dl for females and males, respectively. The expression of 175 unique genes was differentially regulated between control male and female rats. A total of 167 unique genes were differentially expressed in response to lead in either males or females. Lead exposure had a significant effect without a significant difference between male and female responses in 77 of these genes. In another set of 71 genes, there were significant differences in male vs. female response. A third set of 30 genes was differentially expressed in opposite directions in males vs. females, with the majority of genes expressed at a lower level in females than in males. Highly differentially expressed genes in males and females following lead exposure were associated with diverse biological pathways and functions. These results show that a brief exposure to lead produced significant changes in expression a variety of genes in the hippocampus and that the response of the brain to a given lead exposure may vary depending on sex.
Keywords: rat, lead, hippocampus, mRNA, sex
Introduction
Despite major initiatives to reduce environmental sources of exposure, lead poisoning remains an important public health problem in the United States and around the world. Although the toxic effects of lead have been known for centuries, it is only relatively recently that the effects of childhood lead exposure have become an issue of public health concern (Pueschel et al. 1996). Based on epidemiological and experimental studies conducted over the past 50 years there has been a gradual decrease in what is generally accepted as a “safe” level of lead exposure. Using venous blood lead levels as an index, the upper acceptable blood lead limit for children in the early 1960s was 60μg/dl; in 1970 it was lowered to 40μg/dl; in 1975 to 30μg/dl; in 1985 to 25μg/dl and finally, in 1991, to 10μg/dl. However, data obtained over the last decade suggest detrimental effects of lead on cognition and behavior at blood levels < 5μg/dl and that there may be no threshold or “safety margin at existing exposures” (Koller et al. 2004) for the detrimental effects of lead on the brain and behavior (Lanphear et al. 2000; 2002; 2004; Chiodo et al. 2004). In addition, childhood lead poisoning does not have a particular “behavioral signature” (Finkelstein et al. 1998; Lidsky and Schneider 2000) and the idiosyncratic nature of lead-induced cognitive and behavioral impairments in children are believed to be due to differences in age at first exposure, maximum lead levels and duration of exposure.
The additional influence of sex as an effect modifier of childhood lead poisoning has received little systematic attention. Few clinical studies have directly examined the influence of sex on outcome following childhood lead exposure and in the ones that have, the findings were mixed. McMichael et al. (1992) found that the inverse relationships between average postnatal blood lead concentration and children’s abilities on tests of neuropsychological development assessed at 2 and 4 years of age were stronger for girls than for boys, after adjustments for a number of other possible confounding factors. Rabinowitz et al. (1991) also reported a stronger negative correlation between dentine lead levels and intelligence scores in girls than in boys. In contrast, Dietrich et al. (1987) reported greater developmental neurobehavioral deficits in males during early infancy as a result of prenatal exposures, assessed by maternal blood lead levels. Bellinger et al. (1990) also reported that boys were less able than girls to overcome early cognitive deficits associated with higher prenatal lead exposures. Tong et al. (2000) reported that girls were more sensitive to the effects of lead than boys, with the interaction between lifetime average blood lead concentration and IQ being more pronounced in girls (11 – 13 years of age) than in boys. Jedrychowski et al. (2009) assessed the relationship between very low-level prenatal lead exposure (<5 μg/dL in cord blood) and gender-specific cognitive development during the first three years of life and reported cognitive deficits in males at 3 years of age but not in females, suggesting different susceptibility to prenatal lead exposure across sex groups. Recently, the relationship between childhood lead exposure and adult brain volume using magnetic resonance imaging was examined and region-specific reductions in adult gray matter volume were found, particularly in portions of the prefrontal cortex and anterior cingulate cortex and were associated with higher childhood blood lead concentrations (Cecil et al. 2008). These findings were more pronounced for males, suggesting that childhood lead exposure has a different impact on the male brain compared to the female brain.
Few animal studies have systematically studied the influence of sex on outcome from lead exposure. Leasure et al. (2008) showed that low-level gestational lead exposure in mice resulted in several permanent male-specific motor deficits as well as late-onset obesity in males. In another study, female rats exposed to lead through gestation and lactation were more impaired in reference memory than male rats with similar lead exposures (Jett et al. 1997). De Souza Lisboa et al. (2005) reported that exposure to lead during both pregnancy and lactation induced produced depressive-like behavior (detected in the forced swimming test) in female but not male rats. In another study (Soeiro et al. 2007), exposure of mice to 50 and 500 ppm lead acetate from weaning to adulthood induced what was described as an anti-depressant-like effect in both male and female mice, whereas exposure to 500 ppm lead acetate induced an anxiogenic effect only in male mice. The combined effects of lead and stress have been well-documented and are potentiated in female rats (Cory-Slechta et al. 2004).
Considering the potential importance of the influence of sex on outcome following lead exposure and the paucity of information available concerning the interaction of lead and sex on the brain, the current study was performed to assess the effects of lead on gene expression patterns in one brain structure, the hippocampus, a region known to be sensitive to the effects of lead exposure and a brain region that has been well-studied for several decades in relation to effects of lead on its structure and function.
Materials and Methods
Animals
The treatment of animals was in compliance with NIH guidelines for the care and use of laboratory animals and the study approved by the institutional animal care and use committee at Thomas Jefferson University. Thirty-one Long Evans rats, 16 male and 15 female (Harlan Labs), were divided into two groups (lead exposed or control) of four per gender on postnatal day 25 (animals were weaned on postnatal day 21 at Harlan Labs). Animals received either lead-containing chow (Purina RMH 1000 compounded with 1500 ppm lead acetate) or control chow (Purina RMH 1000) ad libitum for 30 days prior to being euthanized. At the start of the exposure period the weight range for control animals was 42g - 53g for males and 33g - 46g for females; the weight ranges for animals assigned to lead exposure was 44g - 52g for males and 33g - 47g for females. All animals were exposed to a 12h:12h light:dark cycle for the duration of the experiment. Other than their differences in diet, all animals were housed and handled in exactly the same manner during the study and prepared as two independent cohorts with 4 animals per gender and experimental group in each cohort. Animals were euthanized on postnatal day 55 by decapitation and hippocampi were rapidly removed, flash frozen on dry ice and stored at −80°C until processed.
Blood samples were collected at the time of euthanasia from all animals and analyzed for lead levels by graphite furnace atomic absorption with Zeeman background correction (ESA Labs, MA).
RNA extraction and processing
Total RNA was extracted from the hippocampus using the Qiagen RNeasy Kit according to the manufacturers protocol (Valencia, CA). Briefly, samples were homogenized in a micro-pestle and mortar (Kontes Inc) prior to being processed though spin columns. All samples were then assessed for quantity/quality and purity using both an Agilent 2100 Bioanlayzer and a GE Nanovue spectrophotometer prior to further processing. Acceptance criteria for RNA extraction was a 260nm/280nm ratio of 2.0 by UV analysis and a RNA integrity number of greater than 8.5 on the Bioanalyzer. RNA was amplified using the affymetrix (Santa Clara, CA) HT one-cycle target labeling kit using 1μg total RNA to make 15μg cRNA and the labeled RNA samples were hybridized to Affymetrix Rat Gene 1.0 ST RNA Arrays using standard methods according to Affymetrix at the Cancer Genomics Laboratory, Kimmel Cancer Center, Thomas Jefferson University.
Microarray Analyses: Normalization and Outlier Removal
The data normalization and statistical analysis to identify differentially expressed genes were performed using Partek Genomics Suite (Partek Inc., St. Louis, MO). The raw gene expression data was normalized using the standard Robust Multichip Average (RMA) approach (Irizarry et al. 2003). Principal Component Analysis revealed two of the female rat samples as outliers and these were excluded in further study. The RMA normalization was repeated for the remainder of the arrays after removal of the outlier samples.
Gender-dependent Differential Gene Expression in Control Animals
The normalized data for the control male and female animals was analyzed using a two-tailed Student’s T test with unequal variances for the two groups. The resulting p-values were corrected for multiple testing using a q-value approach using the q-value library implemented in the Bioconductor libraries (Gentleman et al. 2004) for the R Project for Statistical Computing (http://www.r-project.org). This approach estimates the proportion of non-differentially regulated genes and hence improves the sensitivity of the analysis (Storey and Tibshirani 2003).
Differential Gene Expression in Response to Lead Exposure
Normalized data were analyzed using a 3-way mixed effects ANOVA (implemented in Partek Genomics Suite, Partek Inc, St Louis, MO) that considered the following two variables and their interactions as fixed effects: (1) Gender (male or female), (2) lead exposure (0, 1500 ppm). The microarray batch (two separate runs, as reflected in the array scan date) was considered as the random effect to account for run-to-run differences across arrays. We analyzed the data using a Restricted Maximum Likelihood (REML) approach that is generally preferred for partially balanced or unbalanced experimental designs. Differentially expressed genes were identified based on statistically significant effects of lead exposure, gender or an interaction between these two factors. The raw p-values from ANOVA were corrected for multiple testing using the standard q-value approach (Storey and Tibshirani 2003). A q-value threshold of 0.3 was used to identify differentially expressed genes. We chose a q-value of 0.3 in order to improve the sensitivity for detecting differential expression with significant interaction between Gender and Treatment factors. A q-value threshold of 0.3 yielded 33% more genes with interaction than at 0.2 threshold value.
Gene Sets Affected by Lead Exposure and Visualization of Sample Groups
The list of differentially expressed genes from ANOVA was filtered based on a minimum fold change threshold of 1.3 up or down regulation in response to lead exposure in male or female animals. The fold-change filtered differentially expressed genes were considered further as three separate sets based on the ANOVA term that was statistically significant: (Set 1) Treatment alone, (Set 2) both Treatment and Gender: Treatment interaction and, (Set 3) Gender:Treatment interaction alone. In the heat map visualizations of these data sets, hierarchical clustering using complete linkage and Pearson correlation similarity metric was performed using the MeV software (Howe et al. 2010). Clusters of genes were identified based on the expression pattern across biological replicates of male and female samples. The differential gene expression data were then used in an established multidimensional scaling approach (Cox and Cox 2001) employing the isoMDS function in the MASS library and the Dist function in the amap library implemented in the Bioconductor libraries (Gentleman et al. 2004) for the R Project for Statistical Computing (http://www.r-project.org). The samples were grouped based on the ‘canberra’ distance metric, which is computed as the sum of scaled absolute differences in gene expression changes. The samples were colored based on a combination of Gender and Treatment, yielding four distinct colored groups. The objective of the multidimensional scaling approach employed here was to position the samples in the three dimensional space with the pair-wise Euclidean distances approximately equal to the ‘canberra’ dissimilarity metric computed. This permits a visual approach to investigating the similarities and differences between the gene expression responses across the biological samples.
Pathway Analyses
The lead-affected gene sets were analyzed for over-represented biological pathways, networks and other functional annotation using the DAVID software (Huang da et al. 2009) and Ingenuity Pathway Analysis (IPA: Ingenuity Inc., Redwood City, CA). The list of genes on the Affymetrix Rat Gene 1.0 array was used as the background reference in DAVID and IPA. The gene set clusters were considered separately in the DAVID analysis. We considered the default parameters of DAVID that considers all levels of Gene Ontology as well as KEGG and PANTHER pathways in identifying over-represented pathways, processes and functional annotations. In the IPA, a collated data set from the three lead affected gene sets was prepared to construct significantly enriched networks. The genes in the network were color coded based on differential gene expression data or the categorical cluster membership.
Quantitative RT-PCR
Real-time reverse transcription-polymerase chain reaction (RT-PCR) was used to confirm microarray results for a subset of selected genes from those fulfilling the criteria of significant (P<0.05) expression differences. Reverse transcription for 2 μg of each sample was performed with Omniscript RT Kit (Qiagen, Valencia, CA) according to the manufacturer’s protocol. Real-time PCR was then performed using a LightCycler 480 (Roche Diagnostics, Ltd) according to the manufacturer’s instructions with gene specific optimized primers generated as reverse phase HPLC purified oligonucleotides, designed to amplify 86–183 bp regions of the selected genes (Primer sequences are listed in Supplementary Table S1; SAB Biosciences, Inc) and LC480 SYBR Green I Master Mix (Roche Diagnostics, Ltd). A typical reaction took approximately 50 minutes to complete and included a 5 minute denaturation step at 95°C, followed by 45 cycles of 95°C for 5s (melting), 55°C for 5s (annealing) and 72°C for 5s (extension). To confirm specificity of amplification, the products were subjected to a melting curve analysis at the end of the final extension period. Standard curve amplification was performed using known amplicon dilutions ranging from 10−6 – 10−1 attomoles. The generated standard curve for each primer set was stored as a reference curve for use in future experiments and compared to standards in each run and against the unknown samples.
Results
Animal Characteristics
At the end of the study, there were no significant differences in body weight between female lead exposed animals and control animals (female lead 156.0 ± 1.6g and female control 163.3 ± 3.0g, respectively, t = 2.12, p>0.05) or between male lead exposed animals and control animals (male lead 197.4 ± 8.5g and male control 209.0 ± 6.4g, respectively, t = 1.09, p>0.05). There were significant differences in weight between control male and female animals (t = 6.49, p<0.0001) and between male and female lead exposed animals (t = 4.78, p>0.001).
The mean blood lead level for female and male control animals was <1.0 μg/dl. In contrast, the mean blood lead level for females was 26.69 ± 2.06 μg/dl and for males was 27.14 ± 1.71 μg/dl, a difference that was not statistically significant (t = 0.17, p >0.05).
Gene Expression Profile in the Hippocampus in Control Male and Female Rats
The expression of 263 probes (175 unique genes of 193 annotated probes) was differentially regulated between control male and female rats at an average fold change > 1.3 and a multiple testing corrected q-value < 0.3 (Figure 1). Two hundred and four probes (165 unique genes of 183 annotated probes) showed a greater expression in females than in males while only 59 probes (10 annotated genes) showed a greater expression in males than in females. Based on DAVID analysis, the major cell processes that showed a relatively higher expression in females than in males are concerned with signaling, ion binding and transport, and membrane receptor expression (Table 1). DAVID bioinformatics analysis did not reveal any particular biological functions or annotations containing significant numbers of differentially expressed genes for the small gene set with higher expression in males.
Figure 1.

Hierarchical cluster analysis of differentially expressed genes in hippocampus from male or female non-lead exposed control animals. The majority of differentially regulated genes between control male and female rats showed a greater expression in females than in males. Green indicates down-regulation of a gene; red indicates up-regulation relative to the median. Dendrogram on the left side of the gene list indicates clustering.
Table 1.
Differential Expression of Hippocampal Genes in Control Males and Females
| Process (Functional Annotation Clustering) | No. of genes |
P value |
|---|---|---|
| Genes showing higher expression in females than in males (203 out of 244 genes) |
||
| Extracellular region | 31 | 7.4E-7 |
| Glycoprotein | 42 | 8.1E-6 |
| Signal (Signal peptides) | 29 | 3.5E-3 |
| Plasma membrane associated | 43 | 7.0E-6 |
| Ion binding | 43 | 6.5E-5 |
| (Metal ion binding) | 39 | 7.8E-4 |
| Ion transport | 18 | 5.8E-5 |
| (Metal ion transport) | 10 | 8.0E-3 |
| Response to hormone stimulus | 13 | 1.9E-3 |
Effects of Lead on Gene Expression Patterns in Male and Female Rats
A total of 423 probes (167 unique genes, of 183 annotated probes) were differentially expressed in response to lead exposure in either males or females, at an average expression ratio > 1.3 fold up or down regulation. A significant gender-dependent effect of lead exposure dominated the gene expression response. Approximately 40% of lead exposure-dependent expression changes were distinct between males and females, indicating a strong gender-driven effect on the transcriptional response to lead exposure. In order to understand the impact of the gender-dependent gene expression changes and biological variability on sample grouping, the data were visualized using an established multidimensional scaling approach (Cox and Cox 2001). This analysis revealed a key feature of the gene expression response: male and female sample groups occupy separate, diagonally opposite segments. This indicates a significant gender-specific response that is in opposite directions in male vs. female animals (Figure 2). A consistent separation of sample groups was obtained despite biological response variability, providing confidence in the significance of the overall patterns of gene expression changes.
Figure 2.
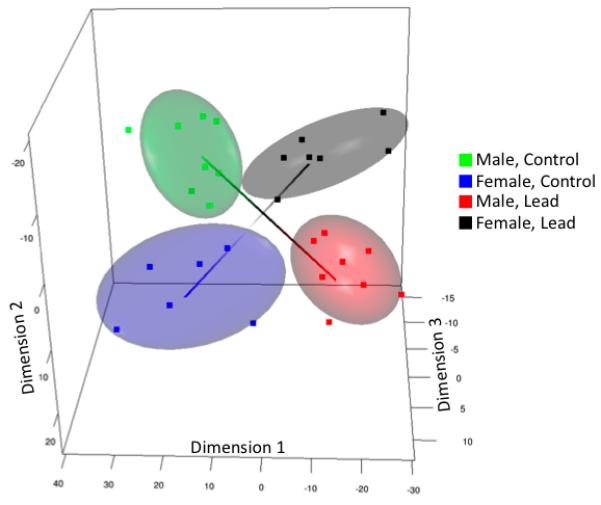
Multi-dimensional scaling analysis of the gene expression response to lead. Male and female groups occupy separate, diagonally opposite segments, indicating a significant gender-specific response that is in opposite directions in male vs. female animals.
In order to gain further insight into the observed gender-specific response to lead, the differentially expressed gene set was divided into groups based on the statistical significance of corresponding factors in ANOVA, as described below:
Set 1
In this set, lead exposure had a significant overall effect without a significant difference between male and female responses (249 probes: 77 unique genes, of 77 annotated probes, Figure 3A). While the male vs. female differences in response were statistically insignificant in this group, examination of average gene expression changes revealed that a fraction of the responses occurred in a gender-dependent manner with only one of the groups (male or female) showing an average change in gene expression levels (Figure 3B). Multi-dimensional scaling analysis of the data in Figure 3A revealed the gender-independent sample group segregation based on lead exposure as well as the variability in the response (Figure 3C). This set included key genes such as Ephx2 (epoxide hydrolase 2; role in blood pressure regulation with potential anti-hypertensive, anti-inflammatory roles and role in neuronal survival after ischemic injury (Koerner et al. 2007)), Rtn4 (NOGO; inhibits neurite extension and axonal regeneration (Meier et al. 2003)), Mdk (midkine, neurite growth promoting factor-2; promotes neurite outgrowth (Nakamura et al. 1998) and possesses neurotrophic and neuroprotective properties in the central nervous system (Kim et al. 2010)), Mmp2 (matrix metalloproteinase 2; functions in hippocampal synaptic plasticity (Szklarczyk et al. 2002)), Lama3 (laminin, alpha3; role in axonal guidance(Hagg et al. 1997)), Glycam1 (glycosylation dependent cell adhesion molecule 1; functions in cell adhesion, may be associated with stress (Bergstrom et al. 2007)), Hspb1 (heat shock 27kDa protein 1; involved in protein folding and quality control, implicated in memory consolidation (Sirri et al. 2010) , Igf2 (insulin-like growth factor-2; stimulates proliferation of neuronal and glial cells (Konishi et al. 1994)), promotes survival of several neuronal cell types ((Haselbacher et al. 1989) and potentiates ACh release), Sfrp1 (secreted frizzled-related protein 1; implicated in regulating synapse number and function in the hippocampus (Miquelajauregui et al. 2007)), Ldha (lactate dehydrogenase A; a glycolytic enzyme important for energy metabolism (Gomez Ravetti et al. 2010)), Hsp40 (heat shock protein 40; part of the cytoplasmic stress response system (induced by transient cerebral ischemia and potentially a molecular mechanism promoting recovery of cells from stress (Paschen et al. 1998)).
Figure 3.

Significant overall effect of lead exposure without a significant difference between male and female gene responses. A. Hierarchical cluster analysis of differentially expressed genes in hippocampus from control and lead exposed female or male rats. Green indicates down-regulation of a gene; red indicates up-regulation relative to the median. B. Scatter plot comparing male and female average gene expression responses. This set of genes did not show a significant sex-based differential response to lead exposure. C. Multi-dimensional scaling analysis of the gene expression shown in panel A. Color legend is the same as in Figure 2.
Set 2
In this set, lead exposure had a significant overall effect with differences in male vs female response (120 probes: 71 unique genes, of 75 annotated probes, Figure 4A). A majority of the genes in this set were responsive to lead exposure either in males or females, but not in both (Figure 4B). Multi-dimensional scaling analysis of the data in Figure 4A revealed the gender-dependent sample group segregation based on lead exposure, albeit with variability within each group (Figure 4C). This set included key genes such as Gsta4 (glutathione S-transferase alpha 4; role in disposal of exogenous toxic compounds and the adaptive, antioxidant response to reactive oxygen species (Bjork et al. 2006)), Acsm3 (acyl-CoA synthetase medium-chain family member 3; may be involved in stress responses (Ising and Holsboer 2006)), A2m (α2 macroglobulin; a zinc binding protein with roles in protection against stress and inflammation (Mocchegiani and Malavolta 2007)), Htr2c (5-hydroxytryptamine (serotonin) receptor 2C; polymorphisms associated with attention deficits, hyperactivity and obsessive compulsive behavior (Orabona et al. 2009)), SLC6A2 (thyroid hormone monocarboxylate transporter; role in thyroid hormone transport across the blood brain barrier, inactivation of which leads to psychomotor and cognitive dysfunction (Roberts et al. 2008)), Cldn1 (claudin1; involved in blood brain barrier development and function (Liebner et al. 2008)), Stra6 (stimulated by retinoic acid gene 6; potential role in synapse development and function (Chen et al. 2008)), Trpv4 (transient receptor potential vanilloid 4; role in the temperature-dependent regulation of neural activity; physiological core body temperature-evoked Trpv4 activation affects neural firing through NMDA receptor activation (Shibasaki et al. 2007)), Prlr (prolactin receptor, may specifically mediate pheromone-induced neurogenesis in the dentate gyrus, particularly in females (Mak et al. 2007)), Enpp2 (etonucleotide pyrophosphatase/phosphodiesterase 2; an estrogen-responsive gene and an NF-κB target gene that may play a role in neurite remodeling, axon growth, neural responses to injury (Bergstrom et al. 2007)), Yap1 (yes-associated protein 1; a transcriptional cofactor, mediates the expression of cell death–promoting genes, and induces apoptosis (Hoshino et al. 2006)).
Figure 4.

Significant overall effect of lead exposure with differences in response in males and females. A majority of the genes in this set were responsive to lead exposure either in males or females, but not in both. A. Hierarchical cluster analysis of differentially expressed genes in hippocampus from control and lead exposed female or male rats. Green indicates down-regulation of a gene; red indicates up-regulation relative to the mean. Dendrogram on the side of gene list indicates clustering. B. Scatter plot comparing male and female average gene expression response. C. Multi-dimensional scaling analysis of the gene expression shown in panel A. Color legend is the same as in Figure 2.
Set 3
In this set, a total of 53 probes (30 unique genes, of 31 annotated probes) were differentially expressed in the hippocampus in opposite directions in males vs. females in response to lead exposure (Figure 5A and B). Thirty-one of these 53 probes had annotation information available and are listed in Table 2 along with fold changes. Multi-dimensional scaling analysis of the data in Figure 5A revealed the gender-dependent sample group segregation based on lead exposure, and shows the variability within each group (Figure 5C). The apparent sample outliers correspond to those samples with outlier expression for a subset of genes as shown in the heat map (Figure 5A). The affected genes clustered into biological pathways associated with plasma membrane, ion and anion transport, metal/zinc binding, extracellular region and glycosylation. A few of these genes (4 of 30) were expressed at a lower level in males than in females while the majority (27 of 30) were expressed at a lower level in females than in males. This set included key genes such as Gstt3 (glutathione S-transferase, theta 3; glutathione S-transferase (Gst) enzymes are instrumental in protecting cellular macromolecules against electrophiles and products of oxidative stress, determine a tissue’s ability to handle certain forms of chemical stress (Knight et al. 2007)), Fgf 1 (fibroblast growth factor 1; may protect against hippocampal excitotoxic injury (Hossain et al. 1998)), Pon1 (paraoxonase 1; plays a role in pesticide metabolism (Costa et al. 1999)), Sod3 (extracellular superoxide dismutase 3; important part of the cellular antioxidant defense mechanism (Freiberger et al. 2004)), Igfbpl1 (insulin-like growth factor binding protein-like 1; inhibits Igf1 actions and may have a detrimental effect on oligodendrocyte survival and proliferation and myelination (Ye et al. 1995; Ye et al. 1995)), Steap1 (six transmembrane epithelial antigen of the prostate 1; functions as a metalloreductase in the brain to influence cellular metal homeostasis (Knutson 2007)), Folr1 (folate receptor 1; can influence psychomotor development and myelination (Labrie et al. 2009)), Slc4a5 (solute carrier family 4, sodium bicarbonate cotransporter; may play a role in depression (Andrus et al. 2010), Ace (angiotensin I converting enzyme (peptidyl-dipeptidase A) 1; part of the ‘renin–angiotensin system that modulates vascular homeostasis and the amyloid β pathway, involved in memory and cognition, polymorphisms may be involved in risk for Alzheimer’s disease (Sleegers et al. 2005), Kl (Klotho; variation in the Klotho gene is a possible contributor to cognitive differences in humans: an association between variants in the Klotho gene and various cognitive abilities in youth and old age (Deary et al. 2005), Mfrp (membrane frizzled-related protein; may play a role in the response to stress (Bergstrom et al. 2007)).
Figure 5.

Significant overall effect of lead exposure with differentially expressed genes in the hippocampus in opposite directions in males and females. A. Hierarchical cluster analysis of differentially expressed genes in hippocampus from control and lead exposed female or male rats. Green indicates down-regulation of a gene; red indicates up-regulation relative to the mean. Dendrogram on the side of gene list indicates clustering. B. Scatter plot comparing male and female average gene expression responses. C. Multi-dimensional scaling analysis of the gene expression shown in panel A. Color legend is the same as in Figure 2.
Table 2.
Genes Differentially Expressed in Opposite Directions in the Hippocampus of Male and Female Lead-Exposed Animals.
| Affymetric Probe ID | Gene Symbol | Description | Fold Change Male | Fold Change Female |
|---|---|---|---|---|
| 10768357 | Rgs18 | regulator of G-protein signaling 18 | −0.331 | 0.381 |
| 10707370 | LOC298314 | similar to solute carrier family 25, member 5 | −0.524 | 0.041 |
| 10724150 | LOC365319 | hypothetical LOC365319 | −0.531 | 0.122 |
| 10791818 | LOC364597 | similar to 60S ribosomal protein L21 | −0.283 | 0.254 |
| 10832563 | Gstt3 | glutathione S-transferase, theta 3 | 0.403 | −0.034 |
| 10916232 | Spa17 | sperm autoantigenic protein 17 | 0.228 | −0.301 |
| 10804127 | Fgf1 | fibroblast growth factor 1 | 0.154 | −0.461 |
| 10860867 | Pon1 | paraoxonase 1 | −0.007 | −0.458 |
| 10922615 | LOC501126 | similar to hypothetical protein MGC26733 | 0.011 | −0.306 |
| 10903290 | RGD1565493 | similar to DKFZP434I092 protein | 0.050 | −0.569 |
| 10903298 | RGD1565493 | similar to DKFZP434I092 protein | 0.176 | −0.440 |
| 10816807 | Pbxip1 | pre-B-cell leukemia homeobox interacting protein 1 | 0.248 | −0.351 |
| 10912977 | Zmynd10 | zinc finger, MYND-type containing 10 | 0.219 | −0.379 |
| 10765503 | RGD1562658 | similar to RIKEN cDNA 1700009P17 | 0.230 | −1.011 |
| 10725387 | Cdr2 | cerebellar degeneration-related 2 | 0.120 | −0.863 |
| 10825100 | Car14 | carbonic anhydrase 14 | −0.002 | −0.799 |
| 10777108 | Sod3 | superoxide dismutase 3, extracellular | 0.257 | −0.627 |
| 10853396 | Steap1 | six transmembrane epithelial antigen of the prostate 1 | 0.191 | −0.708 |
| 10876551 | Igfbpl1 | insulin-like growth factor binding protein-like 1 | 0.057 | −0.772 |
| 10787401 | Slc5a5 | solute carrier family 5 (sodium iodide symporter), member 5 | 0.116 | −0.691 |
| 10782986 | Otx2 | orthodenticle homolog 2 (Drosophila) | 0.095 | −1.656 |
| 10724116 | Folr1 | folate receptor 1 (adult) | 0.447 | −1.782 |
| 10856673 | Slc4a5 | solute carrier family 4, sodium bicarbonate cotransporter, member 5 | 0.366 | −2.509 |
| 10880872 | Pla2g5 | phospholipase A2, group V | 0.163 | −0.985 |
| 10866606 | Slco1a5 | solute carrier organic anion transporter family, member 5 | 0.030 | −0.796 |
| 10739035 | Ace | angiotensin I converting enzyme (peptidyl-dipeptidase A) 1 | 0.196 | −1.735 |
| 10750296 | Clic6 | chloride intracellular channel 6 | 0.601 | −2.742 |
| 10759762 | Kl | Klotho | 0.269 | −2.988 |
| 10909428 | Mfrp | membrane frizzled-related protein | 0.414 | −2.784 |
| 10871561 | Cldn19 | claudin 19 | 0.228 | −0.516 |
| 10931558 | Efcab1 | EF hand calcium binding domain 1 | 0.173 | −0.610 |
Functional Analysis of Processes Affected by Lead Exposure
A subset of 183 probes contained annotation that permitted the subsequent pathway and functional analysis. Analysis using the DAVID bioinformatics tool (Huang da et al. 2009) revealed multiple biological functions that were over-represented in the three gene sets. These results did not reveal any particular biological functions or annotations containing significant numbers of differentially expressed genes (> 5) and genes significantly over-represented with a multiple testing corrected p-value less than 0.3. The highest ranked functional annotation groups included glycoprotein, glucose metabolic process, and response to estrogen stimulus, each containing less than 5 of the above-discussed genes, and were not analyzed further due to the small size of the annotation groups.
Pathway Analysis Revealed Two Distinct Networks Affected by Lead
We analyzed for networks of known interactions that were enriched in the gene expression response using IPA (Ingenuity Inc., Redwood City, CA). Our analysis revealed two distinct networks (Figures 6 and 7). Network 1 included 50 differentially expressed genes with almost all of these located in the periphery with limited direct connectivity to other genes (Figure 6). In contrast, Network 2 included 40 differentially expressed genes with several nodes such as CDKN1A, MMP2, MMP14, A2M, FGF1, IGF2, PRLR, located more centrally in the network with extensive connections to other genes (Figure 7). Notably, there were several distinct central, highly connected nodes between the two networks that may represent independent mechanisms by which the corresponding genes were regulated in response to lead exposure, e.g., Network 1 - HNF1A, HNF4A, SREBF1, MYC; Network 2 – NFkB, MAPK, JNK, AP-1, PI3K, Pdgf, PON1, CDKN1A, A2M, MMP2, MMP14, PRLR. TGF beta and CREB were the highly connected nodes common to both the networks. Although the functional significance of these networks and findings is unclear at this time, this may be significant since there may be sex-related inlfuences of CREB on cognitive functioning (Hedba-Bauer et al. 2007) and genetic and pharmacological studies in rodents suggest that CREB is required for a variety of complex forms of memory, including spatial learning and memory (Silva et al. 1998), processes known to be disrupted by lead exposure (ex., (Moreira et al. 2001)). Mapping the direction of gene expression change to these networks revealed a subset of highly connected nodes (A2M, MMP2, FGF1) in Network 2 as oppositely regulated in male vs. female animals in response to lead exposure. A2M, MMP2 and FGF1 are all complex cognition-related genes that may be related to synaptic plasticity, memory, and brain development (Mocchetti et al., 2007; Reynolds et al, 2007; Mizoguchi et al. 2010).
Figure 6.

Network analysis. This network was obtained through Ingenuity Pathway Analysis of gene sets differentially expressed in male or female lead-exposed rats. The network is displayed as nodes (genes/gene products) and biological relationships between nodes. Solid lines denote direct interactions; dotted lines represent indirect interactions between genes. The average gene expression data from male (A) and female (B) rats was mapped to the corresponding genes in the IPA-derived network. Green indicates 1.3 fold or larger decreases; red indicates 1.3 fold or larger increases. A majority of differentially expressed genes in this network showed opposite responses in lead-exposed female rats (B, green nodes) compared to male rats (A, red nodes). A subset of genes showed the opposite or no response (grey) in lead-exposed male rats (A). A limited set of genes with common up- or down-regulation is also seen (nodes red or green in both A and B).
Figure 7.

Network analysis. This network was obtained through Ingenuity Pathway Analysis of gene sets differentially expressed in male or female lead-exposed rats. The network is displayed as described in Figure 6. Green indicates 1.3 fold or larger decreases; red indicates 1.3 fold or larger increases. A majority of differentially expressed genes in his network showed down-regulation in lead-exposed female rats (B, green nodes) with a subset of these genes showing the opposite (red) or no response (grey) in lead-exposed male rats (A). A limited set of genes with common up- or down-regulation is also seen (nodes red or green in both A and B).
Confirmation of Gene Expression Changes by Quantitative RT-PCR
We carried out quantitative RT-PCR confirmation of the microarray data using total RNA samples from all experimental groups. Primer pairs designed for these 8 genes are described in Supplementary Table S1. These 8 genes were chosen based on large differential fold changes in the microarray data between male and female lead-exposed animals and potential biological relevance of these genes. Analysis of the fold-change by both quantitative RT-PCR and microarray were similar in 14 of 16 analyses and array and PCR data were significantly positively correlated (Pearson Correlation Coefficient r=0.9486, p < 0.0001) (Table 3).
Table 3.
Confirmation by qPCR of Relative Changes in Gene Expression Identified by Array Analysis.
| Gene | RefSeq | Array Data (Fold Change from Control) |
QPCR Data (Fold Change from Control) |
||
|---|---|---|---|---|---|
| Male | Female | Male | Female | ||
| A2m | NM_012488 | 1.18 | −2.10 | 1.26 ± 0.33 | −2.18 ± 0.27 |
| Clic6 | NM_176078 | 1.82 | −15.52 | 1.56 ± 0.74 | −14.52 ± 6.35 |
| Cldn1 | NM_031699 | 1.11 | −3.62 | 1.39 ± 0.34 | −2.27 ± 0.23 |
| Enpp2 | NM_057104 | 1.13 | −5.52 | 1.21 ± 0.36 | −2.60 ± 0.56 |
| Ephx2 | NM_022936 | −1.66 | −2.68 | −0.60 ± 0.11 | −5.60 ± 1.52 |
| Gsta4 | NM_001106840 | 1.25 | −1.63 | −1.13 ± 0.05 | −1.16 ± 0.15 |
| Mfrp | NM_001108137 | 1.51 | −16.12 | 1.30 ± 0.27 | −11.07 ± 8.62 |
| Dnajc30 | NM_001109024 | 1.53 | 1.27 | 1.14 ± 0.17 | −1.08 ± 0.19 |
Discussion
The results of this study describe a significant effect of sex on gene expression changes in the hippocampus following post-weaning exposure to lead in rats. Although the expression of a number of genes in the hippocampus were affected in both male and female animals, of particular interest was the finding of a diverse group of genes that were differentially expressed in opposite directions in males compared to females in response to lead exposure.
Although the functional significance of the subset of genes that were highly differentially expressed in hippocampus of males and females following lead exposure is quite varied, a number of these genes (i.e., F5, Aqp1, Mdk, Nt5dc2, Prlr, Enpp2) have previously been shown to be differentially expressed (i.e., significantly down-regulated) in an endogenous depression model in rats (Andrus et al. 2010). In the present study, these genes were significantly down-regulated in female rats exposed to lead but not in male animals. This suggests the possibility that lead exposure may differentially modify molecular signatures associated with depressive behavior in males and females and may further suggest a differential risk of developing depression in males and females exposed to lead. In further support of this, CREB, one of the two highly connected nodes in the networks identified in Figures 6 and 7 showing sex-dependent differential gene expression, is also known to be involved in a sexually dimorphic molecular response to stress and to potentially play a differential role in stress-related depression in females compared to males (Lin et al., 2009). TGF beta and CREB were the highly connected nodes common to both networks identified with differentially expressed genes (see Figures 6 and 7). Both TGF beta and CREB are influenced by environmental factors, including hormones, and may be involved in a sex-dependent modulation of neurogenesis. The connection between TGF beta and CREB may involve crosstalk with Wnt signaling, important for presursor cell proliferation and neurogenesis (Malaterre et al. 2007). This is of potential significance since neurogenesis is a possible substrate through which antidepressants alleviate symptoms of depression and anti-depressant effects on depression appear to be at least in part sex-dependent (Hodes et al. 2009). Using data collected from the National Health and Nutrition Examination Survey (for 1999 to 2004) to investigate the relation between blood lead levels and the odds of developing major depressive disorder (MDD), a higher blood lead quintile was significantly associated with higher odds of meeting DSM-IV criteria for MDD. Women may have had higher rates of MDD and other psychiatric disorders than did men, despite having lower blood lead levels than did men, although a larger sample is necessary to verify this (Bouchard et al. 2009).
Abnormal N-methyl-D-aspartate receptor (NMDAR) function has long been associated with developmental lead exposure and has also been implicated in a variety of cognitive disorders including the pathophysiology of schizophrenia (Coyle 2006). Lead has potent inhibitory effects on the NMDAR (Alkondon et al. 1990; Guilarte 1997) that appear to be age and brain region specific (Guilarte 1997). The developing brain is more sensitive than the adult brain to lead-induced effects on the NMDAR and the hippocampus appears to be particularly vulnerable (Guilarte and McGlothan 1998). Rats exposed to lead during development in particular have altered hippocampal NR1 and NR2A mRNA expression (Nihei and Guilarte 1999). Although different experimental studies have utilized a variety of lead exposure paradigms during different developmental periods, the data are fairly consistent in pointing to structural and functional alterations in NMDAR complexes in the rat hippocampus that have significant effects on signaling, synaptic plasticity and a variety of cognitive functions (Toscano and Guilarte 2005). In addition, many of the findings regarding lead effects on the NMDARs resemble changes in NMDAR subunit expression described in the brain of schizophrenic patients (Tsai and Coyle 2002; Konradi and Heckers 2003)..
In this regard, developmental lead exposure has been suggested as a significant risk factor for the expression of schizophrenia later in life (Opler et al. 2004; Opler et al. 2008). The potential link between developmental lead exposure and schizophrenia may be the disruption of glutamatergic synaptic activity—specifically, hypoactivity of NMDARs (Guilarte 2004; Opler et al. 2004). NMDAR function is modulated in complex ways and in part by substances that modulate the endogenous NMDAR glycine site. One such substance is d-serine, which together with its catabolic enzyme (which is augmented in the brain of schizophrenics (Madeira et al. 2008) and activator has been associated with an increased risk of schizophrenia (Labrie et al. 2009). D-serine is synthesized from L-serine by the enzyme serine racemase (Srr). In support of a Srr dysfunction in schizophrenia patients is the observation of reduced levels of D-serine in serum and CSF (Hashimoto et al. 2003; Bendikov et al. 2007), reflecting an abnormality in available D-serine in the pathogenesis of schizophrenia (Labrie et al. 2009). The differential expression of genes relevant to schizophrenia and cognitive function have been described in SrrY269 mutant mice in which there is a lack of Srr activity and associated cognitive disturbances (Labrie et al. 2009). In particular, SrrY269 mice displayed an elevated level of hippocampal Ttr, Enpp2, Kl, Igf2, Folr1, Prlr, Otx2 and Cldn2 gene expression and these elevations were reversed by D-serine or clozapine administration. Six of these 9 genes (Enpp2, Kl, Igf2, Folr1, Prlr, Otx2) were significantly affected by lead exposure and all but Igf2 (which was decreased in expression in both males and females) was increased in males and decreased in females exposed to lead. These findings provide new molecular insight into the possible relationship between developmental lead exposure and the risk of schizophrenia and may suggest possible gender-based vulnerability, which will need to be assessed clinically.
Sex differences have been identified in the brain and although the brains of men and women are highly similar, differences have been described that have important implications for each sex (Ngun et al. 2010). Sex-related differences in the brain uniquely affect biochemical processes, may contribute to the susceptibility to specific diseases, and may influence specific behaviors (Ngun et al. 2010). However, there is little information in the literature comparing gene expression profiles in the brain, including the hippocampus, in control male and female rats. In the current study, we found a relatively small number of genes differentially expressed in control males compare to control females and in the majority of cases, there was greater expression of the differentially regulated genes in females compared to males. In one of the few studies that provides information on this topic, Biala et al. (Biala et al. 2010), examined gene expression profiles from hippocampal extracts prepared from Wistar rats and reported that 1,680 genes were differentially expressed in control males and females. The gender difference in gene expression was decreased to 11% (191 genes) by prenatal stress (Biala et al. 2010). In the present study, we observed far fewer differentially expressed genes in control male vs. female animals. Although the reasons for the discrepancy between our data and the findings reported by Biala et al. (2010) are not clear, they may be related to differences in criteria for defining differentially expressed genes as well as potential strain differences (Wistar vs. Long Evans). In another study, Torbati et al. (Torbati et al. 2008) reported that only 61 genes (36 functionally recognized genes) showed statistically significant differential gene expression (both up- / down-regulation) at 10 days of age between male and female Sprague Dawley rat pups.
Although changes in gene expression provide valuable information they are not necessarily predictive of cellular function. Gene expression is vital for allowing a cell to produce its gene products allowing flexibility to adapt to a variety of external signals. Thus any process (or exposure) that alters gene expression patterns is potentially disruptive to the cell and its ability to adapt to changing demands. However, information concerning gene expression changes is only one piece of a larger, complex puzzle. The current findings will need to be followed up with protein expression studies as well as studies of possible post-translational modifications of proteins to better understand how lead exposure could influence hippocampal functionality. It is also possible that the current data actually under-estimate potential effects of lead on hippocampal gene expression profiles. The current pool of RNA was extracted from the whole excised hippocampus. Recent data suggest that there may be region-specific changes in hippocampal gene expression in response to lead exposure (ex., (Guilarte and McGlothan 1998; Zhang et al. 2002) that may need to be studied in greater detail in future studies.
In summary, post-weaning exposure to environmentally relevant levels of lead produced significant changes in the expression a variety of genes in the hippocampus and the present results show that the response of the brain to a given lead exposure may vary depending on sex. Based on the current data from animals with this particular type of lead exposure (i.e., post-weaning exposure), it is not possible to ascribe any particular gene expression changes observed to any particular cognitive function or dysfunction that might be associated with this type of lead exposure. The functional analyses performed revealed a complex array of genes differentially affected in males and females by lead exposure but did not reveal particular definitive overarching biological themes or annotations containing significant numbers of differentially expressed genes across treatment groups. Further work is necessary to further investigate the functional significance of sex-based differences in gene expression in brain as a consequence of lead exposures that occur during different developmental periods.
Supplementary Material
Highlights.
Postnatal lead exposure has a significant effect on hippocampal gene expression patterns
At least one set of genes was affected in opposite directions in males and females
Differentially expressed genes were associated with diverse biological pathways
Acknowledgements
This work was supported by National Institutes of Health grant RO1-ES015295. The authors thank William Mettil for assistance in performing RNA extractions and for performing RT-PCR verification studies.
Abbreviations
- RMA
Robust Multichip Average
- IPA
Ingenuity Pathway Analysis
- RT-PCR
Real Time Polymerase Chain Reaction
- MDD
Major Depressive Disorder
- NMDAR
N-Methyl-D-Aspartate Receptor
Footnotes
Conflict of Interest Statement: The authors declare that there are no conflicts of interest.
Publisher's Disclaimer: This is a PDF file of an unedited manuscript that has been accepted for publication. As a service to our customers we are providing this early version of the manuscript. The manuscript will undergo copyediting, typesetting, and review of the resulting proof before it is published in its final citable form. Please note that during the production process errors may be discovered which could affect the content, and all legal disclaimers that apply to the journal pertain.
References
- Managing Elevated Blood Lead Levels among Young Children: Recomendandations from the Advisory Committee on Childhood Lead Poisoning Prevention, Centers for Disease Control and Prevention (CDC) 2002.
- A Review of the Evidence of Health Effects of Blood Lead Levels <10μg/Dl in Children. A Report by the Working Group of the Advisory Committee on Childhood Lead Poisoning Prevention, Centers for Disease Control and Prevention (CDC) 2004.
- Alkondon M, Costa AC, Radhakrishnan V, Aronstam RS, Albuquerque EX. Selective Blockade of Nmda-Activated Channel Currents May Be Implicated in Learning Deficits Caused by Lead. FEBS Lett. 1990;261(1):124–130. doi: 10.1016/0014-5793(90)80652-y. [DOI] [PubMed] [Google Scholar]
- Andrus BM, Blizinsky K, Vedell PT, Dennis K, Shukla PK, Schaffer DJ, Radulovic J, Churchill GA, Redei EE. Gene Expression Patterns in the Hippocampus and Amygdala of Endogenous Depression and Chronic Stress Models. Mol. Psychiatry. 2010 doi: 10.1038/mp.2010.119. doi: 10.1038/mp.2010.119. [DOI] [PMC free article] [PubMed] [Google Scholar]
- Bellinger D, Leviton A, Sloman J. Antecedents and Correlates of Improved Cognitive Performance in Children Exposed in Utero to Low Levels of Lead. Environ. Health Perspect. 1990;89:5–11. doi: 10.1289/ehp.90895. [DOI] [PMC free article] [PubMed] [Google Scholar]
- Bendikov I, Nadri C, Amar S, Panizzutti R, De Miranda J, Wolosker H, Agam G. A Csf and Postmortem Brain Study of D-Serine Metabolic Parameters in Schizophrenia. Schizophr. Res. 2007;90(1-3):41–51. doi: 10.1016/j.schres.2006.10.010. [DOI] [PubMed] [Google Scholar]
- Bergstrom A, Jayatissa MN, Thykjaer T, Wiborg O. Molecular Pathways Associated with Stress Resilience and Drug Resistance in the Chronic Mild Stress Rat Model of Depression: A Gene Expression Study. J. Mol. Neurosci. 2007;33(2):201–215. doi: 10.1007/s12031-007-0065-9. [DOI] [PubMed] [Google Scholar]
- Biala YN, Bogoch Y, Bejar C, Linial M, Weinstock M. Prenatal Stress Diminishes Gender Differences in Behavior and in Expression of Hippocampal Synaptic Genes and Proteins in Rats. Hippocampus. 2010;21 doi: 10.1002/hipo.20825. n/a. doi: 10.1002/hipo.20825. [DOI] [PubMed] [Google Scholar]
- Bjork K, Saarikoski ST, Arlinde C, Kovanen L, Osei-Hyiaman D, Ubaldi M, Reimers M, Hyytia P, Heilig M, Sommer WH. Glutathione-S-Transferase Expression in the Brain: Possible Role in Ethanol Preference and Longevity. The FASEB Journal. 2006;20(11):1826–1835. doi: 10.1096/fj.06-5896com. [DOI] [PubMed] [Google Scholar]
- Bouchard MF, Bellinger DC, Weuve J, Matthews-Bellinger J, Gilman SE, Wright RO, Schwartz J, Weisskopf MG. Blood Lead Levels and Major Depressive Disorder, Panic Disorder, and Generalized Anxiety Disorder in Us Young Adults. Arch. Gen. Psychiatry. 2009;66(12):1313–1319. doi: 10.1001/archgenpsychiatry.2009.164. [DOI] [PMC free article] [PubMed] [Google Scholar]
- Cecil KM, Brubaker CJ, Adler CM, Dietrich KN, Altaye M, Egelhoff JC, Wessel S, Elangovan I, Hornung R, Jarvis K, Lanphear BP. Decreased Brain Volume in Adults with Childhood Lead Exposure. PLoS medicine. 2008;5(5):e112. doi: 10.1371/journal.pmed.0050112. [DOI] [PMC free article] [PubMed] [Google Scholar]
- Chen T, Wu XD, Gao J, Hao W, Yin B, Qiang BQ, Yuan JG, Gong YH, Peng XZ. Role of Cell Adhesion Molecules Necl1 in Synaptogenesis in Primary Cultured Rat Neurons. Acta Academiae Medicinae Sinicae. 2008;30(3):275–279. [PubMed] [Google Scholar]
- Chiodo LM, Jacobson SW, Jacobson JL. Neurodevelopmental Effects of Postnatal Lead Exposure at Very Low Levels. Neurotoxicol. Teratol. 2004;26(3):359–371. doi: 10.1016/j.ntt.2004.01.010. [DOI] [PubMed] [Google Scholar]
- Cory-Slechta DA, Virgolini MB, Thiruchelvam M, Weston DD, Bauter MR. Maternal Stress Modulates the Effects of Developmental Lead Exposure. Environ. Health Perspect. 2004;112(6):717–730. doi: 10.1289/ehp.6481. [DOI] [PMC free article] [PubMed] [Google Scholar]
- Costa LG, Li WF, Richter RJ, Shih DM, Lusis A, Furlong CE. The Role of Paraoxonase (Pon1) in the Detoxication of Organophosphates and Its Human Polymorphism. Chem. Biol. Interact. 1999;119-120:429–438. doi: 10.1016/s0009-2797(99)00055-1. [DOI] [PubMed] [Google Scholar]
- Cox TF, Cox MAA. Multidimensional Scaling. Chapman and Hall; Boca Raton, FL: 2001. [Google Scholar]
- Coyle JT. Glutamate and Schizophrenia: Beyond the Dopamine Hypothesis. Cell. Mol. Neurobiol. 2006;26(4-6):365–384. doi: 10.1007/s10571-006-9062-8. [DOI] [PubMed] [Google Scholar]
- de Souza Lisboa SF, Gonzalves G, Komatsu F, Queiroz C. A. Salci, Almeida A. Aparecido, Moreira E. n. Gastaldello. Developmental Lead Exposure Induces Depressive-Like Behavior in Female Rats. Drug Chem. Toxicol. 2005;28(1):67–77. doi: 10.1081/dct-39696. [DOI] [PubMed] [Google Scholar]
- Deary IJ, Harris SE, Fox HC, Hayward C, Wright AF, Starr JM, Whalley LJ. Klotho Genotype and Cognitive Ability in Childhood and Old Age in the Same Individuals. Neurosci. Lett. 2005;378(1):22–27. doi: 10.1016/j.neulet.2004.12.005. [DOI] [PubMed] [Google Scholar]
- Dietrich KN, Krafft KM, Bornschein RL, Hammond PB, Berger O, Succop PA, Bier M. Low-Level Fetal Lead Exposure Effect on Neurobehavioral Development in Early Infancy. Pediatrics. 1987;80(5):721–730. [PubMed] [Google Scholar]
- Finkelstein Y, Markowitz ME, Rosen JF. Low-Level Lead-Induced Neurotoxicity in Children: An Update on Central Nervous System Effects. Brain Res Rev. 1998;27(2):168–176. doi: 10.1016/s0165-0173(98)00011-3. [DOI] [PubMed] [Google Scholar]
- Freiberger J, Coulombe K, Suliman H, Carraway M, Piantadosi C. Superoxide Dismutase Responds to Hyperoxia in Rat Hippocampus. Undersea & Hyperbaric Medicine. 2004;31(2):227–232. [PubMed] [Google Scholar]
- Gentleman RC, Carey VJ, Bates DM, Bolstad B, Dettling M, Dudoit S, Ellis B, Gautier L, Ge Y, Gentry J, Hornik K, Hothorn T, Huber W, Iacus S, Irizarry R, Leisch F, Li C, Maechler M, Rossini AJ, Sawitzki G, Smith C, Smyth G, Tierney L, Yang JY, Zhang J. Bioconductor: Open Software Development for Computational Biology and Bioinformatics. Genome biology. 2004;5(10):R80. doi: 10.1186/gb-2004-5-10-r80. [DOI] [PMC free article] [PubMed] [Google Scholar]
- Gomez Ravetti M, Rosso OA, Berretta R, Moscato P. Uncovering Molecular Biomarkers That Correlate Cognitive Decline with the Changes of Hippocampus’ Gene Expression Profiles in Alzheimer’s Disease. PloS one. 2010;5(4):e10153. doi: 10.1371/journal.pone.0010153. [DOI] [PMC free article] [PubMed] [Google Scholar]
- Guilarte TR. Pb2+ Inhibits Nmda Receptor Function at High and Low Affinity Sites: Developmental and Regional Brain Expression. Neurotoxicology. 1997;18(1):43–51. [PubMed] [Google Scholar]
- Guilarte TR. Prenatal Lead Exposure and Schizophrenia: A Plausible Neurobiologic Connection. Environ. Health Perspect. 2004;112(13):A724. doi: 10.1289/ehp.112-a724a. [DOI] [PMC free article] [PubMed] [Google Scholar]
- Guilarte TR, McGlothan JL. Hippocampal Nmda Receptor Mrna Undergoes Subunit Specific Changes During Developmental Lead Exposure. Brain Res. 1998;790(1-2):98–107. doi: 10.1016/s0006-8993(98)00054-7. [DOI] [PubMed] [Google Scholar]
- Hagg T, Portera-Cailliau C, Jucker M, Engvall E. Laminins of the Adult Mammalian Cns; Laminin-Alpha2 (Merosin M-) Chain Immunoreactivity Is Associated with Neuronal Processes. Brain Res. 1997;764(1-2):17–27. doi: 10.1016/s0006-8993(97)00419-8. [DOI] [PubMed] [Google Scholar]
- Haselbacher G, Groscurth P, Otten U, Vedder H, Lutz U, Sonderegger P, Bulatko A, Greeff N, Humbel R. Long-Term Cultivation of Cryopreserved Human Fetal Brain Cells in a Chemically Defined Medium. J. Neurosci. Methods. 1989;30(2):121–131. doi: 10.1016/0165-0270(89)90058-7. [DOI] [PubMed] [Google Scholar]
- Hashimoto K, Fukushima T, Shimizu E, Komatsu N, Watanabe H, Shinoda N, Nakazato M, Kumakiri C, Okada S, Hasegawa H, Imai K, Iyo M. Decreased Serum Levels of D-Serine in Patients with Schizophrenia: Evidence in Support of the N-Methyl-D-Aspartate Receptor Hypofunction Hypothesis of Schizophrenia. Arch. Gen. Psychiatry. 2003;60(6):572–576. doi: 10.1001/archpsyc.60.6.572. [DOI] [PubMed] [Google Scholar]
- Hebda-Bauer EK, Luo J, Watson SJ, Akil H. Female CREBαδ– Deficient Mice Show Earlier Age-Related Cognitive Deficits than Males. Neurosci. 2007;150(2):260–272. doi: 10.1016/j.neuroscience.2007.09.019. [DOI] [PMC free article] [PubMed] [Google Scholar]
- Hodes GE, Yang L, Van Kooy J, Santollo J, Shors TJ. Prozac During puberty: Distinctive Effects on Neurogenesis as a Function of Age and Sex. Neurosci. 2009;163:609–617. doi: 10.1016/j.neuroscience.2009.06.057. [DOI] [PMC free article] [PubMed] [Google Scholar]
- Hoshino M, Qi ML, Yoshimura N, Miyashita T, Tagawa K, Wada Y, Enokido Y, Marubuchi S, Harjes P, Arai N, Oyanagi K, Blandino G, Sudol M, Rich T, Kanazawa I, Wanker EE, Saitoe M, Okazawa H. Transcriptional Repression Induces a Slowly Progressive Atypical Neuronal Death Associated with Changes of Yap Isoforms and P73. J. Cell Biol. 2006;172(4):589–604. doi: 10.1083/jcb.200509132. [DOI] [PMC free article] [PubMed] [Google Scholar]
- Hossain MA, Fielding KE, Trescher WH, Ho T, Wilson MA, Laterra J. Human Fgf-1 Gene Delivery Protects against Quinolinate-Induced Striatal and Hippocampal Injury in Neonatal Rats. Eur. J. Neurosci. 1998;10(8):2490–2499. [PubMed] [Google Scholar]
- Howe E, Holton K, Nair S, Schlauch D, Sinha R, Quankenbush J. Mev: Multiexperiment Viewer. Biomedical Informatics for Cancer Research. 2010:267–277. [Google Scholar]
- Huang da W, Sherman BT, Lempicki RA. Systematic and Integrative Analysis of Large Gene Lists Using David Bioinformatics Resources. Nature protocols. 2009;4(1):44–57. doi: 10.1038/nprot.2008.211. [DOI] [PubMed] [Google Scholar]
- Irizarry RA, Hobbs B, Collin F, Beazer-Barclay YD, Antonellis KJ, Scherf U, Speed TP. Exploration, Normalization, and Summaries of High Density Oligonucleotide Array Probe Level Data. Biostatistics. 2003;4(2):249–264. doi: 10.1093/biostatistics/4.2.249. [DOI] [PubMed] [Google Scholar]
- Ising M, Holsboer F. Genetics of Stress Response and Stress-Related Disorders. Dialogues in clinical neuroscience. 2006;8(4):433–444. doi: 10.31887/DCNS.2006.8.4/mising. [DOI] [PMC free article] [PubMed] [Google Scholar]
- Jedrychowski W, Perera FP, Jankowski J, Mrozek-Budzyn D, Mroz E, Flak E, Edwards S, Skarupa A, Lisowska-Miszczyk I. Very Low Prenatal Exposure to Lead and Mental Development of Children in Infancy and Early Childhood: Krakow Prospective Cohort Study. Neuroepidemiology. 2009;32(4):270–278. doi: 10.1159/000203075. [DOI] [PMC free article] [PubMed] [Google Scholar]
- Jett DA, Kuhlmann AC, Farmer SJ, Guilarte TR. Age-Dependent Effects of Developmental Lead Exposure on Performance in the Morris Water Maze. Pharmacol. Biochem. Behav. 1997;57(1-2):271–279. doi: 10.1016/s0091-3057(96)00350-4. [DOI] [PubMed] [Google Scholar]
- Kim YB, Ryu JK, Lee HJ, Lim IJ, Park D, Lee MC, Kim SU. Midkine, Heparin-Binding Growth Factor, Blocks Kainic Acid-Induced Seizure and Neuronal Cell Death in Mouse Hippocampus. BMC Neuroscience. 2010;11:42. doi: 10.1186/1471-2202-11-42. [DOI] [PMC free article] [PubMed] [Google Scholar]
- Knight TR, Choudhuri S, Klaassen CD. Constitutive Mrna Expression of Various Glutathione S-Transferase Isoforms in Different Tissues of Mice. Toxicol. Sci. 2007;100(2):513–524. doi: 10.1093/toxsci/kfm233. [DOI] [PubMed] [Google Scholar]
- Knutson MD. Steap Proteins: Implications for Iron and Copper Metabolism. Nutr. Rev. 2007;65(7):335–340. doi: 10.1111/j.1753-4887.2007.tb00311.x. [DOI] [PubMed] [Google Scholar]
- Koerner IP, Jacks R, DeBarber AE, Koop D, Mao P, Grant DF, Alkayed NJ. Polymorphisms in the Human Soluble Epoxide Hydrolase Gene Ephx2 Linked to Neuronal Survival after Ischemic Injury. J. Neurosci. 2007;27(17):4642–4649. doi: 10.1523/JNEUROSCI.0056-07.2007. [DOI] [PMC free article] [PubMed] [Google Scholar]
- Koller K, Brown T, Spurgeon A, Levy L. Recent Developments in Low-Level Lead Exposure and Intellectual Impairment in Children. Environ. Health Perspect. 2004;112(9):987–994. doi: 10.1289/ehp.6941. [DOI] [PMC free article] [PubMed] [Google Scholar]
- Konishi Y, Takahashi K, Chui DH, Rosenfeld RG, Himeno M, Tabira T. Insulin-Like Growth Factor Ii Promotes in Vitro Cholinergic Development of Mouse Septal Neurons: Comparison with the Effects of Insulin-Like Growth Factor I. Brain Res. 1994;649(1-2):53–61. doi: 10.1016/0006-8993(94)91048-0. [DOI] [PubMed] [Google Scholar]
- Konradi C, Heckers S. Molecular Aspects of Glutamate Dysregulation: Implications for Schizophrenia and Its Treatment. Pharmacology & therapeutics. 2003;97(2):153–179. doi: 10.1016/s0163-7258(02)00328-5. [DOI] [PMC free article] [PubMed] [Google Scholar]
- Labrie V, Fukumura R, Rastogi A, Fick LJ, Wang W, Boutros PC, Kennedy JL, Semeralul MO, Lee FH, Baker GB, Belsham DD, Barger SW, Gondo Y, Wong AH, Roder JC. Serine Racemase Is Associated with Schizophrenia Susceptibility in Humans and in a Mouse Model. Hum. Mol. Genet. 2009;18(17):3227–3243. doi: 10.1093/hmg/ddp261. [DOI] [PMC free article] [PubMed] [Google Scholar]
- Lanphear BP, Dietrich K, Auinger P, Cox C. Cognitive Deficits Associated with Blood Lead Concentrations <10 Microg/Dl in Us Children and Adolescents. Public Health Rep. 2000;115(6):521–529. doi: 10.1093/phr/115.6.521. [DOI] [PMC free article] [PubMed] [Google Scholar]
- Leasure JL, Giddabasappa A, Chaney S, Johnson JE, Jr, Pothakos K, Lau YS, Fox DA. Low-Level Human Equivalent Gestational Lead Exposure Produces Sex-Specific Motor and Coordination Abnormalities and Late-Onset Obesity in Year-Old Mice. Environ. Health Perspect. 2008;116:355–361. doi: 10.1289/ehp.10862. [DOI] [PMC free article] [PubMed] [Google Scholar]
- Lidsky TI, Schneider JS. Society for Neusocience. Washington DC: 2000. Neuropsychological Sequelae of Pediatric Lead Exposure: Is There a Behavioral Signature? [Google Scholar]
- Liebner S, Corada M, Bangsow T, Babbage J, Taddei A, Czupalla CJ, Reis M, Felici A, Wolburg H, Fruttiger M, Taketo MM, von Melchner H, Plate KH, Gerhardt H, Dejana E. Wnt/Beta-Catenin Signaling Controls Development of the Blood-Brain Barrier. J. Cell Biol. 2008;183(3):409–417. doi: 10.1083/jcb.200806024. [DOI] [PMC free article] [PubMed] [Google Scholar]
- Lin Y, Ter Horst GJ, Wichmann R, Bakker P, Liu A, Li X, Westenbroek C. Sex Differences in the Effects of Acute and Chronic Stress and Recovery after Long-term Stress on Stress-related Brain Regions of Rats. Cerebral Cortex. 2009;19(9):1978–1989. doi: 10.1093/cercor/bhn225. [DOI] [PMC free article] [PubMed] [Google Scholar]
- Madeira C, Freitas ME, Vargas-Lopes C, Wolosker H, Panizzutti R. Increased Brain D-Amino Acid Oxidase (Daao) Activity in Schizophrenia. Schizophr. Res. 2008;101(1-3):76–83. doi: 10.1016/j.schres.2008.02.002. [DOI] [PubMed] [Google Scholar]
- Mak GK, Enwere EK, Gregg C, Pakarainen T, Poutanen M, Huhtaniemi I, Weiss S. Male Pheromone-Stimulated Neurogenesis in the Adult Female Brain: Possible Role in Mating Behavior. Nat. Neurosci. 2007;10(8):1003–1011. doi: 10.1038/nn1928. [DOI] [PubMed] [Google Scholar]
- Malaterre J, Ramsay RG, Mantamadiotis T. WNT-Frizzled Signaling and the Many Paths to Neural Development and Adult Brain Homeostatsis. Frontiers in Biosci. 2007;12(2):492–506. doi: 10.2741/2077. [DOI] [PubMed] [Google Scholar]
- McMichael AJ, Baghurst PA, Vimpani GV, Robertson EF, Wigg NR, Tong SL. Sociodemographic Factors Modifying the Effect of Environmental Lead on Neuropsychological Development in Early Childhood. Neurotoxicol. Teratol. 1992;14(5):321–327. doi: 10.1016/0892-0362(92)90038-c. [DOI] [PubMed] [Google Scholar]
- Meier S, Brauer AU, Heimrich B, Schwab ME, Nitsch R, Savaskan NE. Molecular Analysis of Nogo Expression in the Hippocampus During Development and Following Lesion and Seizure. FASEB J. 2003;17(9):1153–1155. doi: 10.1096/fj.02-0453fje. [DOI] [PubMed] [Google Scholar]
- Miquelajauregui A, Van de Putte T, Polyakov A, Nityanandam A, Boppana S, Seuntjens E, Karabinos A, Higashi Y, Huylebroeck D, Tarabykin V. Smad-Interacting Protein-1 (Zfhx1b) Acts Upstream of Wnt Signaling in the Mouse Hippocampus and Controls Its Formation. Proc. Natl. Acad. Sci. U. S. A. 2007;104(31):12919–12924. doi: 10.1073/pnas.0609863104. [DOI] [PMC free article] [PubMed] [Google Scholar]
- Mizoguchi H, Ibi D, Takuma K, Toth E, Sato J, Itohara S, Nabeshima T, Yamada K. Alterations of Emotional and Cognitive Behaviors in Matrix Metalloproteinase-2 and -9 Deficient Mice. The OPen Behavioral Science J. 2010;4:19–25. [Google Scholar]
- Mocchegiani E, Malavolta M. Zinc Dyshomeostasis, Ageing and Neurodegeneration: Implications of A2m and Inflammatory Gene Polymorphisms. Journal of Alzheimer’s disease : JAD. 2007;12(1):101–109. doi: 10.3233/jad-2007-12110. [DOI] [PubMed] [Google Scholar]
- Mocchetti I, Bachis A, Masliah E. Chemokine Receptors and Neurotrophioc Factors: Potential Therapy Against AIDS Dementia? J. Neurosci. Res. 2008;86(2):243–255. doi: 10.1002/jnr.21492. [DOI] [PubMed] [Google Scholar]
- Moreira EG, Vassilieff I, Vassilieff VS. Developmental Lead Exposure: Behavioral Alterations in the Short and Long Term. Neurotoxicol. Teratol. 2001;23(5):489–495. doi: 10.1016/s0892-0362(01)00159-3. [DOI] [PubMed] [Google Scholar]
- Nakamura E, Kadomatsu K, Yuasa S, Muramatsu H, Mamiya T, Nabeshima T, Fan QW, Ishiguro K, Igakura T, Matsubara S, Kaname T, Horiba M, Saito H, Muramatsu T. Disruption of the Midkine Gene (Mdk) Resulted in Altered Expression of a Calcium Binding Protein in the Hippocampus of Infant Mice and Their Abnormal Behaviour. Genes Cells. 1998;3(12):811–822. doi: 10.1046/j.1365-2443.1998.00231.x. [DOI] [PubMed] [Google Scholar]
- Ngun TC, Ghahramani N, Sanchez FJ, Bocklandt S, Vilain E. The Genetics of Sex Differences in Brain and Behavior. Front. Neuroendocrinol. 2010 doi: 10.1016/j.yfrne.2010.10.001. [DOI] [PMC free article] [PubMed] [Google Scholar]
- Nihei MK, Guilarte TR. Nmdar-2a Subunit Protein Expression Is Reduced in the Hippocampus of Rats Exposed to Pb2+ During Development. Mol Brain Res. 1999;66(1-2):42–49. doi: 10.1016/s0169-328x(99)00005-4. [DOI] [PubMed] [Google Scholar]
- Opler MG, Brown AS, Graziano J, Desai M, Zheng W, Schaefer C, Factor-Litvak P, Susser ES. Prenatal Lead Exposure, Delta-Aminolevulinic Acid, and Schizophrenia. Environ. Health Perspect. 2004;112(5):548–552. doi: 10.1289/ehp.6777. [DOI] [PMC free article] [PubMed] [Google Scholar]
- Opler MG, Buka SL, Groeger J, McKeague I, Wei C, Factor-Litvak P, Bresnahan M, Graziano J, Goldstein JM, Seidman LJ, Brown AS, Susser ES. Prenatal Exposure to Lead, Delta-Aminolevulinic Acid, and Schizophrenia: Further Evidence. Environ. Health Perspect. 2008;116(11):1586–1590. doi: 10.1289/ehp.10464. [DOI] [PMC free article] [PubMed] [Google Scholar]
- Orabona GM, Griesi-Oliveira K, Vadasz E, Bulcao VL, Takahashi VN, Moreira ES, Furia-Silva M, Ros-Melo AM, Dourado F, Matioli SR, Otto P, Passos-Bueno MR. Htr1b and Htr2c in Autism Spectrum Disorders in Brazilian Families. Brain Res. 2009;1250:14–19. doi: 10.1016/j.brainres.2008.11.007. [DOI] [PubMed] [Google Scholar]
- Paschen W, Linden T, Doutheil J. Effects of Transient Cerebral Ischemia on Hsp40 Mrna Levels in Rat Brain. Molecular brain research. 1998;55(2):341–344. doi: 10.1016/s0169-328x(98)00027-8. [DOI] [PubMed] [Google Scholar]
- Pueschel SM, Linakis JG, Anderson AC, Pueschel SM, Linakis JG, Anderson AC. Lead Poisoning in Childhood. P.H. Brooks Publishing; Baltimore, MD: 1996. Lead Poisoning: A Historical Perspective; pp. 1–13. [Google Scholar]
- Rabinowitz MB, Wang JD, Soong WT. Dentine Lead and Child Intelligence in Taiwan. Arch. Environ. Health. 1991;46(6):351–360. doi: 10.1080/00039896.1991.9934402. [DOI] [PubMed] [Google Scholar]
- Reynolds CA, Gatz M, Berg S, Pedersen NL. Genotype-Environment Interactions: Aognitive Aging and Social Factors. Twin Res. Human Gen. 2007;10(2):214–254. doi: 10.1375/twin.10.2.241. [DOI] [PubMed] [Google Scholar]
- Roberts LM, Woodford K, Zhou M, Black DS, Haggerty JE, Tate EH, Grindstaff KK, Mengesha W, Raman C, Zerangue N. Expression of the Thyroid Hormone Transporters Monocarboxylate Transporter-8 (Slc16a2) and Organic Ion Transporter-14 (Slco1c1) at the Blood-Brain Barrier. Endocrinology. 2008;149(12):6251–6261. doi: 10.1210/en.2008-0378. [DOI] [PubMed] [Google Scholar]
- Shibasaki K, Suzuki M, Mizuno A, Tominaga M. Effects of Body Temperature on Neural Activity in the Hippocampus: Regulation of Resting Membrane Potentials by Transient Receptor Potential Vanilloid 4. J. Neurosci. 2007;27(7):1566–1575. doi: 10.1523/JNEUROSCI.4284-06.2007. [DOI] [PMC free article] [PubMed] [Google Scholar]
- Silva AJ, Kogan JH, Frankland PW, Kida S. Creb and Memory. Annu. Rev. Neurosci. 1998;21:127–148. doi: 10.1146/annurev.neuro.21.1.127. [DOI] [PubMed] [Google Scholar]
- Sirri A, Bianchi V, Pelizzola M, Mayhaus M, Ricciardi-Castagnoli P, Toniolo D, D’Adamo P. Temporal Gene Expression Profile of the Hippocampus Following Trace Fear Conditioning. Brain Res. 2010;1308:14–23. doi: 10.1016/j.brainres.2009.10.049. [DOI] [PubMed] [Google Scholar]
- Sleegers K, den Heijer T, van Dijk EJ, Hofman A, Bertoli-Avella AM, Koudstaal PJ, Breteler MM, van Duijn CM. Ace Gene Is Associated with Alzheimer’s Disease and Atrophy of Hippocampus and Amygdala. Neurobiol. Aging. 2005;26(8):1153–1159. doi: 10.1016/j.neurobiolaging.2004.09.011. [DOI] [PubMed] [Google Scholar]
- Soeiro AC, Gouvea TS, Moreira EG. Behavioral Effects Induced by Subchronic Exposure to Pb and Their Reversion Are Concentration and Gender Dependent. Human & experimental toxicology. 2007;26(9):733–739. doi: 10.1177/0960327107083016. [DOI] [PubMed] [Google Scholar]
- Storey JD, Tibshirani R. Statistical Significance for Genomewide Studies. Proc. Natl. Acad. Sci. U. S. A. 2003;100(16):9440–9445. doi: 10.1073/pnas.1530509100. [DOI] [PMC free article] [PubMed] [Google Scholar]
- Szklarczyk A, Lapinska J, Rylski M, McKay RD, Kaczmarek L. Matrix Metalloproteinase-9 Undergoes Expression and Activation During Dendritic Remodeling in Adult Hippocampus. J. Neurosci. 2002;22(3):920–930. doi: 10.1523/JNEUROSCI.22-03-00920.2002. [DOI] [PMC free article] [PubMed] [Google Scholar]
- Tong S, McMichael AJ, Baghurst PA. Interactions between Environmental Lead Exposure and Sociodemographic Factors on Cognitive Development. Arch. Environ. Health. 2000;55(5):330–335. doi: 10.1080/00039890009604025. [DOI] [PubMed] [Google Scholar]
- Torbati D, Totapally BR, Raszynski A, Osborne J, Zyl L, Kalomiris S, Wolfsdorf J. Age and Sex Differences in Brain Gene Expression in Neonatal Rats. Neuropediatrics. 2008;39(4):219–225. doi: 10.1055/s-0028-1105923. [DOI] [PubMed] [Google Scholar]
- Toscano CD, Guilarte TR. Lead Neurotoxicity: From Exposure to Molecular Effects. Brain Res Rev. 2005;49(3):529–554. doi: 10.1016/j.brainresrev.2005.02.004. [DOI] [PubMed] [Google Scholar]
- Tsai G, Coyle JT. Glutamatergic Mechanisms in Schizophrenia. Annu. Rev. Pharmacol. Toxicol. 2002;42:165–179. doi: 10.1146/annurev.pharmtox.42.082701.160735. [DOI] [PubMed] [Google Scholar]
- Ye P, Carson J, D’Ercole AJ. In Vivo Actions of Insulin-Like Growth Factor-I (Igf-I) on Brain Myelination: Studies of Igf-I and Igf Binding Protein-1 (Igfbp-1) Transgenic Mice. J. Neurosci. 1995;15(11):7344–7356. doi: 10.1523/JNEUROSCI.15-11-07344.1995. [DOI] [PMC free article] [PubMed] [Google Scholar]
- Ye P, Carson J, D’Ercole AJ. Insulin-Like Growth Factor-I Influences the Initiation of Myelination: Studies of the Anterior Commissure of Transgenic Mice. Neurosci. Lett. 1995;201(3):235–238. doi: 10.1016/0304-3940(95)12194-3. [DOI] [PubMed] [Google Scholar]
- Zhang XY, Liu AP, Ruan DY, Liu J. Effect of Developmental Lead Exposure on the Expression of Specific Nmda Receptor Subunit Mrnas in the Hippocampus of Neonatal Rats by Digoxigenin-Labeled in Situ Hybridization Histochemistry. Neurotoxicol. Teratol. 2002;24(2):149–160. doi: 10.1016/s0892-0362(01)00210-0. [DOI] [PubMed] [Google Scholar]
Associated Data
This section collects any data citations, data availability statements, or supplementary materials included in this article.