Abstract
NMR restrictions are suitable to specify the geometry of a molecule when a single well defined global free energy minimum exists that is significantly lower than other local minima. Carbohydrates are quite flexible and therefore NMR observables do not always correlate with a single conformer but instead with an ensemble of low free energy conformers that can be accessed by thermal fluctuations. In this communication we describe a novel procedure to identify and weight the contribution to the ensemble of local minima conformers based on comparison to residual dipolar couplings (RDCs), or other NMR observables, such as scalar couplings. A genetic algorithm is implemented to globally minimize the R factor comparing calculated RDCs to experiment. This is done by optimizing the weights of different conformers derived from the exhaustive local minima conformational search program, fast sugar structure prediction software (FSPS). We apply this framework to six human milk sugars, LND-1, LNF-1, LNF-2, LNF-3, LNnT and LNT, and are able to determine corresponding population weights for the ensemble of conformers. Interestingly, our results indicate that in all cases the RDCs can be well represented by only a few most important conformers. This confirms that several, but not all of the glycosidic linkages in histo-blood group “epitopes” are quite rigid.
Carbohydrates play an important role in many molecular recognition phenomena. Their flexibility in solution is often important to their function1,2 and has been investigated for several simple disaccharides, complex oligosaccharides and polysaccharides.3-5 Bush and coworkers have categorized their flexibility as that arising either from fluctuations within a single free energy minimum or due to transitions among different minima in glycosidic linkage space.5
For complex oligosaccharides, residual dipolar coupling (RDC)6 measurements in anisotropic solution environments provide important global structural information. Calculating RDCs from structure requires knowing first the alignment tensor of a given model structure or rigid fragment. A singluar value decomposition (SVD) method7 is often used to fit the alignment tensor to experimental data and the particular rigid domain.8 However, this method is not suitable for flexible molecules for which a single global alignment tensor does not exist. Furthermore, deriving the alignment tensor using SVD requires at least 5 independent RDC values from each rigid structure fragment, and often significant uncertainty is present in the form of “structural noise”. This is particularly problematic when only few dipolar couplings are available for fitting.9
Alternatively, for flexible systems, the alignment tensor has often been estimated from simulations.10 For example, the PALES approach10 estimates the alignment tensor by performing a Monte Carlo search of molecules in the vicinity of an infinite two dimensional plate. Several other methods estimate the alignment tensor from 3D molecular conformation, using the radius of gyration tensor,11 the moment of inertia,12 or a direct integration in two or four dimensional space related to the Euler angles of molecular orientations.13
The idea of estimating the alignment tensor from molecular shape11 has been applied in several research groups14-21 to build ensembles of partially-folded or unfolded proteins. We show here that broadly similar ideas, adapted to carbohydrates, provide remarkable insights into the conformational ensemble of oligosaccharides. Residual dipolar couplings in liquid crystal media have been utilized to determine the conformational structure of several carbohydrates.2,4,5,22,23 However, significant challenges exist for the wide applicability of RDCs to study complex sugars. Firstly, obtaining RDCs of five independent C-H or C-C one bond vectors from the same monosaccharide residue is difficult since many of them are parallel or anti-parallel to each other. RDCs from two-bond or three-bond C-H and H-H vectors (with larger relative errors) have to be measured for the complete determination of the alignment tensor of each saccharide residue via the SVD method. Secondly, one has to deal with the fact that significant structural flexibility occurs in carbohydrates at the φ−ψ glycosidic linkages between monosaccharide residues which hinders the use of traditional NMR refinement methods based on single structural restrictions.2,22
Recently the Margulis group has developed a fast structural prediction software (FSPS) to search for energy minima in glycosidic conformation space with the assistance of NMR data.24 The general framework includes four major steps: 1) a coarse-grained systematic search in dihedral space for intramolecular clashes 2) energy optimizations of sterically allowed conformers in the gas phase or in implicit solvent through an interface to external molecular modeling packages 3) pooling large numbers of energy minimized structures into a smaller set of unique consensus structures that are conformationally and energetically similar and 4) producing a ranking of these groups of conformers in comparison to calculated NMR observables such as NOEs, RDCs or J couplings. The limitation with this approach is that so far the NMR observables have only been compared to those derived from individual conformers instead of against a properly weighted ensemble of conformers. This approach is destined to fail when significant flexibility is present.
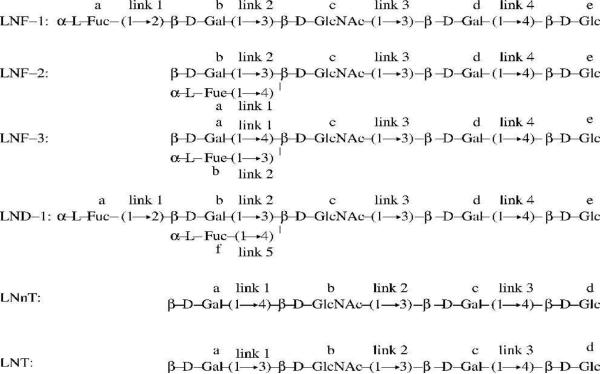
Because of their relevance to the immune system of infants,25 and because several of these systems have already been the subject of detailed RDC as well as other NMR techniques studies,4,5,26,27 and computational studies,24 we focus here on six different human milk oligosaccharides, LNF-1, LNF-2, LNF-3, LND-1, LNnT and LNT shown in Scheme 1.
Scheme 1.
Chemical sequences of human milk sugars LNF-1, LNF-2, LNF-3, LND-1, LNnT and LNT and corresponding definitions for residues and linkages used throughout this article.
In this communication we present a framework to search for the best conformational ensemble of oligosaccharides that when properly weighted, match experimental RDC data in solution. We assume that each conformer within the ensemble has an alignment tensor and a corresponding set of RDC values, and that the population averaged RDCs correspond to experimental values. Abandoning the philosophy of restrained MD simula tions that match NMR constraints, we instead develop two independent programs using random walk Monte Carlo (RWMC) and a genetic algorithm (GA) to optimize the weights given to each conformer previously obtained from the exhaustive FSPS algorithm.24 The total number of conformers derived from FSPS in each case (see reference24) varies roughly from 1000 to 10,000, depending on the number of monosaccharide residues involved. These oligosaccharides thus provide a good test case: they are large enough to have significant flexibility, yet small enough to permit a systematic exploration of the conformational space.
In a previous article24 we computed RDC values for each of these oligosaccharide conformers by deriving the alignment tensor from the gyration tensor of molecular shape11 (See Equations 1S to 4S in the supporting information). The R factor28 between RDCs corresponding to individual conformers and those reported experimentally5 were then obtained using Equation 5S in the supporting information. In this way a RDC ranking of R factors was constructed, with the smallest R value, representing the best single conformational structure in comparison with experiments. In the current study on multi-conformers we have found that such pre-ranking of individual structures is very useful in order to bias the initial condition, and is crucial for fast convergence on such a large number of conformers (between 1000 and 10,000).
Results from our multiple-structure optimization of R factors are shown in Table 1 in comparison with experimental data from the group of Allen Bush5 for human milk sugars LNF-1, LNF-2, LNF-3, LND-1, LNnT and LNT. In each case, the averaged RDC value for the ith spin vector is calculated by weighting the result of individual conformers as described in Equation 1,
| (1) |
where Qki is the ith RDC value of the kth conformer included in the average and Pk is the probability weight of the kth structure.
Table 1.
R factors of calculated RDCs in comparison with experimental data5 for LNF-1, LNF-2, LNF-3, LND-1, LNnT and LNT.
| LNF1 | LNF2 | LNF3 | LND1 | LNn | LNT | |
|---|---|---|---|---|---|---|
| BestSa | 0.188 | 0.137 | 0.365 | 0.207 | 0.094 | 0.101 |
| BestMb | 0.176 | 0.120 | 0.337 | 0.130 | 0.051 | 0.055 |
BestS denotes RDCs calculated from our best single conformer obtained from the FSPS algorithm
BestM corresponds to RDCs from the best multi-structure derived from our genetic algorithm.
Figure 1S compares the efficiency of the RWMC and GA. While an MC step is significantly faster than a generation of the GA, the GA converges to smaller values of the R factor. Because of this we only focus here on results derived from the GA. A set of checks (Table 4S and 5S, Figure 8S, 9S and 10S) in the Supporting Information give us confidence that our results are meaningful and unique. The tests show that populations can be recovered from calculated RDC's in a robust fashion, that the final results are independent of any starting guesses, that ensembles restricted to randomnly chosen subsets of the full space have poorer fits than the full calculation, and that the ability to converge on an ensemble degrades (as expected) as the number of experimental RDC's is reduced.
Table 1 displays R factors of calculated RDCs in comparison with experimental values5 for human milk sugars LNF-1, LNF-2, LNF-3, LND-1, LNnT and LNT (see also Figure 2S and Table 1S in supporting information for detailed RDC values). The R factor of the single best conformer is contrasted against that obtained from the multi-structure fitting algorithm (Equations 1 and 5S). From the R factors listed in Table 1, we see that the multi-structure optimization improves the values of R factor, especially in the case of LND-1, LNnT, and LNT.
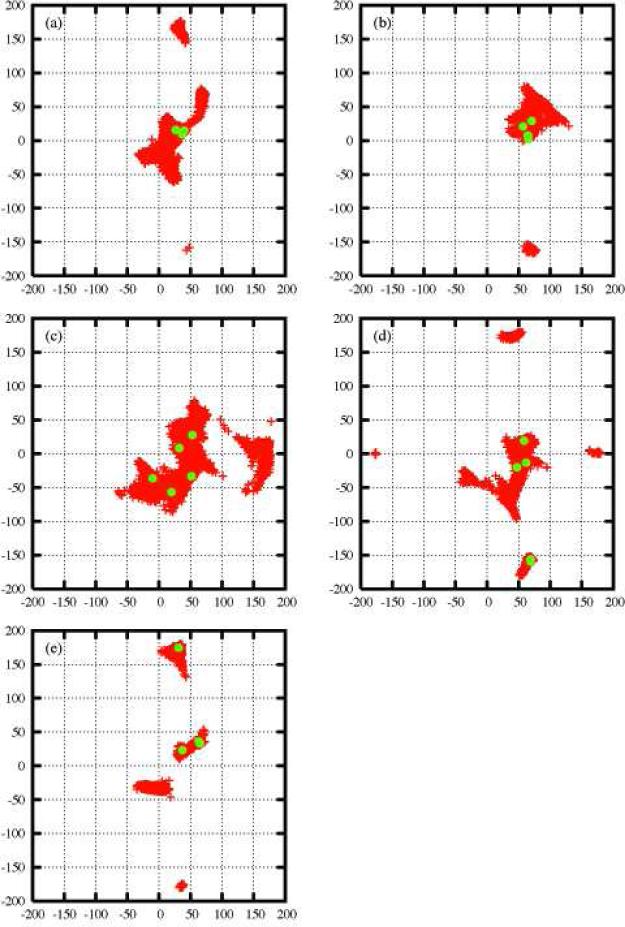
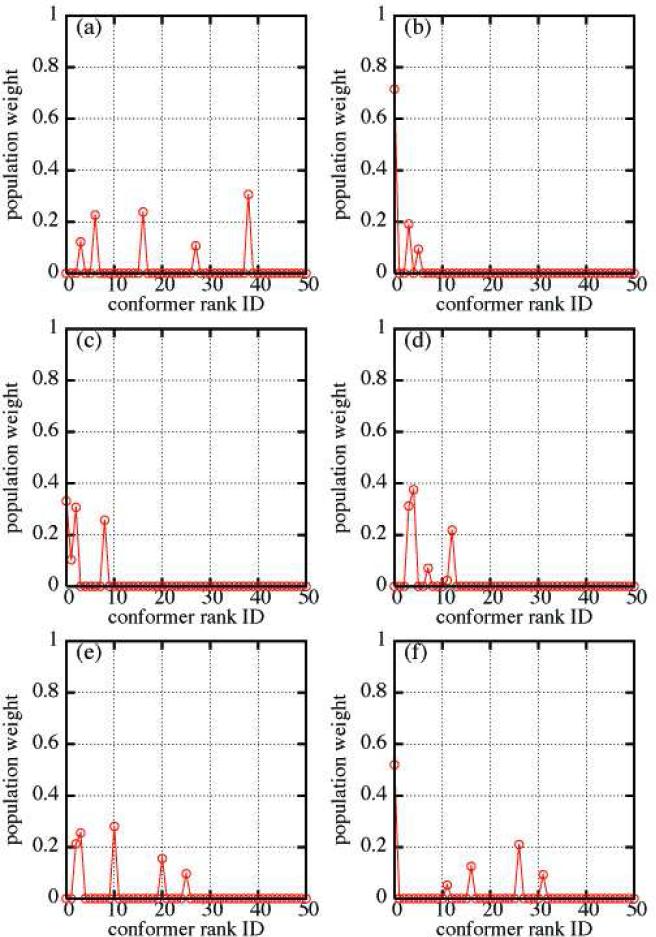
Figure 1 and Figures 3S through 7S in the supporting information show φ and ψ glycosidic dihedral angles for all conformers previously derived from the FSPS algorithm 44 and also the conformers with populations (>1.0×10⁻⁵) from the multi-structure solutions derived from our GA optimization. In all cases, except perhaps for LNF-3, the RDC data can be very well represented by a subensemble of most important conformers. Even in the case of LNF-3 the result from the ensemble optimization is superior to that of a single structure. Perhaps one of the most important findings from this study is that the numbers of relevant conformers with significant weights are small for all studies sugars. 5 in the case of LND-1, 3 for LNF-1, 4 for LNF-2, 5 for LNF-3, 5 for LNnT, and 5 for LNT, with all φ−ψ values listed in Table 2S. The fact that there is only a small number of heavily weighted conformers is an indication that only certain regions in glycosidic space are likely to be important in solution. The reader should be aware that the FSPS is a coarse grained search algorithm in which two conformers are defined as different only if they meet certain angular and energetic difference criteria. It is possible that including conformers derived from local fluctuations around the FSPS generated energy basins may further reduce R factors.
Figure 1.
Distribution of conformations in φ−ψ glycosidic space in the case of LND-1. Red points represent the conformers generated by the FSPS algorithm. The green points are the conformations with highest weights derived from the GA multi-structure fitting to RDCs. (a) Link 1, (b) Link 2, (c) Link 3, (d) Link 4 and (e) Link 5.
From Table 2S, we also note that conformers with weights (>1.0×10⁻⁵) coincide with individual conformations with low R factor. However Figure 2 and Table 2S indicate that the best single conformer with lowest R factor is not necessarily included in the subensemble of most relevant conformations derived from our GA. Only in the cases of LNF-1, LNF-2, and LNT the single structure with best individual R factor also has a significant contributions to the multi-structure averaged RDCs values.
Figure 2.
Population weights of structures in the ensemble that best match experimental RDC data for human milk sugars: (a) LND-1, (b) LNF-1, (c) LNF-2, (d) LNF-3, (e) LNnT and (f) LNT defined in Scheme 1. Conformations with Rank IDs greater than 50 have population weights < 10-5 and are not shown.
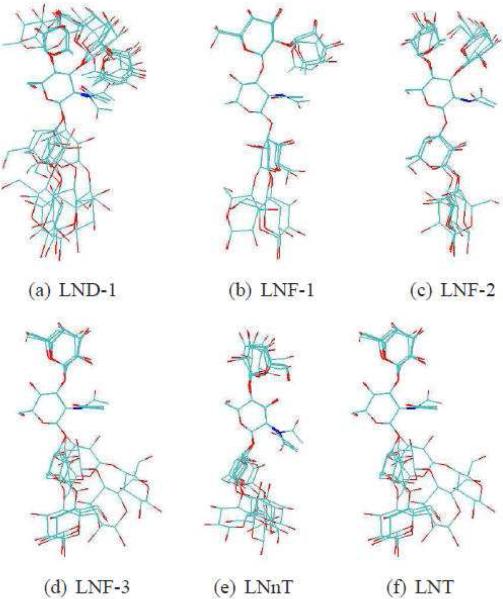
From the sequences depicted in Scheme 1, we see that all six sugars have two common linkages at the reducing (right) end, β-D-GlcNAc-(1→3)-β-D-Gal, and β-D-Gal-(1→4)-β-D-Glc (link 3 and 4 for the first four sugars, link 2 and 3 for the other two). The remaining linkages constitute the histo-blood group epitopes: H type 3 for LNF-1, Lewisa for LNF-2, LewisX for LNF-3, and Lewisb for LND-1. The subensemble of most important conformers derived from our GA algorithm (green dots in Figure 1) as well as Figures 3S through 7S indicate that the major conformational variability arises from two common linkages (see (c) and (d) in Figure 1). In contrast, the histo-blood group epitopes appear to have less conformational flexibility, namely, the distributions of φ−ψ values are restricted to small regions; see green dots in (a) and (b) of Figure 1, as compared to those in (c) and (d) of the same figure. These results become more obvious as we perform visual check and RMSD calculation as follows. The 3D pictures of the most important conformers derived from the GA for all oligosaccha-rides studied are shown in Figure 3. In most of cases visual inspection of these most important conformers appear to indicate that epitopes have less conformational variability. This is most clear in the cases of LNT, LNnT and LNF-1. In Table 3S, we show quantitative results that for all studied sugars the averaged RMSDs of epitopes are significantly smaller than that of common linkages. The picture of relatively small structural changes in histo-blood group epitopes and more flexible in the common linkages is consistent with the conclusions from previous RDC and NOE experiments5,26 as well as with molecular dynamics simulations in explicit solvent using the CHARMm force field26 and the OPLS-AA force field.24 It is clear from Figure 3 that epitopes are not absolutely rigid. In particular LND-1 and LNF-3 appear to have a more diverse set of relevant conformers.
Figure 3.
The best subensembles of conformers derived from out GA multistructure fitting. The glycosidic dihedral angles and populations are listed in Table 2S. (all H atoms were deleted and all structures were aligned to β-D-GlcNAc).
Based on their RDC data,5b Martin-Pastor and Bush have proposed two best structures for each of the sugars in Scheme 1. These authors justified their assignment on the reasonable approximation that the substructures defining the histo-blood groups are semi-rigid in solution. They then carried out a systematic search in the reduced dihedral space of the linkages that are not the histo-blood groups and that are common to the different oligosaccharides. While their results are very reasonable, in our study we did not have any constraints on the histo-blood group epitopes. Instead the subensemble of conformers that contribute the most to the averaged RDCs come from exploring the full dimensional space of all glycosidic linkages. That is why our weighted averages over conformers exhibit significantly lower R factors as can be seen in Table 1. Furthermore, our approach provides not only important conformers, but also population weights which are crucial for predicting properties of flexible sugars.
In summary, we have created a program based on a genetic algorithm that is capable of generating the best set of statistical weights for conformers derived from the FSPS program, or any other suitable conformational space sampling method. When the set of RDC values for computationally derived conformers are properly weighted, we obtain excellent agreement with experimental RDC values. We have used this algorithm to derive the subensemble of conformers that appears to be most important in the case of six different complex human milk sugars. The number of conformers chosen by the algorithm as having significant weights is small and provides an indication of which local minima are most important when these sugars are aligned in RDC studies. In our calculations, the alignment tensors of RDCs were estimated from the molecular shapes, which assumes that alignment is induced by steric factors. For other molecules and media, especially those with large charges, alignment by electrostatic forces might be dominant, and their alignment tensors could be estimated by other methods.10
The GA program is totally independent from the FSPS conformation search program.24 Accordingly it is also applicable to structures obtained from other conformation search programs and even the trajectory conformations from standard molecular simulation packages. In addition, the general procedure is also applicable to other NMR observables not just RDC measurements. We are planning to expand the code to perform predictions of conformer weights based on chemical shifts and J couplings. The resulting populations might also be used to calibrate force fields in molecular dynamics simulations.
Supplementary Material
ACKNOWLEDGMENT
This research was funded by NIH Grant GM45811 (DAC), and by Grant 05-2182 from the Roy J. Carver Charitable Trust (CJM).
Footnotes
Supporting Information Placeholder
Supporting Information. A description of the GA and RWMC algorithms, tests of algorithms, experimental and calculated RDC data, as well as the distributions of φ−ψ glycosidic angles are included as supporting information. This material is available free of charge via the Internet at http://pubs.acs.org
REFERENCES
- 1.a Cumming DA, Carver JP. Biochemistry. 1987;26:6664. doi: 10.1021/bi00395a016. [DOI] [PubMed] [Google Scholar]; b Imberty A, Perez S. Chem. Rev. 2000;100:4567. doi: 10.1021/cr990343j. [DOI] [PubMed] [Google Scholar]
- 2.Kiddle GR, Homans SW. Febs Lett. 1998;436:128. doi: 10.1016/s0014-5793(98)01112-0. [DOI] [PubMed] [Google Scholar]
- 3.a Almond A, DeAngelis PL, Blundell CD. J. Am. Chem. Soc. 2005;127:1086. doi: 10.1021/ja043526i. [DOI] [PubMed] [Google Scholar]; b Eklund R, Lycknert K, Soderman P, Widmalm G. J. Phys. Chem. B. 2005;109:19936. doi: 10.1021/jp053198o. [DOI] [PubMed] [Google Scholar]; c Angulo J, Hricovini M, Gairi M, Guerini M, de Paz JL, Ojeda R, Martin-Lomas M, Nieto PM. Glycobiology. 2005;15:1008. doi: 10.1093/glycob/cwi091. [DOI] [PubMed] [Google Scholar]; d Henderson TJ, Venable RM, Egan W. J. Am. Chem. Soc. 2003;125:2930. doi: 10.1021/ja0210087. [DOI] [PubMed] [Google Scholar]; e Rundlof T, Venable RM, Pastor RW, Kowalewski J, Widmalm G. J. Am. Chem. Soc. 1999;121:11847. [Google Scholar]
- 4.a Landersjo C, Jansson JLM, Maliniak A, Widmalm G. J. Phys. Chem. B. 2005;109:17320. doi: 10.1021/jp052206y. [DOI] [PubMed] [Google Scholar]; b Landersjo C, Hoog C, Maliniak A, Widmalm G. J. Phys. Chem. B. 2000;104:5618. [Google Scholar]
- 5.a Martin-Pastor M, Bush CA. Biochemistry. 1999;38:8045. doi: 10.1021/bi9904205. [DOI] [PubMed] [Google Scholar]; b Martin-Pastor M, Bush CA. Biochemistry. 2000;39:4674. doi: 10.1021/bi992050q. [DOI] [PubMed] [Google Scholar]; c Martin-Pastor M, Bush CA. Carbohydr. Res. 2000;323:147. doi: 10.1016/s0008-6215(99)00237-2. [DOI] [PubMed] [Google Scholar]; d Ganguly S, Xia JC, Margulis C, Stanwyck L, Bush CA. Biopolymers. 2011;95:39. doi: 10.1002/bip.21532. [DOI] [PubMed] [Google Scholar]
- 6.Tjandra N, Bax A. Science. 1997;278:1111. doi: 10.1126/science.278.5340.1111. [DOI] [PubMed] [Google Scholar]
- 7.Losonczi JA, Andrec M, Fischer MWF, Prestegard JH. J. of Magn. Reson. 1999;138:334. doi: 10.1006/jmre.1999.1754. [DOI] [PubMed] [Google Scholar]
- 8.a Fischer MWF, Losonczi JA, Weaver JL, Prestegard JH. Biochemistry. 1999;38:9013. doi: 10.1021/bi9905213. [DOI] [PubMed] [Google Scholar]; b Bewley CA, Clore GM. J. Am. Chem. Soc. 2000;122:6009. [Google Scholar]; c Mollova ET, Hansen MR, Pardi A. J. Am. Chem. Soc. 2000;122:11561. [Google Scholar]
- 9.Zweckstetter M, Bax A. J. Biomol. NMR. 2002;23:127. doi: 10.1023/a:1016316415261. [DOI] [PubMed] [Google Scholar]
- 10.a Zweckstetter M. Nat. Protoc. 2008;3:679. doi: 10.1038/nprot.2008.36. [DOI] [PubMed] [Google Scholar]; b Zweckstetter M, Bax A. J. Am. Chem. Soc. 2000;122:3791. [Google Scholar]
- 11.Almond A, Axelsen JB. J. Am. Chem. Soc. 2002;124:9986. doi: 10.1021/ja026876i. [DOI] [PubMed] [Google Scholar]
- 12.Azurmendi HF, Bush CA. J. Am. Chem. Soc. 2002;124:2426. doi: 10.1021/ja017524z. [DOI] [PubMed] [Google Scholar]
- 13.a Fernandes MX, Bernado P, Pons M, de la Torre JG. J. Am. Chem. Soc. 2001;123:12037. doi: 10.1021/ja011361x. [DOI] [PubMed] [Google Scholar]; b Berlin K, O'Leary DP, Fushman D. J. Magn. Reson. 2009;201:25. doi: 10.1016/j.jmr.2009.07.028. [DOI] [PMC free article] [PubMed] [Google Scholar]
- 14.Esteban-Martin S, Fenwick RB, Salvatella X. J. Am. Chem. Soc. 2010;132:4626. doi: 10.1021/ja906995x. [DOI] [PubMed] [Google Scholar]
- 15.Bernado P, Blanchard L, Timmins P, Marion D, Ruigrok RWH, Blackledge M. Proc. Natl. Acad. Sci. U.S.A. 2005;102:17002. doi: 10.1073/pnas.0506202102. [DOI] [PMC free article] [PubMed] [Google Scholar]
- 16.Jha AK, Colubri A, Freed KF, Sosnick TR. Proc. Natl. Acad. Sci. U.S.A. 2005;102:13099. doi: 10.1073/pnas.0506078102. [DOI] [PMC free article] [PubMed] [Google Scholar]
- 17.Marsh JA, Baker JMR, Tollinger M, Forman-Kay JD. J. Am. Chem. Soc. 2008;130:7804. doi: 10.1021/ja802220c. [DOI] [PubMed] [Google Scholar]
- 18.Jha AK, Colubri A, Zaman MH, Koide S, Sosnick TR, Freed KF. Biochemistry. 2005;44:9691. doi: 10.1021/bi0474822. [DOI] [PubMed] [Google Scholar]
- 19.Hus JC, Marion D, Blackledge M. J. Am. Chem. Soc. 2001;123:1541. doi: 10.1021/ja005590f. [DOI] [PubMed] [Google Scholar]
- 20.Nodet G, Salmon L, Ozenne V, Meier S, Jensen MR, Blackledge M. J. Am. Chem. Soc. 2009;131:17908. doi: 10.1021/ja9069024. [DOI] [PubMed] [Google Scholar]
- 21.Marsh JA, Neale C, Jack FE, Choy WY, Lee AY, Crowhurst KA, Forman-Kay JD. J. Mol. Bio. 2007;367:1494. doi: 10.1016/j.jmb.2007.01.038. [DOI] [PubMed] [Google Scholar]
- 21.Tian F, Al-Hashimi HM, Craighead JL, Prestegard JH. J. Am. Chem. Soc. 2001;123:485. doi: 10.1021/ja002900l. [DOI] [PubMed] [Google Scholar]
- 23.Venable RM, Delaglio F, Norris SE, Freedberg DI. Carbohydr. Res. 2005;340:863. doi: 10.1016/j.carres.2005.01.025. [DOI] [PubMed] [Google Scholar]
- 24.a Xia JC, Daly RP, Chuang FC, Parker L, Jensen JH, Margulis CJ. J. Chem. Theory Comput. 2007;3:1620. doi: 10.1021/ct700033y. [DOI] [PubMed] [Google Scholar]; b Xia JC, Daly RP, Chuang FC, Parker L, Jensen JH, Margulis CJ. J. Chem. Theory Comput. 2007;3:1629. doi: 10.1021/ct700034q. [DOI] [PubMed] [Google Scholar]; c Xia JC, Margulis CJ. J. Biomol. NMR. 2008;42:241. doi: 10.1007/s10858-008-9279-6. [DOI] [PubMed] [Google Scholar]; d Xia JC, Margulis C. J. Biomacromolecules. 2009;10:3081. doi: 10.1021/bm900756q. [DOI] [PubMed] [Google Scholar]
- 25.a Morrow AL, Ruiz-Palacios GM, Jiang X, Newburg DS. J. Nutr. 2005;135:1304. doi: 10.1093/jn/135.5.1304. [DOI] [PubMed] [Google Scholar]; b Newburg DS, Ruiz-Palacios GM, Morrow AL. Annu. Rev. Nutr. 2005;25:37. doi: 10.1146/annurev.nutr.25.050304.092553. [DOI] [PubMed] [Google Scholar]
- 26.Almond A, Petersen BO, Duus JO. Biochemistry. 2004;43:5853. doi: 10.1021/bi0354886. [DOI] [PubMed] [Google Scholar]
- 27.Martin-Pastor M, Canales A, Corzana F, Asensio JL, Jimenez-Barbero J. J. Am. Chem. Soc. 2005;127:3589. doi: 10.1021/ja043445m. [DOI] [PubMed] [Google Scholar]
- 28.Cornilescu G, Marquardt JL, Ottiger M, Bax A. J. Am. Chem. Soc. 1998;120:6836. [Google Scholar]
Associated Data
This section collects any data citations, data availability statements, or supplementary materials included in this article.


