Abstract
Networks made from chitosan and alginate have been utilized as prospective tissue engineering scaffolds due to material biocompatibility and degradability. Calcium (Ca2+) is often added to these networks as a modifier for mechanical strength enhancement. In this work, we examined changes in the bulk material properties of different concentrations of chitosan/alginate mixtures (2%, 3% or 5% w/w) upon adding another modifier, chondroitin. We further examined how material properties depend on the order the modifiers, Ca2+ and chondroitin, were added. It was found that the addition of chondroitin significantly increased the mechanical strength of chitosan/alginate networks. Highest elastic moduli were obtained from samples made with mass fractions of 5% chitosan and alginate, modified by chondroitin first and then Ca2+. The elastic moduli in dry and hydrated states were (4.41 ± 0.52) MPa and (0.11 ± 0.01) MPa, respectively. Network porosity and density were slightly dependent on total polysaccharide concentration. Average pore size was slightly larger in samples modified by Ca2+ first and then chondroitin and in samples made with 3% starting mass fractions. Here, small-angle neutron scattering (SANS) was utilized to examine mesh size of the fibrous networks, mass-fractal parameters and average dimensions of the fiber cross-sections prior to freeze-drying. These studies revealed that addition of Ca2+ and chondroitin modifiers increased fiber compactness and thickness, respectively. Together these findings are consistent with improved network mechanical properties of the freeze-dried materials.
Keywords: chitosan, alginate, chondroitin, compression-tensile tester, freeze-dry, correlation length, fractal dimensions, scanning electron microscopy (SEM), small-angle neutron scattering (SANS)
Introduction
Chitosan has become one of the most commonly utilized biopolymers in biomaterials research. This cationic polysaccharide has many attractive qualities and is abundantly found in nature.1 Chitosan has been widely studied for tissue engineering applications because of its biocompatibility and biodegradability. Its degradation products are glucosamine and N-acetyl glucosamine, amino sugars naturally found in the human body. The hydrophilic surface of chitosan has been shown to promote cell adhesion, proliferation, and differentiation.2–4 Chitosan is also versatile; it is easily moldable and has many functional groups that can be modified to tune material properties.5 However, by itself chitosan is mechanically weak and swells to disassembly in aqueous environments.6
¶Alginate is an anionic polysaccharide that can electrostatically interact with cationic chitosan.7 Upon interaction, alginate and chitosan form fibers which create a gel-like, solid material. This material can be freeze-dried and mechanically tested. Like chitosan, alginate is a widely used biocompatible polymer, which is known to support the proliferation of cells both in vitro and in vivo.8,9 However, on its own alginate is a viscous, weak material. When used as a component in scaffolds, alginate is often modified with divalent cations like Ca2+ to create a strong gel with a characteristic egg box structure.10
A number of networks have been made using combinations of chitosan and alginate with Ca2+ as a modifier. These materials were made by combining and freeze-drying the mixtures to create novel biomaterials. Uses for these networks include bone replacements,11 liver replacements12 and medicated wound dressings.13 These studies have examined chitosan-alginate networks at low polysaccharide mass fractions (0.05% to 2.4%), but give valuable insight about network characteristics such as tunability and cell compatibility. The strongest chitosan-alginate networks to date were made with a mass fraction of 2.4% chitosan and a mass fraction of 2.4% alginate and had a dry compressive elastic modulus of (2.56 ± 0.41) MPa.11 These networks could support osteoblast attachment, proliferation and also calcium deposition. Here, the potential of the chitosan-alginate networks as load-bearing biomaterials was demonstrated. However, these data lacked the important mechanical characteristics in the biologically relevant hydrated state. Therefore, more studies are necessary.
In addition to alginate, chitosan can interact with glycosaminoglycans (GAGs) which are also anionic polysaccharides. GAGs are valuable because they can facilitate the migration and proliferation of progenitor cells promoting tissue regeneration.17,18 Chondroitin sulfate is one kind of commercially available GAG. We found that this anionic polysaccharide creates fibrous, elastic networks with the cationic chitosan upon mixing. Chitosan-chondroitin networks have been used for the controlled release of platelet-derived growth factor for bone regeneration. In vitro drug release could be controlled by adjusting the ratio of chitosan to chondroitin.19
To improve the mechanical properties of the scaffolds, we hypothesize that the incorporation of chondroitin as a second modifier into the chitosan-alginate-Ca2+ network could increase electrostatic interactions and improve its overall strength and flexibility. Further, we examined the effect of the order of adding each of the two modifiers, Ca2+ and chondroitin, on the mechanical strength of the network. To this end, three types of networks were prepared: type A, which are chitosan/alginate networks with Ca2+ as the sole modifier; type B, which are chitosan/alginate networks with Ca2+ added as the 1st modifier and chondroitin added as the 2nd modifier; type C, which are chitosan/alginate networks with chondroitin added as the 1st modifier and Ca2+ added as the 2nd modifier. The resulting freeze-dried networks were tested for their compression and tensile strengths.
To promote cell proliferation and migration in vivo, networks should have high porosity, suitable and non-uniform pore size, and highly interconnected pore structure in addition to biocompatibility and biodegradability.14–16 Therefore, network porosity, density and pore size of the freeze-dried materials were examined to determine the effect of the polysaccharide content, the addition of a 2nd modifier, as well as the addition order of the two modifiers, on these properties.
It would be reasonable to suggest that mechanical strength of the freeze-dried polysaccharide scaffolds would depend on the structural characteristics of the polysaccharide networks formed in solution when mixing the components prior to freeze-drying. Therefore, to aid our understanding of the interactions between the modifiers and the chitosan/alginate scaffold, small-angle neutron scattering (SANS) in solution was used to investigate the impact of the addition of modifiers Ca2+ and chondroitin individually on the structural features of the chitosan/alginate network. This approach has allowed us to trace how the structural features at the level of individual fiber and the polysaccharide network as a whole are translated into the bulk material properties upon freeze-drying.
Materials and Methods
Preparation of Networks for Mechanical and Imaging Studies
Low molecular weight chitosan (50 to 190 kDa, Sigma-Aldrich), alginic acid sodium salt (350 to 450 kDa, Acros Organics), bovine chondroitin sulfate sodium salt (~20 kDa, Pfaltz & Bauer), hydrochloric acid (HCl, VWR), ammonium hydroxide (NH4OH, Mallinckrodt Baker), ethanol (EMD) and calcium chloride dihydrate (CaCl2·2H2O, Mallinckrodt Baker) were used as purchased.
Solutions of mass fractions 2%, 3% and 5% chitosan were prepared in a mass fraction of 2% HCl in ultrapure water (18.2 MOhm, 2 μm cellulose filter) while solutions of mass fractions 2%, 3% and 5% alginate were prepared in a mass fraction of 2% NH4OH. Mass fractions of 1% CaCl2 and 2% chondroitin solutions were prepared in ultrapure water (18.2 MOhm, 2 μm cellulose filter). To prepare sample type A (Figure 1), alginate and chitosan were mixed together at equal concentrations and equal volumes. Type A samples were made at three polysaccharide concentrations by mixing mass fractions of 2% chitosan with mass fractions of 2% alginate, mass fractions of 3% chitosan with mass fractions of 3% alginate and mass fractions of 5% chitosan with mass fractions of 5% alginate, with the resulting samples labeled as 2A, 3A and 5A, respectively. The electrostatic interactions between chitosan and alginate upon mixing resulted in fibrous, gel-like materials. After chitosan and alginate mixing, the 1st modifier, 1% mass fraction CaCl2 solution, was added at a volume ratio of 10:1 chitosan-alginate:CaCl2 for all type A samples. The samples were then placed in a −20°C freezer overnight and then lyophilized. After lyophilization, dried type A samples were soaked in ultrapure water at room temperature for 30 minutes. Samples were frozen at −20°C and lyophilized again. At this point, they were ready for testing. Type B samples (Figure 1) were also made using the same chitosan and alginate mixing concentrations. Again, the first modifier CaCl2 was added. Dried type B samples were then soaked in the 2nd modifier 2% mass fraction chondroitin at room temperature for 30 minutes. The soaked samples were frozen at −20°C and lyophilized once again. Type C samples (Figure 1) were made by adding 2% mass fraction chondroitin as the first modifier at a volume ratio of 6:1 chitosan-alginate:chondroitin and 1% mass fraction CaCl2 as the 2nd modifier. For compressive testing, the dried samples were sliced into 12 mm thick dry cylinders. The diameter for each dry cylinder was approximately 20 mm. For tensile testing, the same sample-making procedure was used except samples were sliced into rectangular plates, 10 mm wide and 40 mm long and 2 to 3 mm thick. Finished samples were completely dry, solid materials. Figure 2 shows a representative image of the cylinder-shaped version of these freeze-dried samples.
Figure 1.
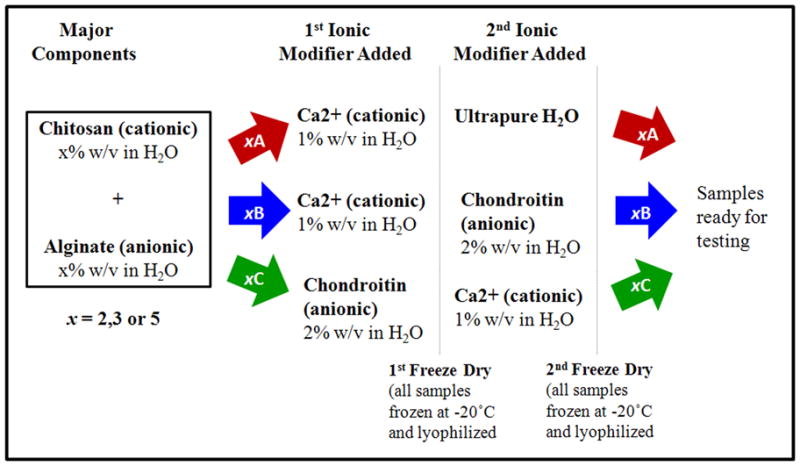
Procedures for making the three types of networks, A, B and C. Each network underwent lyophilization twice. x% chitosan was mixed with x% alginate in a 1:1 volume ratio. Type A & B samples were made by adding Ca2+ to the chitosan-alginate mixture at a volume ratio of 10:1 chitosan-alginate:CaCl2. Type A & B samples were lyophilized and then soaked in ultrapure H2O and a mass fraction of 2% chondroitin respectively. Type C samples were made by adding chondroitin to the chitosan-alginate mixture at a volume ratio of 6:1 chitosan-alginate:chondroitin. Type C samples were lyophilized and soaked in a mass fraction of 1% CaCl2.
Figure 2.
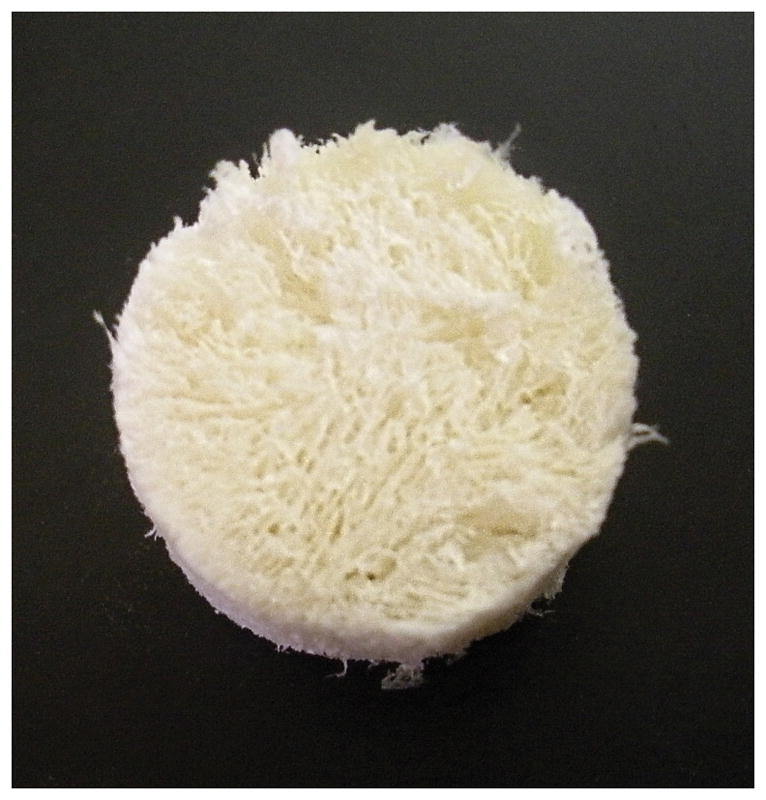
A representative image of the cylinder-shaped version of the freeze-dried samples.
Mechanical Testing
Mechanical strength of the freeze-dried networks was assessed using a Tensilon tensile-compressive tester (RTF-1310, Orientec, Japan) with a 50 N load cell. For compressive testing, the guidelines for mechanical testing from ASTM D5024-95a were used as described.11, 20 Briefly, the freeze-dried samples were hydrated to saturation and compressed to 30% of their original thicknesses with a constant crosshead speed of 0.4 mm/min. For tensile testing, rectangular freeze-dried networks were hydrated to saturation and elongated until rupture at a crosshead speed of 6.0 mm/min.21 Elastic moduli from compressive tests were calculated using the slopes of their respective stress-strain curves. In order to obtain the most realistic mechanical values, samples were tested in a hydrated state. However, the strongest sample (5C) was compressed in a dry state in order to compare with other reported chitosan-alginate strength values.11 Ultimate tensile strength was calculated by dividing the maximum load value by the material cross-section. The strongest sample (5C) was also put under tension in a dry state to determine the difference between dry and hydrated states. Five samples were used for each mechanical test. Mechanical testing results are presented as the average of five sample tests with the standard deviation reported as the error.
Scanning Electron Microscopy
10 × 10 mm pieces of each dried sample were examined using Scanning Electron Microscopy (SEM, Hitachi SU-70). Samples were placed on an SEM sample holder and coated with a thin layer of gold (≈30 nm) using a Sputter Coater (Anatech Hummer X). Average pore diameters of the networks were determined using the NIH image analysis program, ImageJ.22 Six images from each sample were taken for analysis of the entire sample surface. Every pore was measured in all images.
Material Porosity and Density
A liquid displacement method described by Zhang et al. was modified and used to determine the polysaccharide network porosity and density.20 Dried samples of dimensions 7 mm × 7 mm × 7 mm were weighed (W) and then placed in a known volume of liquid (V1). Air was evacuated from the samples followed by re-pressurization to insure maximum liquid saturation. The residual pressure here was close to 20 Torr. Air evacuation was done using a modified graduated cylinder, fitted with an attachment for vacuum pumping. The volume of the liquid including the saturated network (V2) was measured. The saturated network was then removed and the remaining liquid volume (V3) was measured. The original method used ethanol to determine porosity because it does not cause network swelling. However, we found ethanol evaporation to be a problem during air evacuation. Instead, heptane was used as the displacement liquid. Heptane did not have noticeable evaporation during air evacuation and did not affect network swelling. The density (ρ) and porosity (ε) of the networks were then calculated using the following equations.
| (1) |
| (2) |
Preparation of Networks for Small-Angle Neutron Scattering (SANS) Study
Chitosan, alginate, chondroitin and calcium chloride solutions were prepared in D2O to enable adequate contrast between the hydrogen-rich networks and the solvent. Solutions of mass fraction 2% chitosan were made in D2O containing a mass fraction of 2% HCl and solutions of mass fraction 2% alginate were made in D2O containing a mass fraction of 2% NH4OH. Solutions of a mass fraction of 1% chondroitin and 0.5% CaCl2 were each made in D2O. Five samples were prepared for measurement (Table 1). The calcium containing sample was made by mixing a mass fraction of 2% chitosan with a mass fraction of 2% alginate in equal volumes and then calcium was added at a volume ratio of 10:1 chitosan-alginate:CaCl2. The chondroitin containing sample was made using the same chitosan and alginate mixture and chondroitin was added at a volume ratio of 6:1 chitosan-alginate:chondroitin. Mixtures were prepared within titanium sample cells with 30 mm diameter quartz windows and a 2 mm path length. Samples were prepared within 12 hours of measurements. Of note, the samples for SANS experiments were not freeze-dried as opposed to the samples used for SEM, and mechanical, porosity and density studies. We have performed SANS experiments with polysaccharide networks in solution before they were freeze-dried in an attempt to get an insight on how the structural characteristics of the polysaccharide networks at the nanoscale level (or the level of individual fiber) are further translated into the bulk material properties. Due to dimensional hindrances of 1-mm quartz-titanium sample cell used in SANS studies, freeze-dried samples could not be loaded. We were also limited to lower concentrations of polysaccharides which contained only one modifier for each. High viscosity of concentrated solutions as well as the diffusion limitations for modifiers in the restricted environment of the sample cell hampered the extension of our experiments to wider concentration ranges and the addition of a second modifier. However, despite the above limitations, SANS studies can provide solid support for the results of bulk material testing and in some sense could serve as a basis for explanation of the observed material properties.
Table 1.
Structural data from SANS analysis. Correlation length (lc), mass-fractal (d), mass-fractal prefactor (B) and radius of gyration of the cross-section (Rc), were analyzed for chitosan/alginate samples. Each mixture was made with equal volumes of a mass fraction of 2% chitosan and a mass fraction of 2% alginate. The calcium-containing sample was made by adding Ca2+ to the chitosan/alginate mixture at a volume ratio of 10:1 chitosan-alginate:CaCl2 (0.25% CaCl2). The chondroitin-containing sample was made by adding chondroitin to the chitosan/alginate mixture at a volume ratio of 6:1 chitosan/alginate/chondroitin (0.5% chondroitin). The B for chitosan and alginate could not be calculated due to low scattering values.
| Samples | lc (Å) | d | B | Rc (Å) |
|---|---|---|---|---|
| 2% chitosan | 147 ± 8 | 3.0 ± 0.3 | - | 83 |
| 2% alginate | 245 ± 9 | 2.6 ± 0.3 | - | 88 |
| 2% chitosan+ 2% alginate | 134 ± 5 | 2.9 ± 0.2 | 4.6 × 10⁻⁴ | 109 |
| 2% chitosan + 2% alginate + 0.25% Ca2+ | 120 ± 5 | 2.8 ± 0.2 | 1.0 × 10⁻⁴ | 92 |
| 2% chitosan + 2% alginate + 0.5% chondroitin | 149 ± 8 | 3.0 ± 0.2 | 3.9 × 10⁻⁴ | 126 |
SANS Structural Analysis
Structures of the networks listed in Table 1 were investigated using the 30 m SANS instrument (NG-3)23 at the National Institute of Standards and Technology (NIST). Neutrons at λ = 6 Å with a wavelength spread (Δλ/λ) of 0.14 were detected on a 64 cm × 64 cm two-dimensional detector. Data on SANS intensity were collected with a Q-range from 0.001 Å−1 to 0.4 Å−1 at 25°C. Q is the scattering vector and is related to the wavelength λ and the scattering angle 2θ by
| (3) |
The instrument has pinhole geometry. Scattering intensities were normalized using direct beam transmission measurements and were reduced according to published protocols.24,25 Processing of the data taken at different scattering lengths was performed using the IGOR 6.2/IRENA software26 to obtain structural characteristics at the level of fiber building and packing. To estimate the mesh size of the cross-linking networks in the samples, the Debye-Bueche model27 was used in the following form
| (4) |
where lc is the correlation length. The correlation length of a network is a measure of the spatial extent of the cross-linking regions and reflects the average mesh size. A larger correlation length value correlates with a larger average mesh size.28
Mass fractal dimensions were found using the fractal model (Dr. A. Allen, NIST) implemented in IRENA and described in detail within the program. Fractal analysis is often used to analyze materials that have a repetitive unit which is appropriate for our polysaccharide-based systems (see Supplemental Information for the structures of chitosan, alginate and chondroitin). Fractal analysis is done in the Porod (or high-Q) region of the I(Q) vs. Q plot. This region corresponds to a range of distances smaller than the size of the scattering objects so that the scattered neutrons are probing the local structure of the repetitive unit. The fractal dimension (d) in mass-fractal analysis is a number ranging from 1 to 3 which characterizes the structure of the repetitive unit. For instance, a mass-fractal value of approximately 1.7 corresponds to a polymer in good solvent whereas a value of 2 or greater corresponds to a degree of branching.33 Scattering from a mass-fractal is given as
| (5) |
where d is the fractal dimension (obtained from the slope of the LogI(Q) vs. LogQ plot, see Supplemental Information) and B is the prefactor in the power law (5) is indicative of the dimensional characteristics of the mass fractal and/or its degree of swollenness.
Characteristics of individual fibers were acquired with the ATSAS software.29 The radius of gyration of the cross-section (Rc) was determined by calculating the pair distance distribution function of the fiber cross-section (Pc(r)) using indirect Fourier transform methods in GNOM. The radius of gyration of the cross-section describes the average distance of all area elements of the cross-section from the center of scattering density. The r value at Pc(r) = 0 gives the maximum linear dimension for the cross-section of the scattering particle, dmax. The radius of gyration of the cross-section of the scattering particle, Rc, is derived from the second moment of Pc(r).
| (6) |
| (7) |
Since the scattering intensity is directly proportional to the concentration (in mg/mL) and the molecular weight (in Da) of the constitutive molecules, to normalize pair-wise distribution functions of the cross-section, Pc(r), data for each polymer sample were divided by the sum:
| (8) |
where i is the number of polysaccharide components Ci is the concentration of corresponding component (in mg/mL) and M̄i is the average molecular weight of the i-th polysaccharide (in Da).
Statistical Analysis
Five experiments were performed per sample for each mechanical, porosity and density test. Six SEM images from each sample were taken for analysis of the average pore size over the entire sample surface. The Tukey-Kramer method was used to determine significant differences between the average pore sizes of different sample sets. One set of SANS data was obtained for structural analysis. SANS analysis was performed on single samples. A Student’s unpaired t test or analysis of variance (ANOVA) was carried out to determine the statistical significance (p < 0.05) of differences in material mechanical properties, porosity and density.
Results and Discussion
Mechanical Testing
Compressive Testing
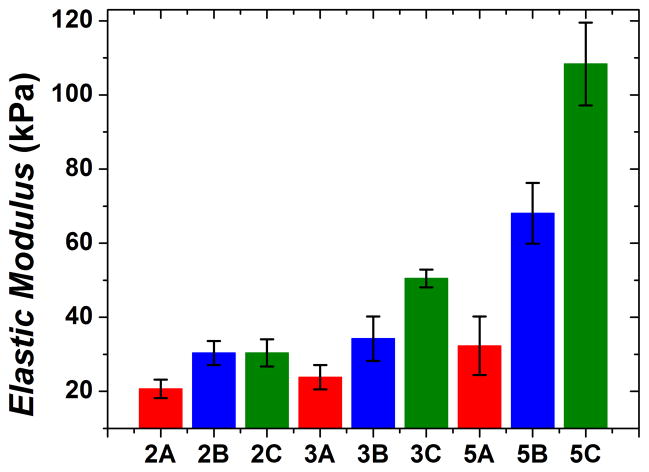
Shown in Figure 3, the elastic moduli for hydrated samples increased with increasing polysaccharide concentration. There was a statistically significant (p < 0.01) difference between type C elastic moduli at 5% concentrations compared with type C at 2 and 3% concentrations, demonstrating network stiffness is affected by polysaccharide concentration for type C networks. Type A and B networks also demonstrate a trend of elastic modulus increase with polysaccharide concentration increase. All type A moduli had statistically lower values than comparative type B and C samples (p < 0.01). The presence of chondroitin seemed to improve material stiffness since the type A samples did not contain chondroitin. Additionally, samples 3C and 5C had statistically higher elastic moduli (p < 0.01) compared with samples 3B and 5B. It appears the order of component addition only significantly affects the elastic moduli for the two higher concentration samples. This result may be due to incomplete penetration of chondroitin into the polymer network at higher polysaccharide concentrations if chondroitin is added as the 2nd modifier. The inability of chondroitin to diffuse freely may limit electrostatically-driven chondroitin-chitosan interactions, which could affect mechanical strength of the networks. Unlike chondroitin, Ca2+ may be able to overcome steric hindrance because of its much smaller size. Furthermore, it was reported that Ca2+ diffusion in higher concentrations of alginate likely increases the number of cross-linking events which improved mechanical strength of alginate hydrogels.30 For comparison with reported values, dry 5C samples were compressed as well, with an elastic modulus of 4.4 ± 0.52 MPa (Supplemental Information, Table 1), giving a significantly larger modulus than the largest previously obtained result (2.56 ± 0.41 MPa)11.
Figure 3.
Elastic modulus of each hydrated sample type. As total polysaccharide concentration increased, elastic modulus also increased. Samples are identified by mixing order (A, B or C) and by initial mass fractions of chitosan and alginate used (2%, 3% or 5%). Mechanical testing results are presented as the average of five sample tests with the standard deviation reported as the error. The error bars correspond to one standard deviation. Such applies to Figures 3, 6 and 7 as well.
Tensile Testing
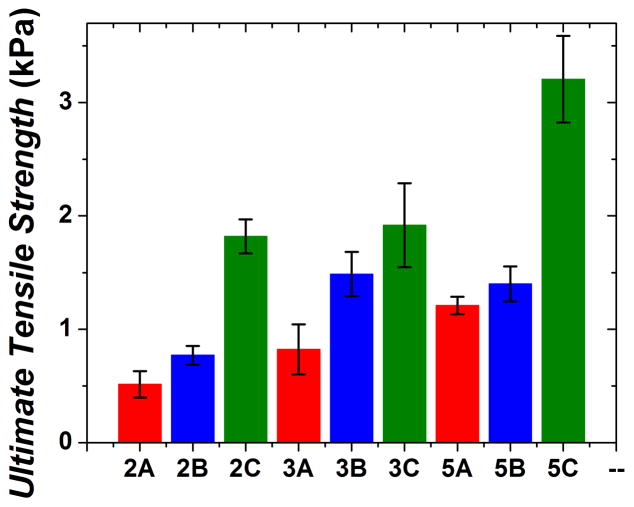
As polysaccharide concentration of hydrated samples increased, network tensile strength increased in general (Figure 4). Type C samples had the greatest ultimate tensile strengths, ranging from 1.8 kPa to 3.2 kPa while type A and B samples were significantly less (p < 0.01). Type B samples were either statistically similar or slightly stronger than type A samples in terms of tensile strength. Therefore, the addition order of the 2 modifiers is just as important for tensile strength as it is for the compressive strength of the networks. The ultimate tensile strength for dry 5C samples was 71.2± 4.6 kPa (Supplemental Information, Table 1) which is about 22 times larger than the hydrated tensile strength for 5C.
Figure 4.
Ultimate tensile strength of each hydrated sample type. Type C samples had statistically larger tensile strength values than type B samples possibly due to lack of chondroitin diffusion in type B samples.
In summary, mechanical testing shows that, as a modifier, chondoritin can indeed significantly strengthen chitosan/alginate networks, provided chondroitin is added before Ca2+, the other modifier.
Material Pore Size, Porosity and Density
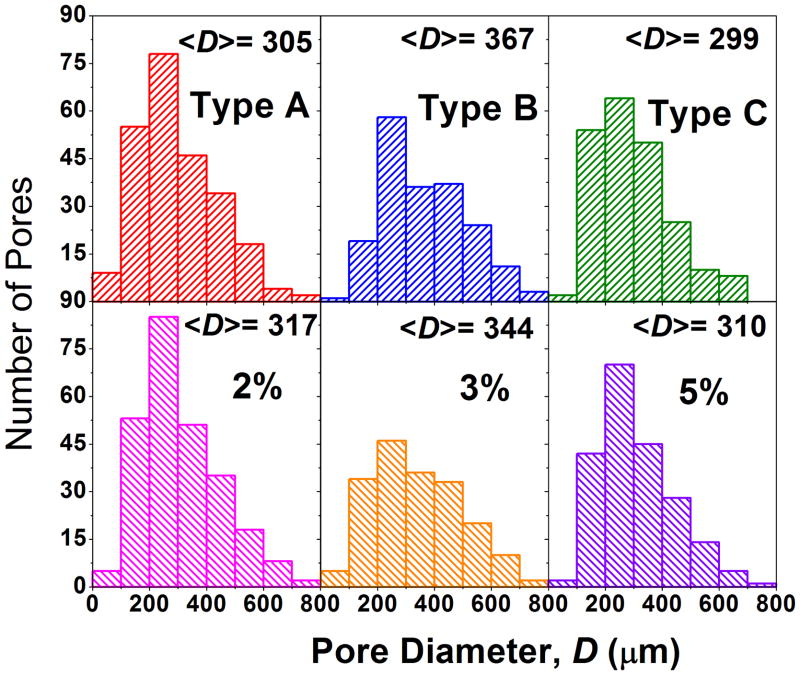
Highly porous and interconnected pore structures are needed to ensure an environment conducive to cell proliferation and attachment in addition to allowing the free flow of nutrients. SEM images (Figure 5) suggest material pore sizes are generally very heterogeneous. In Figure 6, the histograms also show pore size heterogeneity. To determine whether the average pore sizes for each sample type (A, B, C, 2, 3 and 5) were statistically significant from each other, the Tukey-Kramer method was used. At 95% simultaneous confidence levels, average pore size for sample type B was greater than A and C, and sample types A and C were statistically equivalent. Lack of chondroitin penetration may have induced the fusion of pores during the second freezing event, creating slightly larger pores in type B samples. At 95% simultaneous confidence levels, average pore size of sample type 3 was greater than 2 and 5, and sample types 2 and 5 were statistically equivalent. Larger pores in type 3 samples may have been due to the diffusion of polysaccharides prior to the first freezing. Type 5 samples contained more total polysaccharide content and diffusion may have been slow, resulting in slightly smaller pores. Conversely, type 2 sample polysaccharides could interact freely and form more complex networks consisting of slightly smaller pores. Chung et al. observed a similar heterogeneous pore population for chitosan-alginate networks frozen at −20°C.12 Regardless of the mechanism, the data show that there is an optimal polysaccharide concentration in terms of pore size.
Figure 5.
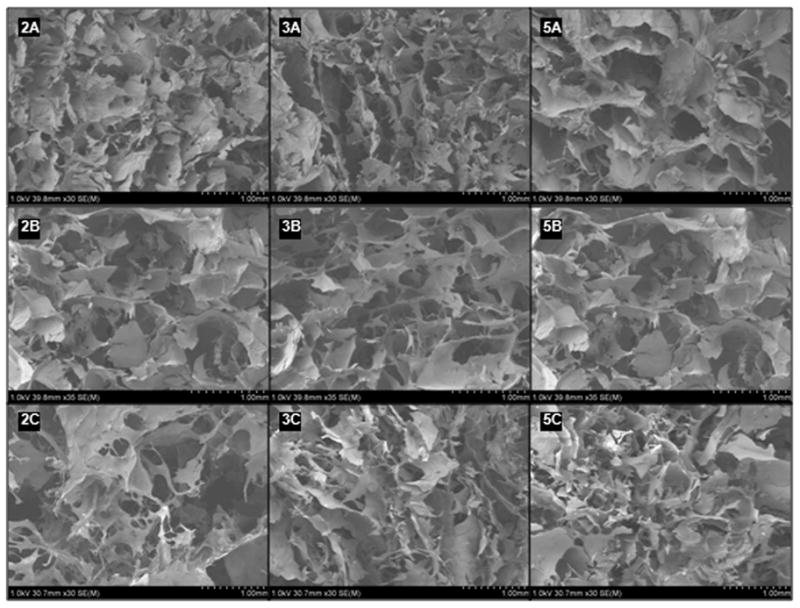
SEM images of the nine sample types. Accelerating potential 1.0 kV, 30.7 mm × 30 mm. Sample images depict the heterogeneous nature of the pores. Images are identified by mixing order (A, B or C) and by initial mass fractions of chitosan and alginate used (2%, 3% or 5%) for the purpose of this paper.
Figure 6.
Pore size distributions for each sample. Average pore diameter <D> is reported for each distribution.
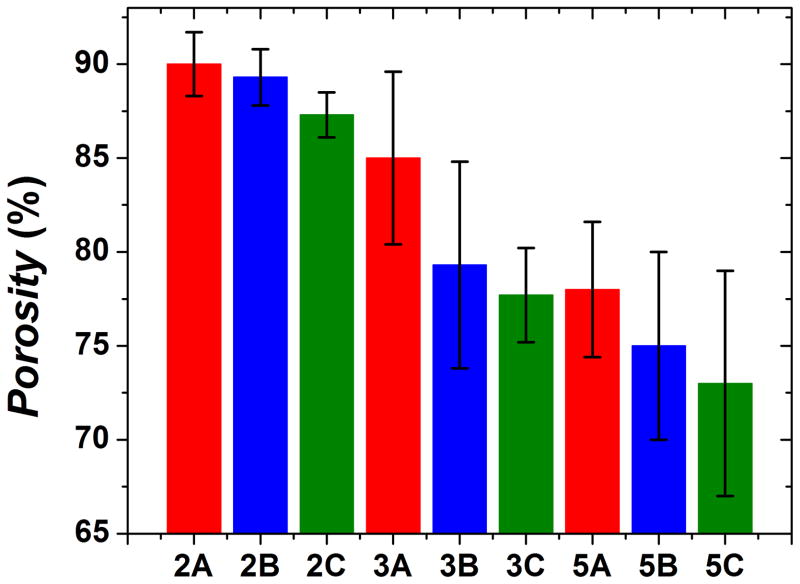
In general, increased material porosity (Figure 7) correlates with smaller starting concentrations of polysaccharide. Samples that were made with 2% polysaccharide have an average porosity about 15% higher than samples made with 5% polysaccharide. As for adding chondroitin as an additional modifier, the general trend is that it leads to a decrease in porosity as type B and type C samples are slightly less porous than type A samples. Type C samples were also slightly less porous than type B samples. More complete chondroitin incorporation in type B samples may be the reason for this effect. Porosities and pore sizes of these networks are similar to other chitosan-alginate networks.11, 12, 20, 31
Figure 7.
Average porosity of each sample. Decreased material porosity correlates with increased polysaccharide concentrations.
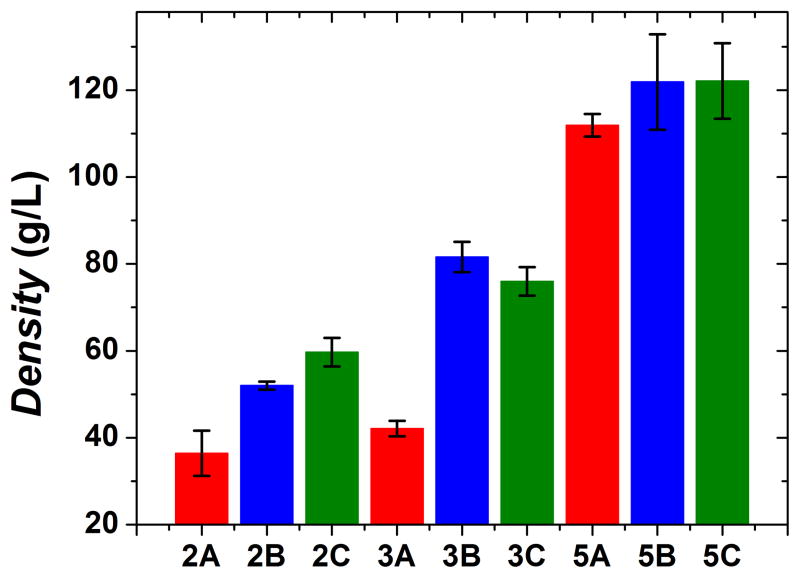
As expected, density shows the opposite trend of porosity as higher density correlates with larger starting concentrations of polysaccharide (Figure 8); samples that were made with 5% polysaccharide have an average density over two times larger than samples made with 2% polysaccharide. As for adding chondroitin as an additional modifier, the general trend is that it leads to an increase in density as type B and type C samples have higher densities than type A samples. However, the order of chondroitin addition does not seem to affect material density as type B and type C samples have statistically equivalent densities.
Figure 8.
Average density of each sample. Increased material density correlates with larger starting concentrations of polysaccharide.
To recapitulate, it seems that when chondroitin is added before Ca2+, it increases the mechanical strength and reduces the average pore size and porosity, in comparison to when Ca2+ is added before chondroitin. However, the addition order has no statistically significant effect on the density of the material.
SANS Structural Analysis
Analysis of the SANS data was performed in an effort to understand how the structural differences between polysaccharide networks in solution at the nanoscale level and at the level of individual fibers translate into the bulk material properties after freeze-drying. Different SANS parameters characterize different individual properties of the fibers or the networks, however, taken together they might form a consistent picture of structure-property relationships.
As a rule, the scattering intensity profile I(Q) vs Q characterizes the mass and/or volume of the scattering particle. The larger the mass and/or volume, the greater the intensity I(Q). In general, one might expect that networks comprised of higher scattering particles, upon freeze-drying, will produce mechanically stronger materials. Another dimensional parameter that describes the fiber cross-section is the radius of gyration of the cross-section Rc, which is obtained from pair-wise distance distribution function of the fiber cross-section Pc(r). A larger Rc characterizes a greater cross-section of the polysaccharide fiber, and thicker fibers are capable of forming stronger materials when freeze-dried.
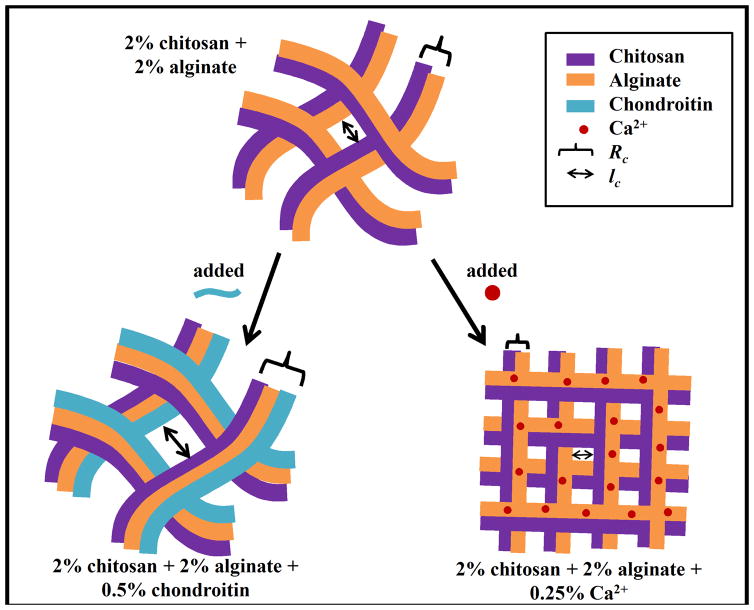
One of the important characteristics of the individual fiber is the mass-fractal dimension d which defines the structure of the repetitive unit (building “brick”) of the fiber. The packing and compactness of this repetitive unit is characterized by mass-fractal prefactor B, which reflects the degree of swollenness of the unit. Greater B values correspond to greater swollenness of the polysaccharide fiber building unit, and greater swollenness results in a weaker material after freeze-drying. Correlation length or mesh size lc defines the properties of the polysaccharide network, and smaller values of lc are usually attributable to stronger networks. An illustrative summary which compares the parameters examined in these networks can be seen in Figure 9. Also, a pictorial explanation of SANS parameters for the polysaccharide networks studied in the present paper is provided in the supplemental information, Figure S7.
Figure 9.
A physical depiction illustrating the network parameters obtained from SANS analysis.
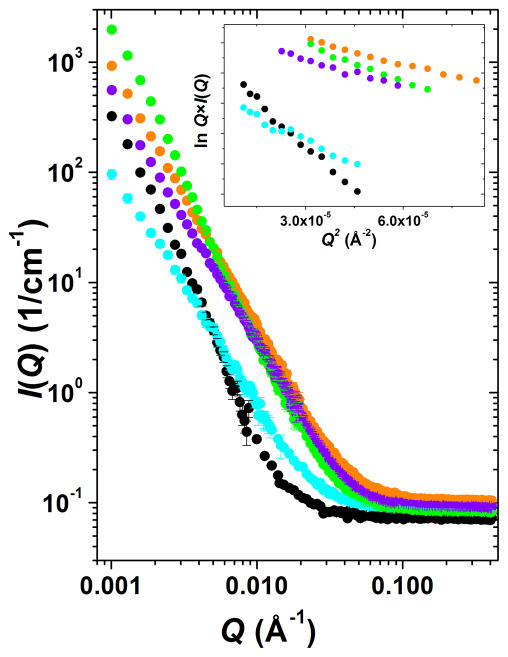
The measured scattering intensity (Figure 10) for each of the networks indicates greater scattering from mixed networks compared with pure alginate and pure chitosan samples. Increased scattering intensity describes the formation of aggregates and is consistent with the development of fibril networks, evidence that chitosan and alginate interactions have occurred. Of the three mixtures, the scattering intensity for the chitosan/alginate/Ca2+ mixture was the smallest and the chitosan/alginate/chondroitin mixture was the largest. This is consistent with the formation of much larger, stronger scattering assemblies in the presence of chondroitin which are capable to reinforce the resulting material after freeze-drying. Indeed, when freeze-dried, the scaffolds containing chondroitin demonstrate the greatest mechanical strength (Figures 3 & 4).
Figure 10.
I(Q) vs. Q SANS profiles for multi-component biopolymer networks: chitosan, cyan; alginate, black; chitosan + alginate, orange; chitosan + alginate + CaCl2, violet; chitosan + alginate + chondroitin, light green. Greater I(Q) values correspond to larger scattering particles, e.g., the (chitosan + alginate + chondroitin) mixture forms the biggest assemblies. Inset plot shows Guinier plots for rodlike particles, lnQ*I(Q) vs. Q2, and the linearity in this region confirms the formation of elongated fibers in all systems. Color code on inset corresponds to main figure. Statistical error bars correspond to one standard deviation and represent error in the scattering intensity estimation. Error bars are large at the instrument configuration overlap region but are smaller than the plotting symbols at low Q.
The correlation lengths (lc, Table 1) for the five samples showed that prior to mixing, the average mesh size for alginate was much larger; its correlation length was larger than the correlation lengths of chitosan and the three mixtures. The correlation lengths for chitosan and the chitosan-alginate mixture are quite similar. The average mesh size of alginate thus decreases during the mixing process which suggests the presence of chitosan-alginate interactions. Interestingly, the correlation length of the Ca2+-containing mixture was smaller than the other two mixtures. These results may occur due to alginate stiffening upon Ca2+ addition, which was known to shorten alginate chains. Stokke et al. also observed a similar shortening evident from the relationship between scattering intensity and Ca2+ concentration in pure alginate gels using small angle X-ray scattering (SAXS).32 Thus, due to such contraction of the alginate polymer, the addition of Ca2+ created a more densely-packed system (smaller correlation length). Smaller mesh-sized networks, in general, should be expected to produce stronger bulk materials after freeze-drying. Therefore, freeze-dried polysaccharide scaffolds modified with Ca2+ may demonstrate greater mechanical strength. The correlation length or average mesh size for the chondroitin-containing mixture was the greatest among the three mixtures. A larger correlation length for the chondroitin-containing mixture indicated that addition of chondroitin increased the average mesh size of the polysaccharide network. Mesh size increase may be due to increased fiber thickness upon chondroitin interaction with chitosan-alginate fibers as well as electrostatic repulsion of the negatively charged components. In a system where both these modifiers are added, one might expect chondroitin to increase the fiber thickness and Ca2+ to condense and stiffen those fibers into a stronger, compact system. When freeze-dried, this polysaccharide scaffold with two modifiers shows the highest mechanical strength (Figures 3 & 4).
Mass-fractal dimensions, d, which define the structure of the repetitive unit of the fiber for all five samples (Table 1) point to the formation of randomly-branched swollen polymers (d values from 2.6 to 3.0).33 Additionally, the power-law prefactor (B) from mass-fractal analysis reflects the dimensions and/or the degree of swollenness of the repetitive unit and is the smallest for the Ca2+-containing samples (Table 1). Contraction of alginate upon Ca2+ addition decreased the swollenness (B) and after freeze-drying this sample may demonstrate greater mechanical strength. The addition of chondroitin also reduced the B value slightly compared with the chitosan-alginate mixture. The decreased degree of swollenness is also in agreement with the results showing chondroitin addition directly translates to the strengthening of bulk mechanical properties on freeze-drying.
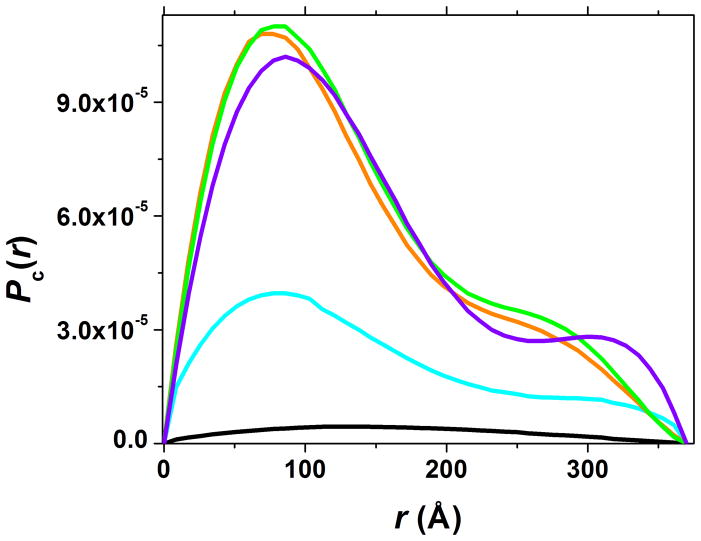
The radius of gyration of the cross-section (Rc), derived from the analysis of pair-wise distance distribution function of the cross-section (Pc(r)), can also be found in Table 1. Here, Rc is the contrast weighted average distance of all area elements of the cross-section from the center of scattering density and, in general, it characterizes maximum dimensions of the fiber cross-section. The Rc value for the chitosan-alginate network is larger than the Rc values of separate chitosan and alginate fibers suggesting that upon mixing, chitosan and alginate interact to form a thicker fiber, with a larger cross-section than either chitosan or alginate alone. After Ca2+ addition, the Rc value of the chitosan-alginate network becomes smaller, due to the contraction of alginate upon interaction with Ca2+. As mentioned above, such contraction simultaneously leads to a more compact and more dense network as evidenced by the decrease in mesh size lc and prefactor B (Table 1), thus suggesting a stronger bulk material upon freeze-drying. In contrast, after chondroitin addition, the Rc value for the chitosan-alginate network becomes larger due to the incorporation of chondroitin into the chitosan-alginate network and the thicker fiber that results. In Figure 11, the pair-wise distance distribution functions of the cross-section Pc(r) are plotted together. These functions reflect the probabilities of finding different distances between two arbitrary points within the cross-section, and the area under the curve characterizes the mass per unit length of the fiber. The pattern of Pc(r) for all three mixtures corresponds to an asymmetrical dumbbell shape of the cross-section, yet the shape is more pronounced in the Ca2+-containing mixture. Fiber contraction upon Ca2+ addition may be the reason for this change in shape. Once again, we see that addition of Ca2+ causes fiber contraction while chondroitin addition increases fiber thickness. Together, these modifiers can increase the fiber density and therefore increase the network bulk mechanical properties after freeze-drying.
Figure 11.
Pair-wise distance distribution functions, Pc(r), for the cross-section of the rod-like fibers of multi-component networks: chitosan, cyan; alginate, black; chitosan + alginate, orange; chitosan + alginate + CaCl2, violet; chitosan + alginate + chondroitin, light green. Functions with two maxima are characteristic for the dumbbell shape of the cross-section. Value of r in Å where Pc(r) goes to zero defines the maximum dimension of the cross-section which for all fibers is around 375 Å.
To summarize, increased scattering intensity describes the formation of aggregates and is consistent with the development of fibril networks, evidence that chitosan and alginate interactions have occurred. Additions of both modifiers individually change the structure of chitosan-alginate networks in different ways. Addition of Ca2+ causes the contraction of the network due to Ca2+-alginate interactions. This contraction increased the stiffness of the fibers. Addition of chondroitin causes an increase in fiber thickness due to chondroitin-chitosan-alginate interactions. Increased fiber thickness results in greater material density which in turn may increase material stiffness and strength.
Conclusions
Tissues such as cartilage, tendons or ligaments exist in mechanically demanding environments. In order to repair or replace these materials, it is desirable to mimic their mechanical strengths in engineered soft biomaterials. Creating the strongest materials possible requires an understanding of how individual network components and various conditions affect bulk material properties. In the present work, we examined how the addition of chondroitin affected the properties of chitosan-alginate networks. Samples containing chondroitin were stiffer and had greater tensile strengths than samples without chondroitin. However, the effectiveness of chondroitin addition was dependent on the order in which it was added. When added after the first lyophilization (type B samples), chondroitin could not diffuse into the networks. Therefore, type B samples were mechanically weaker than samples where chondroitin was added prior to the first lyophilization (type C samples). Effects of total polysaccharide concentration were also studied. Higher concentrations were associated with greater mechanical strengths. Porosity and density were notably concentration dependent. Pore size was affected by both concentration and order of chondroitin addition. Structural analysis of the networks complemented the findings in this paper. Correlation length, dimensional characteristics of the repetitive unit and radius of gyration of the cross-section illustrated that chondroitin addition increased fiber thickness while Ca2+ addition caused fiber contraction thereby increasing fiber stiffness. Together, the two modifiers improved network density, resulting in greater stiffness and tensile strength. This effort demonstrates the mechanical tunability and enhancement of these materials for various tissue engineering applications.
Supplementary Material
Acknowledgments
Financial support provided by the Maryland Technology Development Corporation (TEDCO) and the NIH (EB004416) is gratefully acknowledged. All SEM images were collected with resources and assistance from the Maryland Nanocenter. Thanks to Dr. W. Chiou and Dr. L. Lai for SEM sample preparation and image collection assistance; and Dr. W. Wang for helping with statistical analysis. The identification of commercial products does not imply endorsement by the National Institute of Standards and Technology nor does it imply that these are the best for the purpose. This work is based upon activities supported in part by the National Science Foundation under Agreement No. DMR-0944772.
Footnotes
Supporting Information: Chemical structures of chitosan, alginate and chondroitin. Elastic modulus for dry networks. IRENA estimations and fits for the polysaccharide SANS data. A pictorial description of the SANS parameters discussed in this paper.
References
- 1.Baruch L, Machluf M. Biopolymers. 2006;82:570–579. doi: 10.1002/bip.20509. [DOI] [PubMed] [Google Scholar]
- 2.Suh JK, Matthew HW. Biomaterials. 2000;21:2589–2598. doi: 10.1016/s0142-9612(00)00126-5. [DOI] [PubMed] [Google Scholar]
- 3.Howling GI, Dettmar PW, Goddard PA, Hampson FC, Dornish M, Wood EJ. Biomaterials. 2001;22:2959–2966. doi: 10.1016/s0142-9612(01)00042-4. [DOI] [PubMed] [Google Scholar]
- 4.Freier T, Koh HS, Kazazian K, Shoichet MS. Biomaterials. 2005;26:5872–5878. doi: 10.1016/j.biomaterials.2005.02.033. [DOI] [PubMed] [Google Scholar]
- 5.Hu Q, Li B, Wang M, Shen J. Biomaterials. 2004;25:779–785. doi: 10.1016/s0142-9612(03)00582-9. [DOI] [PubMed] [Google Scholar]
- 6.Shanmugasundaram N, Ravichandran P, Reddy PN, Ramamurty N, Pal S, Rao KP. Biomaterials. 2001;22:1943–1951. doi: 10.1016/s0142-9612(00)00220-9. [DOI] [PubMed] [Google Scholar]
- 7.Park DJ, Choi BH, Zhu SJ, Huh JY, Kim BY, Lee SH. J Cranio-Maxfac Surg. 2005;33:50–54. doi: 10.1016/j.jcms.2004.05.011. [DOI] [PubMed] [Google Scholar]
- 8.Wang L, Shelton RM, Cooper PR, Lawson M, Triffitt JT, Barralet JE. Biomaterials. 2003;24:3475–3481. doi: 10.1016/s0142-9612(03)00167-4. [DOI] [PubMed] [Google Scholar]
- 9.Vacanti CA, Langer R, Schloo B, Vacanti JP. Plast Reconstr Surg. 1991;88:753–758. doi: 10.1097/00006534-199111000-00001. [DOI] [PubMed] [Google Scholar]
- 10.Rees DA. Pure Appl Chem. 1981;53:1–14. [Google Scholar]
- 11.Li Z, Ramay H, Hauch KD, Xiao D, Zhang M. Biomaterials. 2005;26:3919–3928. doi: 10.1016/j.biomaterials.2004.09.062. [DOI] [PubMed] [Google Scholar]
- 12.Chung TW, Yang J, Akaike T, Cho KY, Nah JW, Kim SI, Cho CS. Biomaterials. 2002;23:2827–2834. doi: 10.1016/s0142-9612(01)00399-4. [DOI] [PubMed] [Google Scholar]
- 13.Lai HL, Abu’Khalil A, Craig DQM. Int J Pharm. 2003;251:175–181. doi: 10.1016/s0378-5173(02)00590-2. [DOI] [PubMed] [Google Scholar]
- 14.Mikos AG, Sarakinos G, Lyman MD, Ingber DE, Vacanti JP, Langer R. Biotech Bioeng. 1993;42:716–723. doi: 10.1002/bit.260420606. [DOI] [PubMed] [Google Scholar]
- 15.Mooney DJ, Kaufmann PM, Sano K, Mcnamara KM, Vacanti JP, Langer R. Transplant Proc. 1994;26:3425–3426. [PubMed] [Google Scholar]
- 16.Mooney DJ, Park S, Kaufmann PM, Sano K, Mcnamara K, Vacanti JP, Langer R. J Biomed Mater Res. 1995;29:959–966. doi: 10.1002/jbm.820290807. [DOI] [PubMed] [Google Scholar]
- 17.Sirko S, von Holst A, Wizenmann A, Gotz M, Fraissner A. Development. 2007;134:2727–2738. doi: 10.1242/dev.02871. [DOI] [PubMed] [Google Scholar]
- 18.Pieper JS, Oosterhof A, Dijkstra PJ, Veerkamp JH, van Kuppelvelt TH. Biomaterials. 1999;20:847–858. doi: 10.1016/s0142-9612(98)00240-3. [DOI] [PubMed] [Google Scholar]
- 19.Park YJ, Lee YM, Lee JY, Seol YJ, Chung CP, Lee SJ. J Contr Release. 2000;67:385–394. doi: 10.1016/s0168-3659(00)00232-7. [DOI] [PubMed] [Google Scholar]
- 20.Zhang Y, Zhang M. J Biomed Mater Res. 2001;55:304–312. doi: 10.1002/1097-4636(20010605)55:3<304::aid-jbm1018>3.0.co;2-j. [DOI] [PubMed] [Google Scholar]
- 21.Berger J, Reist M, Mayer J, Felt O, Peppas N, Gurny RJ. Pharm Biopharm. 2004;57:19–34. doi: 10.1016/s0939-6411(03)00161-9. [DOI] [PubMed] [Google Scholar]
- 22.Abramoff MD, Magelhaes PJ, Ram SJ. Biophotonics International. 2004;11:36–42. [Google Scholar]
- 23.Glinka CJ, Barker JG, Hammouda B, Krueger S, Moyer JJ, Orts WJ. J Appl Crystallogr. 1998;31:430–445. [Google Scholar]
- 24.Kline SR. J Appl Chrystallogr. 2006;39:895–900. [Google Scholar]
- 25.Whitten A, Trewhella J. Micro and Nano Technologies in Bioanalysis. Humana; 2009. Small-Angle Scattering and Neutron Contrast Variation; pp. 307–322. [DOI] [PubMed] [Google Scholar]
- 26.Ilavsky J, Jemian P. J Appl Crystallogr. 2009;42:347–353. [Google Scholar]
- 27.Debye P, Bueche AM. J Appl Phys. 1949;20:518–525. [Google Scholar]
- 28.Soni VK, Stein RS. Macromolecules. 1990;23:5257–5265. [Google Scholar]
- 29.Svergun DI. J Appl Cryst. 1992;25:495–503. [Google Scholar]
- 30.Kuo CK, Ma PX. J Biomed Mater Res. 2007;84A:899–907. doi: 10.1002/jbm.a.31375. [DOI] [PubMed] [Google Scholar]
- 31.Ho MH, Kuo PY, Hsieh HJ, Hsien TY, Hou LT, Lai JY, Wang DM. Biomaterials. 2004;25:129–138. doi: 10.1016/s0142-9612(03)00483-6. [DOI] [PubMed] [Google Scholar]
- 32.Stokke BT, Draget KI, Smidsrod O, Yuguchi Y, Urakawa H, Kajiwara K. Macromolecules. 2000;33:1853–1863. [Google Scholar]
- 33.de Gennes PG. Scaling Concepts in Polymer Physics. Cornell University Press; 1979. [Google Scholar]
Associated Data
This section collects any data citations, data availability statements, or supplementary materials included in this article.


