

Abstract
Although mitochondrial respiration is decreased in most cancer cells, the role of this decrease in carcinogenesis and cancer progression is still unclear. To better understand this phenomenon, instead of further inhibiting mitochondrial function, we induced mitochondrial biogenesis in transformed cells by activating the peroxisome proliferator‐activated receptors (PPARs)/peroxisome proliferator‐activated receptor gamma co‐activator 1α (PGC‐1α) pathways. This was achieved by treating the cells with bezafibrate, a PPARs panagonist that also enhances PGC‐1α expression. We confirmed that bezafibrate treatment led to increased mitochondrial proteins and enzyme functions. We found that cells with increased mitochondrial biogenesis had decreased growth rates in glucose‐containing medium. In addition, they became less invasive, which was directly linked to the reduced lactate levels. Surprisingly, even though bezafibrate‐treated cells had higher levels of mitochondrial markers, total respiration was not significantly altered. However, respiratory coupling, and ATP levels were. Our data show that by increasing the efficiency of the mitochondrial oxidative phosphorylation system, cancer progression is hampered by decreases in cell proliferation and invasiveness.
Keywords: Bezafibrate, Mitochondria, Tumorigenesis, PPAR, Invasion
Highlights
We increased mitochondrial biogenesis in cancer cells by treating them with a PPAR panagonist (bezafibrate).
The increased mitochondrial biogenesis led to reduced cell growth and reduced invasion.
This study provides evidence that elevated mitochondrial metabolism decreases cancer progression.
1. Introduction
Several lines of evidence support the concept that cancer can be considered a metabolic disorder. In 1920s, Otto Warburg found that cancer cells down‐regulate their oxidative phosphorylation (OXPHOS) machinery, producing energy predominantly from glycolysis, followed by lactic acid accumulation in the cytosol, irrespective of oxygen concentration in the environment (Warburg et al., 1926). It is now widely accepted that OXPHOS is decreased in most cancer cells (Formentini et al., 2010). This bioenergetic signature has been used in early cancer diagnosis and developed as a marker for tumor progression (Cuezva et al., 2002). Concomitantly, cancer cells have an elevated glycolytic metabolism as their main approach to obtain ATP. Recently, Vender Heiden et al. showed that fast‐proliferating cells also employed an alternative glycolytic pathway to support the anabolic metabolism (Vander Heiden et al., 2010). Changes in the nuclear DNA are likely the underlying cause of the OXPHOS deficiency in many cancers (Selak et al., 2005; Zhou et al., 2003); however, the common decrease in OXPHOS function in cancer cells has been associated, in some cases, with mutations in the mitochondrial DNA (mtDNA) (Chatterjee et al., 2006; Park et al., 2009).
The dependence on glycolysis and inefficient OXPHOS function allows for the production of large amounts of metabolic intermediates that serve as precursors for the biosynthesis of the three major classes of macromolecules (nucleic acids, lipids, and proteins) in fast‐proliferating tumor cells (Deberardinis et al., 2008). Despite this large body of evidence, the role of decreased OXPHOS in cancer progression is not well‐defined. Wallace and colleagues had reported mtDNA mutations that inhibited OXPHOS increased ROS production and facilitated tumorigenesis in prostate cancer, which also suggested potentially similar etiology of other solid tumors (Petros et al., 2005). Lopez‐Rios et al. further dissected the inverse correlation between bioenergetic capacity of mitochondria and the aerobic glycolytic flux in carcinomas (Lopez‐Rios et al., 2007).
Metastasis is usually associated with poor prognosis and accounts for over 90% cancer‐related deaths (Mehlen and Puisieux, 2006). Lactate acidosis resulted from high glycolytic flow reduces extracellular pH, which induces angiogenesis and facilitates cancer cell invasion (Gatenby et al., 2006; Gatenby and Gillies, 2004). Avadhani and colleagues found that cells with mtDNA depletion had increased invasiveness, which was associated with a mitochondria‐to‐nucleus signal that upregulated the expression of cathepsin‐L (Biswas et al., 2005). Van Waveren et al. found that mtDNA depletion also promoted invasion by altering expression of members of the matrix metalloproteinases (MMPs) and tissue inhibitors of the MMP (TIMP) family, as well as other invasion related genes (van Waveren et al., 2006). However, most cancer cells do not have a depletion of mtDNA, even though OXPHOS function is markedly reduced.
Most experimental paradigms exploring the role of OXPHOS in cancer were achieved by reduction of OXPHOS function, either through genetic or pharmacological manipulations, followed by phenotypic analysis of cancer cells behavior. Although an effective approach, cancer cells are already impaired in OXPHOS function, and thereby potentially adapted to a more glycolytic status. Therefore, we decided to take the opposite approach, in which instead of inhibiting, we boosted OXPHOS function in cancer cells (143B, HeLa, and MDA‐MB‐231) and analyzed changes in their phenotypes. To do so, we took advantage of others and our recent experience with PPARs agonists that were able to increase OXPHOS components and function (Bonnefont et al., 2009, 2008, [Link]). We found that cells with increased mitochondrial biogenesis had decreased glycolytic growth. In addition, they became less invasive due to reduction in lactate production. Furthermore, even though bezafibrate‐treated cells had higher mitochondrial load, total respiration was not significantly affected, while respiratory coupling, mitochondrial membrane potential and hence ATP levels were increased. Our study provides independent support for the concept that robust OXPHOS inhibits cancer progression.
2. Material and methods
2.1. Cell lines
Three human cancer cell lines including HeLa (cervical carcinoma), 143B (osteosarcoma), and MDA‐MB‐231(breast cancer) were used in this study. Cells were grown in high glucose Dulbecco's modified Eagle's medium (DMEM, Gibco Cat.# 11965) supplemented with 1 mM pyruvate, 50 μg/ml uridine, 10% fetal bovine serum (FBS), and 0.2% gentamycin. Bezafibrate, dissolved in DMSO, was supplemented at a concentration of 400 μM. Controls were supplemented with the equal volume of DMSO (vehicle). Cells were grown for 3 days in the supplemented media.
2.2. Western blotting
Total protein was prepared from cultured cells and quantified using Bradford method. Equal amount of proteins were loaded either on a 10%, 12%, or 4%∼20% gradient SDS‐PAGE gel. After electrophoresis, the proteins were transferred onto nitrocellulose membrane (BioRad) and blotted with antibodies against mitochondrial or nuclear proteins. The primary antibodies used were against Total OXPHOS Antibody Cocktail (MitoSciences Cat.# MS604), Tim23 (BD Biosciences Cat.# 611222), Human‐TFAM (Novus Biologicals Cat.# NB600‐1462), LC 3B (Cell Signaling Cat.# 2775), Tubulin (Sigma, Cat.# T‐9026).
2.3. Quantitative real‐time PCR experiments
Total DNA was extracted from cultured cells using Necleon™ BACC2 Genomic DNA Extraction Kit (GE Healthcare). Quantitative real‐time PCR experiments were performed in the presence of fluorescent dye (SYBR Green, Fermantas) with 7300 Real‐Time PCR System (Applied Biosystems). MtDNA copy numbers were normalized against genomic DNA level of β‐Actin. All results were obtained from 3 batches of cultured cells, and are expressed as means ± SEM. Primers used: mtDNA forward primer: 5′‐TCACCCTATTAACCACTCA, mtDNA reverse primer: 5′‐AGACAGATACTGCGACATA, gDNA forward primer for β‐Actin: 5′‐TCACCCACACTGTGCCCATCTACGA, gDNA reverse primer for β‐Actin: 5′‐CAGCGGAACCGCTCATTGCCAATGG. Human‐PPARGC1A: (Qiagen, #QT00095578). cDNA forward primer β‐Actin: 5′‐TGACAGGATGCAGAAGGAGAT, cDNA reverse primer β‐Actin: 5′‐GCGCTCAGGAGGAGCAAT.
2.4. Growth curve
Cells were counted and re‐plated in 24‐well plates at 5×10^3∼10^4 cells/well. For growth curve in galactose medium, cells were plated in regular glucose medium and changed to galactose medium (No glucose DMEM medium (Gibco Cat.# 11966) supplemented with 25 mM l‐galactose, 1 mM pyruvate, 50 μg/ml uridine, 10% dialyzed FBS, and 0.2% gentamycin.). Cells were counted in triplicate using a Beckman Coulter Z1 Dual Cell and Particle Counter (Beckman Coulter, Inc., Brea, CA) and medium containing DMSO or bezafibrate were changed every day for up to 7 days.
2.5. Measurement of glucose consumption and lactic acid production
Controls and cells treated with bezafibrate were plated in 1 ml low glucose medium in 24‐well plates at 105 cells/well. The concentrations of glucose and lactate in the medium were measured after 24 h with an YSI 2300 TSAT Plus Glucose & Lactate Analyzer (YSI Life Sciences, Yellow Springs, OH). Cells were counted and both glucose consumption and lactic acid production were normalized according to the cell number in each well.
2.6. Invasion assay
Cell invasion assay was performed using a QCM ECMatrix Cell Invasion kit (Millipore, Cat.# ECM555). Serum‐free medium in the lower chamber was used as negative controls. In an additional set of wells, 25 mM HEPES was supplemented in the medium to stabilize pH. Invaded cells were quantified according to the manufacturer's instructions in quadruplicate.
2.7. Gelatin zymogram
Cells treated with bezafibrate or DMSO for 3 days were grown to confluence then washed thoroughly and switched to serum‐free medium that just covered the flask. After 24 h, the conditioned medium was collected. Equal volume was mixed with 2× sample buffer (125 mM Tris HCl, 20% Glycerol, 4% SDS, 0.005% Bromophenol Blue, pH 6.8) and loaded onto Novex 10% Zymogram (Gelatin) Gel (Invitrogen, Cat.# EC61755BOX). Run the gel in 4 °C at 125 V for 90 min, develop and stain the gel according to manufacturer's instructions.
2.8. Measurement of mitochondrial enzyme activities
Mitochondrial enzyme complex activities were measured spectrophotometrically in cell homogenates using a DU‐640 spectrophotometer (Beckman Instruments Inc., Fullerton, CA) as described elsewhere (Barrientos et al., 1998). The activity of citrate synthase was determined by following the formation of DTNB‐CoA, which is coupled with citrate formation catalyzed by citrated synthase (CS), at 412 nm. The activity of Complex IV (COX) was determined by following cytochrome c oxidation at 550 nm (Barrientos et al., 1998). Assays were performed at 30 °C for CS and at 37 °C for COX.
2.9. Measurement of CPT activity
Total CPT activity was measured using Carnitine hydrochloride, l‐[N‐Methyl‐14C] as substrate. Briefly, 50 μl cell homogenate was mixed with 200 μl reaction mixture (75 mM Tris, 1.5 mM CoA, 0.625 mM DTT, 0.25 mM Palmityl‐carnitine, and 3.2 mM L∗Carnitine) and incubated at 37 °C. The reaction was stopped by adding 1 ml 1 M HCl and 1 ml 1‐Butanol to the mixture, at 0 min, 5 min, and 10 min. The radioactivity was measured in 250 μl of the organic phase using a scintillation counter and used to calculate the rate of L∗Carnitine incorporation into Palmityl‐L∗carnitine, which was normalized against protein concentration and corresponded to the total CPT activity of the sample.
2.10. Measurement of cellular ATP
Intracellular ATP levels were measured with the CellTiter‐Glo Luminescent Cell Viability Assay kit (Promega, Cat.#G7571) according to manufacturer's instructions. Briefly, cells were plated in 96‐well plate in sextuple and cultured for 24 h to reach 80%∼90% confluence. Cells were lysed in the same plate with the reagent included in the assay kit for 15 min at room temperature with gentle agitation. The mixture was transferred to an opaque‐walled 96‐well plate, and luminescence produced from ATP‐mediated chemical reaction was recorded by the luminescence module of the Wallac Victor2 1420 multilabel counter (PerkinElmer Life Sciences). Readouts were normalized to total protein in each well. The result showed was the average of sextuple samples ± SD from one representative experiment out of at least three independent analyses.
2.11. TMRE flow cytometry
For flow analyses 105 cells were aliquoted and washed once with modified Ringer's buffer (127 mM NaCl, 5.5 mM KCl, 2 mM MgSO4, 2 mM CaCl2, 0.5 mM KH2PO4, 20 mM HEPES, 10 mM Glucose, 1% FBS, pH 7.4). The cell pellet was resuspended in 1 ml of 75 nM TMRE dye diluted in modified Ringer's buffer and incubated for 20 min at 37 °C in the dark. The staining medium was aspirated after a 5 min centrifugation at 600 g and the pellet was resuspended in 0.5 ml of 7.5 nM TMRE dye diluted in modified Ringer's buffer for equilibration. In a duplicate group, 2 μM of CCCP was also added to the final reaction. Samples were immediately analyzed at Absorbance/Emmisions = 549/573 nm on LSR Fortessa (BD Biosciences). The result showed was the relative CCCP‐sensitive (endogenous minus CCCP‐resistant) TMRE fluorescence.
2.12. Amplex® red assay
Celluar hydrogen peroxide concentration was measured using Amplex® Red Hydrogen Peroxide/Peroxidase Assay Kit from Invitrogen (Cat.# A22188). Briefly, in a 96‐well plate, 20 μl of ∼1.5 × 10⁴ control or bezafibrate‐treated cells were added to 100 μl of Krebs–Ringer phosphate buffer (145 mM NaCl, 5.7 mM sodium phosphate, 4.86 mM KCl, 0.54 mM CaCl2, 1.22 mM MgSO4, 5.5 mM glucose, pH 7.35) containing 50 μM Amplex® Red reagent and 0.1 U/mL HRP. The fluorescence was followed at Absorbance/Emissions = 535/590 nm for 1 h on BioTek Synergy H1 Hybrid Reader.
2.13. Measurement of cell respiration with Seahorse flux analyzer
Cells in exponential growing phase were plated in 96‐well cell culture plate supplied in XF96 FluxPaks (Seahorse Bioscience Inc.) and cultured overnight to reach ∼90% confluence. Oxygen consumption rate (OCR) was measured with a Seahorse XF96 analyzer according to manufacturer's instructions. After the measurement, cell numbers in each well of the culture plate were quantified using the Sulforhodamine B method described elsewhere (Vichai and Kirtikara, 2006). OCR was then normalized against cell number in each well. Result showed was one representative from at least three independent experiments.
2.14. Measurement of cell respiration with Oroboros
Cells in exponential growing phase were collected and respiration rate of intact cells was measured at 37 °C with Oroboros high resolution respirometer Oxygraph‐2k (Oroboros Instruments GmbH, Austria). Besides the endogenous respiration, oligomycin‐resistent respiration in the presence of 15 nM oligomycin and uncoupled respiration with 1 μM CCCP were also recorded. Data was analyzed with DatLab 4 software (Oroboros Instruments, Austria).
2.15. Statistics
Data were analyzed using a two‐tailed, unpaired Student t test. Differences were considered significant when p < 0.05 (∗), 0.001 < p < 0.01 (∗∗), p < 0.001(∗∗∗).
3. Results
3.1. Increasing mitochondrial biogenesis in cancer cells
Mitochondrial proliferation and thus an increase in oxidative phosphorylation (OXPHOS) components has been induced via administration of bezafibrate, a PPAR panagonist that also stimulates PGC‐1α expression, both in vitro and in vivo (Bastin et al., 2008, 2008, [Link]). It was reported that for fibroblasts, 400 μM bezafibrate promoted the highest increase in OXPHOS enzyme activities in 72 h without being toxic to cells (Bastin et al., 2008). Therefore, we used a standard 400 μM bezafibrate dose in the experiments described below. Control cells were treated with the same volume of the vehicle (DMSO) only. We confirmed the increased expression of PGC‐1α upon bezafibrate treatment (Figure 1A) as well as an increase in OXPHOS markers (Figure 1B). Treatment with bezafibrate did not have a noticeable effect on the morphology or the distribution of mitochondria in the cell (Figure 1C and data not shown). In addition to OXPHOS components, the levels of Tim23 and TFAM, two mitochondrial markers of inner membrane and matrix respectively, were increased in all the cell lines (Figure 1D). Accordingly, the levels of mtDNA, measured as ratios to the nuclear DNA, were also increased in the cancer cell lines (Figure 1E).
Figure 1.
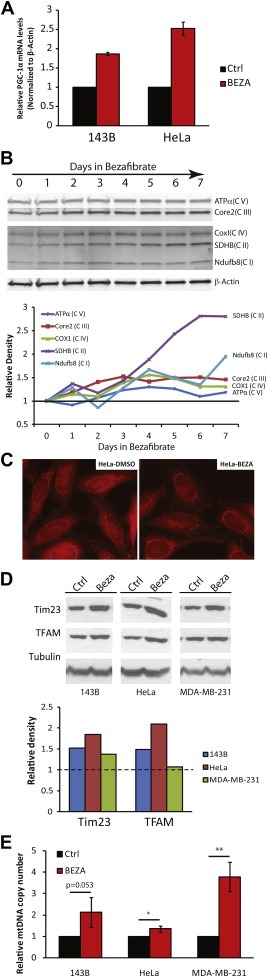
Bezafibrate induces PGC‐1α and OXPHOS components in cultured cells. A, Real‐time PCR determination of PGC‐1α transcript levels from cDNAs from 143B and HeLa cells. B, Western blot showing the steady‐state levels of OXPHOS components over a 7‐day treatment period of HeLa cells with bezafibrate (400 nM). C, Fluorescent microscopy of HeLa cells treated with 400 μM of bezafibrate of DMSO for 3 days and stained with MitoTracker Red for 20 min, showing the morphology and distribution of the mitochondrial network. D, Western blotting of total cell homogenate from 143B, HeLa and MDA‐MB‐231 cells, with antibodies against Tim23 and human‐TFAM, showing the increase of mitochondrial markers. Antibody against Tubulin was used as a loading control. E, Relative levels of mtDNA copy numbers in cancer cell lines. The expression of genomic gene β‐Actin was used as a reference (n = 3 and bars represent SD).
The activities of mitochondrial enzymes were also increased after bezafibrate treatment. We measured the activities of a Krebs cycle enzyme (citrate synthase, CS), fat acid catabolism (carnitine palmitoyl transferases, CPT‐I and CPT‐II) and oxidative phosphorylation (cytochrome oxidase, COX), all of which were significantly increased in bezafibrate‐treated cells (Figure 2A–C).
Figure 2.
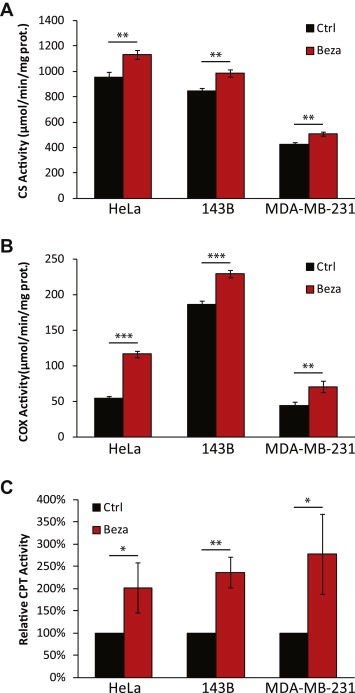
Bezafibrate improves oxidative phosphorylation in cultured cells. A and B, Citrate synthase (CS) and Cytochrome c oxidase (COX) activity in bezafibrate‐ and DSMO‐treated cells (n = 3 and bars represent SD). C, carnitine palmitoyl transferase activity in bezafibrate‐ and DMSO‐treated cells (n = 3 and bars represent SD).
3.2. Bezafibrate increases ATP levels and mitochondrial coupling
Based on the above evidence showing that bezafibrate upregulated OXPHOS components in cancer cells, we then investigated the energy status of the cells. We found that bezafibrate‐treated cells had higher ATP levels (Figure 3A). However, despite the increase in mitochondrial components and ATP levels we found that bezafibrate treatment did not affect total cell respiration, measured as oxygen consumption in a Seahorse XF96 analyzer and an Oroboros O‐2k high resolution respirometer (Figure 3B and data not shown). This apparent discrepancy was clarified by measuring CCCP‐uncoupled respiration in Oroboros O‐2k, which showed that mitochondria from bezafibrate‐treated cells were better coupled than in control cells (Figure 3C). In other words, even with the same level of electron transport and oxygen consumption, a stronger proton electrochemical gradient could be generated, more efficiently driving ATP synthesis through complex V. To confirm a critical prediction of this hypothesis we also measured the mitochondrial membrane potential (ΔΨm) in these cells by the uptake and retention of TMRE using FACS analysis. In agreement with the tighter coupling hypothesis, bezafibrate‐treated HeLa cells showed a significant increase in CCCP‐sensitive ΔΨm, while there was also a trend for increases in 143B and MDA‐MB‐231 cells (Figure 3D). Although the relationship between ΔΨm and levels of ROS is controversial (MacLellan et al., 2005), we found a decrease in the rate of H2O2 in bezafibrate‐treated cells, as determined by Amplex Red (Figure 3E).
Figure 3.
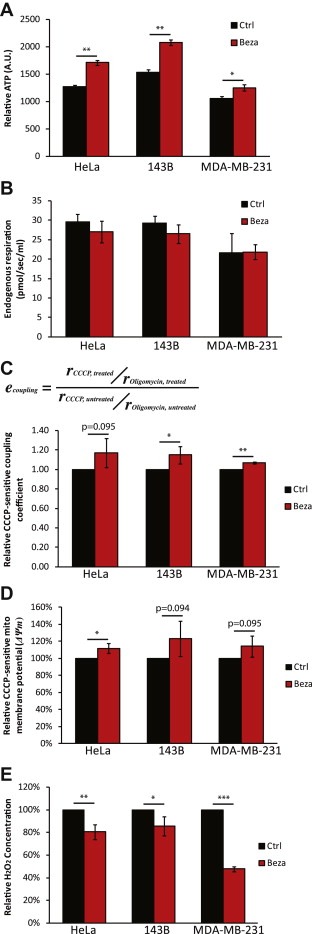
Bezafibrate treatment increases cellular ATP levels by enhancing respiration coupling. A, Cellular ATP levels of bezafibrate‐ and DMSO‐treated cells (n = 6 and bars represent SD). B, Endogenous respiration in different cell lines measured with Oroboros 2k respirometer (n = 3 and bars represent SD). C, The ‘coupling coefficient’ was calculated as the ratio of CCCP‐uncoupled respiration rate over oligomycin‐insensitive respiration rate. The coefficient in each DMSO‐treated cell line was used as a reference (n ≥ 3 and bars represent SD). D, Relative mitochondrial membrane potential (ΔΨm) in different cell lines measured by TMRE staining using FACS. The ΔΨm of each DMSO‐treated cell line was used as a reference for that of bezafibrate‐treated cells. The data are expressed as CCCP‐sensitive signal (n = 3 and bars represent SD).
3.3. Increased mitochondrial biogenesis reduces cell growth in glucose media
We next investigated how this shift toward oxidative metabolism influenced cell growth. Cells were grown in either glucose medium or in galactose medium. Galactose is metabolized very slowly through glycolysis and generates much less ATP compared to glucose, thus requiring a more robust OXPHOS and in general does not support pure glycolytic growth (Marroquin et al., 2007; Robinson et al., 1992). In our hands, 143B and HeLa cells did not survive for a long period of time in galactose medium most likely because they primarily rely on glycolysis. However, cells with increased mitochondrial metabolism were able to survive longer in medium containing galactose as the carbon source (Figure 4A,C). MDA‐MB‐231 cells were able to grow very slowly in galactose medium, and still, bezafibrate‐treated cells tended to grow better than control cells over time (Figure 4E). On the other hand, all bezafibrate‐treated cells grew significantly slower in rich glucose medium (Figure 4B, D, F). These experiments were repeated in high and low glucose media and consistently, bezafibrate‐treated cells had reduced growth rates when compared to control‐treated cells (not shown). These results further confirm that bezafibrate treatment has induced transitions in cancer cells' metabolic patterns and demonstrate that this metabolic change influences the cell growth phenotype.
Figure 4.
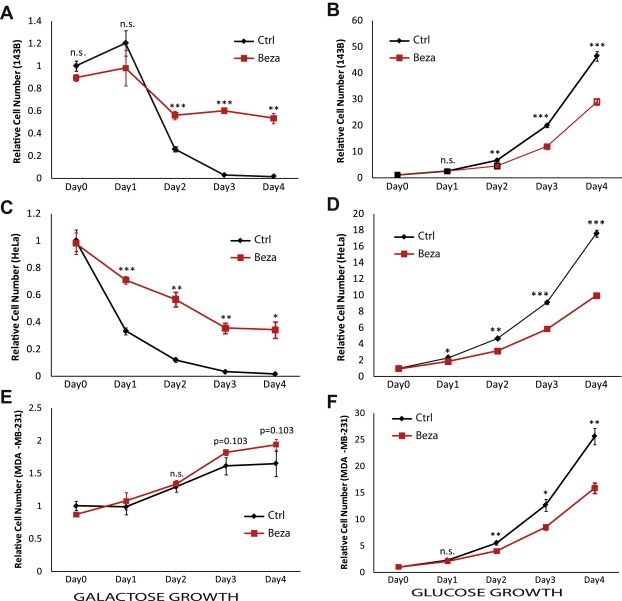
Ratios of cell growth in high glucose medium and galactose medium. Growth of A, 143B, B, HeLa, and C, MDA‐MB‐231 cells in high glucose and galactose medium. Data is expressed as the ratio of the number of bezafibrate‐treated cells over DMSO‐treated cells. Glucose relative growth scale is on the left y axis and galactose relative growth scale is on the right y axis.
3.4. Reduced glucose utilization increases extracellular pH and decreases invasion
The reduction in glycolytic growth indicated a shift in the metabolic status of cells treated with bezafibrate. The increased glucose utilization, a feature of cancer cells metabolism and the basis of the Warburg effect (Warburg et al., 1927), was reduced in bezafibrate‐treated cells (Figure 5A). Accordingly, these cells also showed a reduction in lactate secretion (the end product of glycolysis) (Figure 5B). When cells were analyzed for their invasive phenotype in an extracellular matrix (ECM) assay we observed a significant decrease in invasiveness in the bezafibrate‐treated cells (Figure 5C). However, this decrease in the invasion phenotype was not associated with decreased levels of active MMP‐2 or MMP‐9 (Figure 5D). To investigate the role of pH in the invasion phenotype, we supplemented the assay medium with 25 mM HEPES at pH 7.4 to stabilize the pH during the assay. HEPES buffered the medium, which led to a marked decreased invasion of cells through the ECM. This effect of the neutral pH was blunted in bezafibrate‐treated cells, which produced less lactate (Figure 5C).
Figure 5.
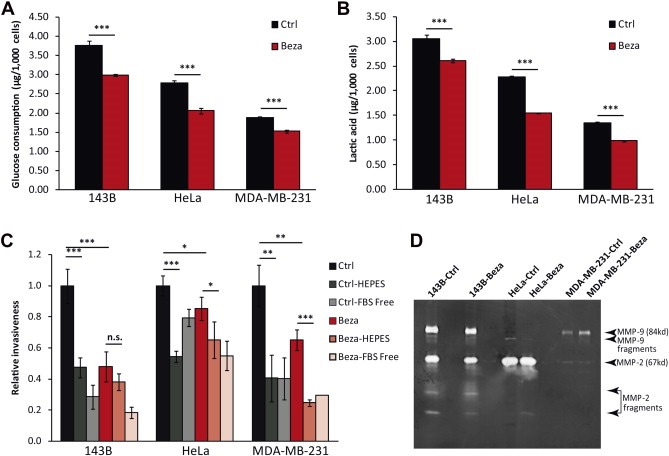
Bezafibrate treatment decreases glycolytic flux and cell invasion. A, Glucose consumption of bezafibrate‐ and DMSO‐treated cells in 24 h (n = 6 and bars represent SD). B, Lactate concentration in medium of bezafibrate‐ and DMSO‐treated cells in 24 h (n = 6 and bars represent SD). C, Relative invasiveness of cancer cell lines. Cells were incubated in medium containing DMSO or bezafibrate, with or without 25 mM HEPES for 12 h. Wells with serum‐free medium in the lower chamber were used as negative controls. Results were normalized against control cells in each cell line (n = 4 and bars represent SD). D, Gelatin zymogram with conditioned medium collected from different cancer cell lines. Arrows indicate the sizes of MMP‐2, MMP‐9 and fragments according to their molecular weights.
3.5. Increased mitochondrial biogenesis does not have major effects on apoptosis or autophagy
We also investigated the effect of a metabolic shift in apoptosis induced by either staurosporin or TNFα in HeLa, 143B and MDA‐MB‐231 cells. We did not find a significant difference between treated and control cells, although there was a trend for the bezafibrate‐treated cells to be more sensitive to stimuli inducing apoptosis (Supplementary Figure S1 and data not shown).
As resistance to apoptosis is important for transformed cells to survive nutrient and oxygen depletion at early stages of tumorigenesis, enhanced autophagy is also essential to maintain cell self‐turnover, restrict necrosis and inflammation. Therefore, we analyzed the influence of increased OXPHOS on autophagy. For glucose‐starvation‐induced autophagy, we observed lower levels of the macroautophagy marker LC3B‐II in bezafibrate‐treated cells (Supplementary Figure S2). This is probably because these cells consume glucose slower than control cells, and thus sense less stress due to glucose deprivation. However, we were not able to find a consistent change of LC3B‐II levels in treated cells when they underwent serum‐starvation‐induced autophagy (Supplementary Figure S2). In summary, we did not find major effects of bezafibrate on apoptosis or autophagy.
4. Discussion
The metabolic shift in cancer cells has received much attention in the last decade. Extensive investigations have tried to tether genomic changes to metabolic phenotypes as well as target metabolism for cancer therapy. We reported here that activation of oxidative phosphorylation function in cancer cells impair carcinogenesis at multiple levels. With increased mitochondrial load, we found decreases in glycolytic flux and reduced growth of cancer cells. We also found decreased invasion which was directly associated with a reduction in extracellular acidosis (Figure 6). Bezafibrate treatment did increase cellular ATP levels, as well as respiratory coupling and CCCP‐sensitive mitochondrial membrane potential (ΔΨm), but it is not clear how or if these changes contribute to tumorigenesis and cancer progression (Figure 6). Increased ΔΨm has been associated with increased ROS production (Samudio et al., 2009). However, we found that the rate of H2O2 production was actually reduced in bezafibrate‐treated cells. We do not know the reason for this decrease, but PGC‐1α is also known to increase antioxidant defenses (St‐Pierre et al., 2006). It is difficult to predict whether this decrease would have a negative role in tumorigenesis, but ROS has been described as a signaling molecule promoting growth (Rigoulet et al., 2011). D'Errico and colleagues reported that overexpression of PGC‐1α in intestinal cells was associated with decreased tumorigenesis (D'Errico et al., 2011), which is in agreement with our findings. However, they found an increase in ROS, which contrasts with our and other models (St‐Pierre et al., 2006). Therefore, it is possible that increased mitochondrial biogenesis may have model/cell‐specific effects on ROS production.
Figure 6.
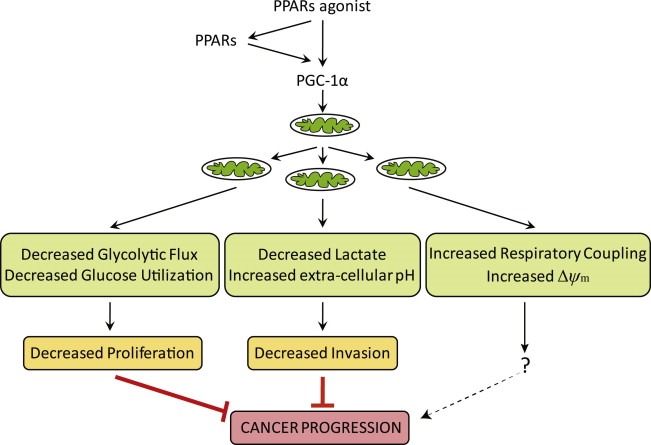
Model describing the effect of bezafibrate treatment on carcinogenesis. This model summarizes our data, showing how PPARs agonists act through the PPARs/PGC‐1α pathway to impair carcinogenesis.
Our lab has previously showed that low mitochondrial membrane potential (ΔΨm) and lack of OXPHOS decreased the susceptibility of osteosarcoma cells to apoptosis triggered by certain inducers (e.g. staurosporin) (Dey and Moraes, 2000). Other work also suggested a close and direct relationship between decrease in ΔΨm and induction of autophagy (Li et al., 2007; Paglin et al., 2005; Zhang et al., 2009). Surprisingly, the increased ΔΨm resulting from bezafibrate treatment did not show major changes in caspase‐dependent cancer cell death induced by staurosporin or TNFα or autophagy triggered by serum starvation. It is still possible that apoptosis induced in vivo could be potentiated by increased mitochondrial biogenesis, as described (D'Errico et al., 2011).
PPAR is a small nuclear receptor family which has three members: PPARα, PPARβ/δ, and PPARγ. Fibrates are PPAR ligands, and bezafibrate is a pan‐PPARs agonist that has been administered in patients to treat hyperlipidemia with a good safety profile for over 30 years. Tenenbaum et al. showed its effect in reducing the incidence of myocardial infarction (MI) in patients with metabolic syndrome (Tenenbaum et al., 2005). Many other clinical studies have also revealed beneficial effects of bezafibrate on glucose and insulin metabolism (Jonkers et al., 2002; Kim et al., 2003). In our hands, bezafibrate dramatically boosted fatty acid beta‐oxidation. Bezafibrate also increased the activities of OXPHOS complexes in cells with related enzyme defects and activated the PPAR/PGC‐1α pathway (Bastin et al., 2008, 2009, 2008, [Link]). Our data showed that an increase in mitochondrial biogenesis was not accompanied by a stoichiometric increase of all mitochondrial components. That may not be surprising as the effect of PPARs and PGC‐1α/β on promoters of genes coding for mitochondrial proteins is unlikely to be identical. This may also explain why respiration was not increased, as one or more limiting factors could restrict the flow of electrons.
It is becoming clear that the understanding the bioenergetics of cancer cells is important to unravel tumors behavior and to develop new targets for therapy (Ferreira, 2010). Schulz and colleagues have found that overexpression of frataxin induces mitochondria biogenesis and inhibits cell growth, supporting our findings (Schulz et al., 2006). PPAR/PGC‐1 is an emerging pathway associated with tumorigenesis. Ban et al. found that PPAR gamma agonist troglitazone inhibited colon cancer cell growth via inactivation of NF‐κB by suppressing GSK‐3β activity (Ban et al., 2010). Recently, Giguere and colleagues reported that miR‐378∗ mediated metabolic shift in breast cancer cells by inhibiting the PGC‐1β/ERRγ transcriptional pathway (Eichner et al., 2010). MiR‐378/378∗ were implied in adipocyte gene expression and lipogenesis (Gerin et al., 2010), while mi‐R378 was reported to also promote tumor progression and angiogenesis both in vitro and in vivo (Lee et al., 2007). Activation of PPARγ has been identified as an approach for inducing differentiation and inhibiting proliferation in a variety of cancers. Moreover, activation of PPARγ by specific ligands was shown to induce apoptosis and potentiate current anti‐tumor treatment (Lee et al., 2006).
Diverse metabolic pathways have been implicated in tumorigenesis. New evidence suggests that classical oncogenic pathways such as the PI3‐kinase/mTOR, the p53 and the myc pathways are centrally involved in the reprogramming of glucose and glutamine metabolism to fuel cancer cell growth (Amornphimoltham et al., 2008; Okuyama et al., 2010). PPARs represent a group of transcription factors that are central to control of metabolism in a wide variety of tissues. The new advances in the understanding of tumor metabolism have provided clues for several novel targets for anti‐tumor treatment. Xu et al. reported that inhibition of glycolysis was a promising therapeutic strategy to effectively kill cancer cells and overcome drug resistance (Xu et al., 2005). One of the best‐known hexokinase inhibitors, 2‐deoxyglucose (2‐DG), has entered phase I/II clinical trial for the treatment of advanced prostate cancer (Clinical trial: NCT00633087).
In summary, our work showed that increased OXPHOS in cancer cell impairs tumorigenic phenotypes including cell growth, cell invasion and survival. This study supports the concept that decreased mitochondrial metabolism contributes to tumorigenesis and cancer progression.
Supporting information
The following are the Supplementary data related to this article:
Supplementary data
Supplementary data
Acknowledgments
We thank Dr. Brian Kim and Dr. Douglas Crawford (University of Miami) for assistance with cell respiration measurements, and the Flow Cytometry Core Facility at the UM Sylvester Comprehensive Cancer Center for assistance with membrane potential determinations. We thank Actavis Pharmaceuticals for the generous gift of bezafibrate. This work was supported by NIH grants CA085700, AG036871 and EY010804. It was also supported by the James & Esther King Biomedical Research Program.
Supplementary material 1.
Supplementary data associated with this article can be found in the online version, at doi:10.1016/j.molonc.2011.07.008.
Wang Xiao and Moraes Carlos T., (2011), Increases in mitochondrial biogenesis impair carcinogenesis at multiple levels, Molecular Oncology, 5, doi: 10.1016/j.molonc.2011.07.008.
References
- Amornphimoltham, P. , Patel, V. , Leelahavanichkul, K. , Abraham, R.T. , Gutkind, J.S. , 2008. A retroinhibition approach reveals a tumor cell-autonomous response to rapamycin in head and neck cancer. Cancer Res.. 68, 1144–1153. [DOI] [PMC free article] [PubMed] [Google Scholar]
- Ban, J.O. , Kwak, D.H. , Oh, J.H. , Park, E.J. , Cho, M.C. , Song, H.S. , Song, M.J. , Han, S.B. , Moon, D.C. , Kang, K.W. , Hong, J.T. , 2010. Suppression of NF-kappaB and GSK-3beta is involved in colon cancer cell growth inhibition by the PPAR agonist troglitazone. Chem. Biol. Interact. 188, 75–85. [DOI] [PubMed] [Google Scholar]
- Barrientos, A. , Marin, C. , Miro, O. , Casademont, J. , Gomez, M. , Nunes, V. , Tolosa, E. , Urbano-Marquez, A. , Cardellach, F. , 1998. Biochemical and molecular effects of chronic haloperidol administration on brain and muscle mitochondria of rats. J. Neurosci. Res.. 53, 475–481. [DOI] [PubMed] [Google Scholar]
- Bastin, J. , Aubey, F. , Rotig, A. , Munnich, A. , Djouadi, F. , 2008. Activation of peroxisome proliferator-activated receptor pathway stimulates the mitochondrial respiratory chain and can correct deficiencies in patients’ cells lacking its components. J. Clin. Endocrinol. Metab.. 93, 1433–1441. [DOI] [PubMed] [Google Scholar]
- Biswas, G. , Guha, M. , Avadhani, N.G. , 2005. Mitochondria-to-nucleus stress signaling in mammalian cells: nature of nuclear gene targets, transcription regulation, and induced resistance to apoptosis. Gene. 354, 132–139. [DOI] [PMC free article] [PubMed] [Google Scholar]
- Bonnefont, J.P. , Bastin, J. , Behin, A. , Djouadi, F. , 2009. Bezafibrate for an inborn mitochondrial beta-oxidation defect. N. Engl. J. Med.. 360, 838–840. [DOI] [PubMed] [Google Scholar]
- Chatterjee, A. , Mambo, E. , Sidransky, D. , 2006. Mitochondrial DNA mutations in human cancer. Oncogene. 25, 4663–4674. [DOI] [PubMed] [Google Scholar]
- Cuezva, J.M. , Krajewska, M. , de Heredia, M.L. , Krajewski, S. , Santamaria, G. , Kim, H. , Zapata, J.M. , Marusawa, H. , Chamorro, M. , Reed, J.C. , 2002. The bioenergetic signature of cancer: a marker of tumor progression. Cancer Res.. 62, 6674–6681. [PubMed] [Google Scholar]
- D'Errico, I. , Salvatore, L. , Murzilli, S. , Lo Sasso, G. , Latorre, D. , Martelli, N. , Egorova, A.V. , Polishuck, R. , Madeyski-Bengtson, K. , Lelliott, C. , Vidal-Puig, A.J. , Seibel, P. , Villani, G. , Moschetta, A. , 2011. Peroxisome proliferator-activated receptor-gamma coactivator 1-alpha (PGC1alpha) is a metabolic regulator of intestinal epithelial cell fate. Proc. Natl. Acad. Sci. U S A. 108, 6603–6608. [DOI] [PMC free article] [PubMed] [Google Scholar]
- Deberardinis, R.J. , Sayed, N. , Ditsworth, D. , Thompson, C.B. , 2008. Brick by brick: metabolism and tumor cell growth. Curr. Opin. Genet. Dev.. 18, 54–61. [DOI] [PMC free article] [PubMed] [Google Scholar]
- Dey, R. , Moraes, C.T. , 2000. Lack of oxidative phosphorylation and low mitochondrial membrane potential decrease susceptibility to apoptosis and do not modulate the protective effect of Bcl-x(L) in osteosarcoma cells. J. Biol. Chem.. 275, 7087–7094. [DOI] [PubMed] [Google Scholar]
- Eichner, L.J. , Perry, M.C. , Dufour, C.R. , Bertos, N. , Park, M. , St-Pierre, J. , Giguere, V. , 2010. miR-378(∗) mediates metabolic shift in breast cancer cells via the PGC-1beta/ERRgamma transcriptional pathway. Cell Metab.. 12, 352–361. [DOI] [PubMed] [Google Scholar]
- Ferreira, L.M. , 2010. Cancer metabolism: the Warburg effect today. Exp. Mol. Pathol.. 89, 372–380. [DOI] [PubMed] [Google Scholar]
- Formentini, L. , Martínez-Reyes, I. , Cuezva, J.M. , 2010. The mitochondrial bioenergetic capacity of carcinomas. IUBMB Life. 62, 554–560. [DOI] [PubMed] [Google Scholar]
- Gatenby, R.A. , Gillies, R.J. , 2004. Why do cancers have high aerobic glycolysis?. Nat. Rev. Cancer. 4, 891–899. [DOI] [PubMed] [Google Scholar]
- Gatenby, R.A. , Gawlinski, E.T. , Gmitro, A.F. , Kaylor, B. , Gillies, R.J. , 2006. Acid-Mediated tumor invasion: a Multidisciplinary study. Cancer Res.. 66, 5216–5223. [DOI] [PubMed] [Google Scholar]
- Gerin, I. , Bommer, G.T. , McCoin, C.S. , Sousa, K.M. , Krishnan, V. , MacDougald, O.A. , 2010. Roles for miRNA-378/378∗ in adipocyte gene expression and lipogenesis. Am. J. Physiol. Endocrinol. Metab.. 299, E198–E206. [DOI] [PMC free article] [PubMed] [Google Scholar]
- Jonkers, I.J. , Mohrschladt, M.F. , Westendorp, R.G. , van der Laarse, A. , Smelt, A.H. , 2002. Severe hypertriglyceridemia with insulin resistance is associated with systemic inflammation: reversal with bezafibrate therapy in a randomized controlled trial. Am. J. Med.. 112, 275–280. [DOI] [PubMed] [Google Scholar]
- Kim, J.I. , Tsujino, T. , Fujioka, Y. , Saito, K. , Yokoyama, M. , 2003. Bezafibrate improves hypertension and insulin sensitivity in humans. Hypertens. Res.. 26, 307–313. [DOI] [PubMed] [Google Scholar]
- Lee, S.Y. , Hur, G.Y. , Jung, K.H. , Jung, H.C. , Kim, J.H. , Shin, C. , Shim, J.J. , In, K.H. , Kang, K.H. , Yoo, S.H. , 2006. PPAR-gamma agonist increase gefitinib's antitumor activity through PTEN expression. Lung Cancer. 51, 297–301. [DOI] [PubMed] [Google Scholar]
- Lee, D.Y. , Deng, Z. , Wang, C.H. , Yang, B.B. , 2007. MicroRNA-378 promotes cell survival, tumor growth, and angiogenesis by targeting SuFu and Fus-1 expression. Proc. Natl. Acad. Sci. U S A. 104, 20350–20355. [DOI] [PMC free article] [PubMed] [Google Scholar]
- Li, D. , Cui, Q. , Chen, S.G. , Wu, L.J. , Tashiro, S. , Onodera, S. , Ikejima, T. , 2007. Inactivation of ras and changes of mitochondrial membrane potential contribute to oridonin-induced autophagy in a431 cells. J. Pharm. Sci.. 105, 22–33. [DOI] [PubMed] [Google Scholar]
- Lopez-Rios, F. , Sanchez-Arago, M. , Garcia-Garcia, E. , Ortega, A.D. , Berrendero, J.R. , Pozo-Rodriguez, F. , Lopez-Encuentra, A. , Ballestin, C. , Cuezva, J.M. , 2007. Loss of the mitochondrial bioenergetic capacity underlies the glucose avidity of carcinomas. Cancer Res.. 67, 9013–9017. [DOI] [PubMed] [Google Scholar]
- MacLellan, J.D. , Gerrits, M.F. , Gowing, A. , Smith, P.J. , Wheeler, M.B. , Harper, M.E. , 2005. Physiological increases in uncoupling protein 3 augment fatty acid oxidation and decrease reactive oxygen species production without uncoupling respiration in muscle cells. Diabetes. 54, 2343–2350. [DOI] [PubMed] [Google Scholar]
- Marroquin, L.D. , Hynes, J. , Dykens, J.A. , Jamieson, J.D. , Will, Y. , 2007. Circumventing the Crabtree effect: replacing media glucose with galactose increases susceptibility of HepG2 cells to mitochondrial toxicants. Toxicol. Sci.. 97, 539–547. [DOI] [PubMed] [Google Scholar]
- Mehlen, P. , Puisieux, A. , 2006. Metastasis: a question of life or death. Nat. Rev. Cancer. 6, 449–458. [DOI] [PubMed] [Google Scholar]
- Okuyama, H. , Endo, H. , Akashika, T. , Kato, K. , Inoue, M. , 2010. Downregulation of c-MYC protein levels contributes to cancer cell survival under dual deficiency of oxygen and glucose. Cancer Res.. 70, 10213–10223. [DOI] [PubMed] [Google Scholar]
- Paglin, S. , Lee, N.Y. , Nakar, C. , Fitzgerald, M. , Plotkin, J. , Deuel, B. , Hackett, N. , McMahill, M. , Sphicas, E. , Lampen, N. , Yahalom, J. , 2005. Rapamycin-sensitive pathway regulates mitochondrial membrane potential, autophagy, and survival in irradiated MCF-7 cells. Cancer Res.. 65, 11061–11070. [DOI] [PubMed] [Google Scholar]
- Park, J.S. , Sharma, L.K. , Li, H. , Xiang, R. , Holstein, D. , Wu, J. , Lechleiter, J. , Naylor, S.L. , Deng, J.J. , Lu, J. , Bai, Y. , 2009. A heteroplasmic, not homoplasmic, mitochondrial DNA mutation promotes tumorigenesis via alteration in reactive oxygen species generation and apoptosis. Hum. Mol. Genet.. 18, 1578–1589. [DOI] [PMC free article] [PubMed] [Google Scholar]
- Petros, J.A. , Baumann, A.K. , Ruiz-Pesini, E. , Amin, M.B. , Sun, C.Q. , Hall, J. , Lim, S. , Issa, M.M. , Flanders, W.D. , Hosseini, S.H. , Marshall, F.F. , Wallace, D.C. , 2005. mtDNA mutations increase tumorigenicity in prostate cancer. Proc. Natl. Acad. Sci. USA. 102, 719–724. [DOI] [PMC free article] [PubMed] [Google Scholar]
- Rigoulet, M. , Yoboue, E.D. , Devin, A. , 2011. Mitochondrial ROS generation and its regulation: mechanisms involved in H(2)O(2) signaling. Antioxid. Redox Signal. 14, 459–468. [DOI] [PubMed] [Google Scholar]
- Robinson, B.H. , Petrova-Benedict, R. , Buncic, J.R. , Wallace, D.C. , 1992. Nonviability of cells with oxidative defects in galactose medium: a screening test for affected patient fibroblasts. Biochem. Med. Metab. Biol.. 48, 122–126. [DOI] [PubMed] [Google Scholar]
- Samudio, I. , Fiegl, M. , Andreeff, M. , 2009. Mitochondrial uncoupling and the Warburg effect: molecular basis for the reprogramming of cancer cell metabolism. Cancer Res.. 69, 2163–2166. [DOI] [PMC free article] [PubMed] [Google Scholar]
- Schulz, T.J. , Thierbach, R. , Voigt, A. , Drewes, G. , Mietzner, B. , Steinberg, P. , Pfeiffer, A.F. , Ristow, M. , 2006. Induction of oxidative metabolism by mitochondrial frataxin inhibits cancer growth: Otto Warburg revisited. J. Biol. Chem.. 281, 977–981. [DOI] [PubMed] [Google Scholar]
- Selak, M.A. , Armour, S.M. , MacKenzie, E.D. , Boulahbel, H. , Watson, D.G. , Mansfield, K.D. , Pan, Y. , Simon, M.C. , Thompson, C.B. , Gottlieb, E. , 2005. Succinate links TCA cycle dysfunction to oncogenesis by inhibiting HIF-alpha prolyl hydroxylase. Cancer Cell. 7, 77–85. [DOI] [PubMed] [Google Scholar]
- Srivastava, S. , Diaz, F. , Iommarini, L. , Aure, K. , Lombes, A. , Moraes, C.T. , 2009. PGC-1alpha/beta induced expression partially compensates for respiratory chain defects in cells from patients with mitochondrial disorders. Hum. Mol. Genet.. 18, 1805–1812. [DOI] [PMC free article] [PubMed] [Google Scholar]
- St-Pierre, J. , Drori, S. , Uldry, M. , Silvaggi, J.M. , Rhee, J. , Jager, S. , Handschin, C. , Zheng, K. , Lin, J. , Yang, W. , Simon, D.K. , Bachoo, R. , Spiegelman, B.M. , 2006. Suppression of reactive oxygen species and neurodegeneration by the PGC-1 transcriptional coactivators. Cell. 127, 397–408. [DOI] [PubMed] [Google Scholar]
- Tenenbaum, A. , Motro, M. , Fisman, E.Z. , Tanne, D. , Boyko, V. , Behar, S. , 2005. Bezafibrate for the secondary prevention of myocardial infarction in patients with metabolic syndrome. Arch. Intern. Med.. 165, 1154–1160. [DOI] [PubMed] [Google Scholar]
- van Waveren, C. , Sun, Y. , Cheung, H.S. , Moraes, C.T. , 2006. Oxidative phosphorylation dysfunction modulates expression of extracellular matrix–remodeling genes and invasion. Carcinogenesis. 27, 409–418. [DOI] [PMC free article] [PubMed] [Google Scholar]
- Vander Heiden, M.G. , Locasale, J.W. , Swanson, K.D. , Sharfi, H. , Heffron, G.J. , Amador-Noguez, D. , Christofk, H.R. , Wagner, G. , Rabinowitz, J.D. , Asara, J.M. , Cantley, L.C. , 2010. Evidence for an alternative glycolytic pathway in rapidly proliferating cells. Science. 329, 1492–1499. [DOI] [PMC free article] [PubMed] [Google Scholar]
- Vichai, V. , Kirtikara, K. , 2006. Sulforhodamine B colorimetric assay for cytotoxicity screening. Nat. Protoc.. 1, 1112–1116. [DOI] [PubMed] [Google Scholar]
- Warburg, O. , Wind, F. , Negelein, E. , 1926. Über den Stoffwechsel von Tumoren im Körper. J. Mol. Med.. 5, 829–832. [Google Scholar]
- Warburg, O. , Wind, F. , Negelein, E. , 1927. The metabolism of tumors in the body. J. Gen. Physiol.. 8, 519–530. [DOI] [PMC free article] [PubMed] [Google Scholar]
- Wenz, T. , Diaz, F. , Spiegelman, B.M. , Moraes, C.T. , 2008. Activation of the PPAR/PGC-1alpha pathway prevents a bioenergetic deficit and effectively improves a mitochondrial myopathy phenotype. Cell Metab.. 8, 249–256. [DOI] [PMC free article] [PubMed] [Google Scholar] [Retracted]
- Wenz, T., Wang, X., Marini, M., Moraes, C.T., A metabolic shift induced by a PPAR panagonist markedly reduces the effects of pathogenic mitochondrial tRNA mutations. J. Cell Mol. Med., in press. [DOI] [PMC free article] [PubMed]
- Xu, R.H. , Pelicano, H. , Zhou, Y. , Carew, J.S. , Feng, L. , Bhalla, K.N. , Keating, M.J. , Huang, P. , 2005. Inhibition of glycolysis in cancer cells: a novel strategy to overcome drug resistance associated with mitochondrial respiratory defect and hypoxia. Cancer Res.. 65, 613–621. [PubMed] [Google Scholar]
- Zhang, H. , Kong, X. , Kang, J. , Su, J. , Li, Y. , Zhong, J. , Sun, L. , 2009. Oxidative stress induces parallel autophagy and mitochondria dysfunction in human glioma U251 cells. Toxicol. Sci.. 110, 376–388. [DOI] [PubMed] [Google Scholar]
- Zhou, S. , Kachhap, S. , Singh, K.K. , 2003. Mitochondrial impairment in p53-deficient human cancer cells. Mutagenesis. 18, 287–292. [DOI] [PubMed] [Google Scholar]
Associated Data
This section collects any data citations, data availability statements, or supplementary materials included in this article.
Supplementary Materials
The following are the Supplementary data related to this article:
Supplementary data
Supplementary data