

Abstract
Strong experimental evidence implicates the corticospinal tract in voluntary control of the contralateral forelimb. Its potential role in controlling the ipsilateral forelimb is less well understood, although anatomical projections to ipsilateral spinal circuits are identified. We investigated inputs to motoneurons innervating hand and forearm muscles from the ipsilateral corticospinal tract using multiple methods. Intracellular recordings from 62 motoneurons in three anesthetized monkeys revealed no monosynaptic and only one weak oligosynaptic EPSP after stimulation of the ipsilateral corticospinal tract. Single stimulus intracortical microstimulation of the primary motor cortex (M1) in awake animals failed to produce any responses in ipsilateral muscles. Strong stimulation (>500 μA, single stimulus) of the majority of corticospinal axons at the medullary pyramids revealed only weak suppressions in ipsilateral muscles at longer latencies than the robust facilitations seen contralaterally. Spike-triggered averaging of ipsilateral muscle activity from M1 neural discharge (184 cells) did not reveal any postspike effects consistent with monosynaptic corticomotoneuronal connections. We also examined the activity of 191 M1 neurons during ipsilateral or contralateral “reach to precision grip” movements. Many cells (67%) modulated their activity during ipsilateral limb movement trials (compared with 90% with contralateral trials), but the timing of this activity was best correlated with weak muscle activity in the contralateral nonmoving arm. We conclude that, in normal adults, any inputs to forelimb motoneurons from the ipsilateral corticospinal tract are weak and indirect and that modulation of M1 cell firing seems to be related primarily to control of the contralateral limb.
Introduction
Many of our everyday actions require the coordinated action of two hands. Much evidence implicates the corticospinal tract, the dominant descending pathway projecting from the brain to the spinal cord in primates, in the control of the contralateral limb. The situation for the ipsilateral limb is less clear: around 40% of corticospinal fibers originate in the primary motor cortex (M1) (Dum and Strick, 1991) and terminate mostly in the intermediate and ventral laminae of the cord (Kuypers, 1981). Although the large majority cross at the medullary–spinal junction and descend the contralateral cord, a small fraction (8–10%) do not decussate here but descend ipsilaterally. In addition, contralaterally descending fibers have collaterals that recross the midline at spinal level, thus also influencing the ipsilateral spinal circuitry (Rosenzweig et al., 2009).
Ipsilaterally descending pathways might play an important role in movement control. Neurons in M1, including pyramidal tract neurons (PTNs), may modulate their activity during both contralateral and ipsilateral movements (e.g., Matsunami and Hamada, 1980). However, whether the ipsilateral cortex is genuinely involved in controlling ipsilateral muscles, or whether the modulation in activity instead relates to control of contralateral muscles—for example to ensure a stable posture, or to prevent inappropriate contralateral movements—is unclear. Importantly, if they can provide access to limb and hand motoneurons, ipsilateral pathways might provide a substrate for recovery of function after a lesion of the contralateral corticospinal tract (e.g., after motor stroke) (Brus-Ramer et al., 2007; Rosenzweig et al., 2009), connecting the paralyzed side of the body with an intact cortex capable of effectively relaying voluntary motor commands.
Anatomical studies do not resolve this issue: many corticospinal projections terminate ipsilaterally in lamina VIII of the spinal cord, a region containing interneurons concerned with control of the axial musculature and many of them commissural (so their axons will cross back to the contralateral side). Reports of terminals in the ipsilateral intermediate zone and ventral horn are more varied: in hindlimb-related segments, these terminations have been reported (Lacroix et al., 2004); in cervical cord, they are rare (Yoshino-Saito et al., 2010) although some reports describe them (Rosenzweig et al., 2009).
Here we address whether primate ipsilateral corticospinal terminals make corticomotoneuronal connections to forelimb, and especially hand, motoneurons and whether they influence motor output via more indirect pathways (e.g., involving segmental interneurons). Using electrophysiological recordings in both awake and terminally anesthetized monkeys, we show that activation of forearm and hand motoneurons by the ipsilateral corticospinal tract is weak or absent. Furthermore, we ask what function modulation of M1 neuron discharge has in ipsilateral hand movements. We show that such modulation is slight compared with that seen during contralateral movements, and most likely related to weak modulations in the activity of contralateral muscles. We conclude that primate ipsilateral corticospinal projections have a quite different function from their more numerous contralateral counterparts.
Materials and Methods
All animal procedures were performed under UK Home Office regulations in accordance with the Animals (Scientific Procedures) Act (1986) and were approved by the relevant Local Research Ethics Committee.
Intracellular motoneuron recordings
Recordings were made from three female Macaca mulatta monkeys (monkeys JN, JW, and JD; age, 9 years; weight, 6, 9.2, and 7.6 kg, respectively) under terminal anesthesia, using the same methods described by Riddle et al. (2009). Briefly, initial surgical preparation was performed under deep anesthesia with sevoflurane (3–5% in 100% O2) and alfentanil (7–23 μg kg−1 h−1 by intravenous infusion). A tracheotomy was made, and central venous and arterial lines were inserted via neck vessels. Nerve cuff electrodes were implanted around the following peripheral nerves of the right arm: deep radial at the elbow (supplying forearm and digit extensors), median and ulnar nerves in the upper arm (supplying forearm flexors and intrinsic hand muscles), and median and ulnar nerves at the wrist (supplying intrinsic hand muscles). Spinal segments C6–T1 were exposed by a laminectomy. The anesthetic regimen was then switched to an intravenous infusion of propofol (5–14 mg kg−1 h−1) and alfentanil (doses as above). To improve recording stability, the vertebral column was clamped at high thoracic and midlumbar levels, and the head was held in a stereotaxic frame angled to produce ∼60° neck flexion. A pneumothorax was performed to minimize chest movements consequent on ventilation. Neuromuscular blockade was achieved by infusion of atracurium (0.6–1.2 mg kg−1h−1). Continuously monitored vital signs included heart rate, arterial and venous blood pressure, blood oxygen saturation, end-tidal CO2, and core temperature. We verified the depth of anesthesia by ensuring that there were no changes in heart rate or arterial blood pressure in response to peripheral nerve stimulation.
Stainless steel stimulating electrodes insulated with parylene (MS501G; Microprobe) were implanted in both left and right medullary pyramidal tracts (PTs) using a double-angle stereotaxic technique (Soteropoulos and Baker, 2006), with the following initial targets: anterior (A), 0; mediolateral (ML), 0.7; dorsoventral, −6. During electrode placement, antidromic volleys were recorded from epidural electrodes placed over M1 bilaterally (craniotomy centered at A18, ML13), and orthodromic volleys were recorded from the cord dorsum. Electrode location was optimized to yield an ipsilateral, but no contralateral, M1 response at a 300 μA stimulating current. The indifferent electrode was a silver wire electrode inserted under the scalp.
Intracellular recordings were made from spinal motoneurons using glass micropipettes broken to a tip of ∼0.5 μm (tip impedance 3–20 MΩ) filled with 2 m potassium acetate. Motoneurons were identified by antidromic spiking after stimulation through nerve cuff electrodes (intensity three times the motor threshold). Cells were assigned to muscle groups based on the pattern of responses to different cuffs and known anatomy. Thus, a cell that responded to the median nerve at the arm, but not at the wrist, was assumed to project to forearm flexors; response to both median nerve cuffs confirmed projection to intrinsic hand muscles.
Motoneuron responses to ipsilateral and contralateral PT stimulation were recorded to single stimuli and trains of three/four stimuli (300 μA biphasic pulses, 0.2 ms per phase, 300 Hz train frequency, 1 Hz repetition rate). Isolated constant-current stimulators (model 2100; AM Systems) were used to deliver all stimuli. A silver ball electrode on the cord dorsum close to the electrode penetration point recorded surface volleys simultaneously with intracellular potentials. Intracellular waveforms were sampled at 25 kHz (gain, 200 or 500; 10 Hz to 10 kHz bandpass) via a micro1401 interface (Cambridge Electronic Design UK) together with M1 and spinal epidural waveforms (12.5 kHz sampling rate; gain, 10,000; 30 Hz to 5 kHz bandpass) and stimulus markers.
Postsynaptic responses in motoneurons were identified from superimposed single-sweep and averaged records. Intracellular potentials were compared with field recordings made just extracellular to the motoneuron to ensure deflections represented genuine intracellular effects. Segmental latencies of EPSPs were measured from the first inflection of the corresponding epidural volley to the onset of the postsynaptic response. Latencies <1 ms were considered to be monosynaptic (Jankowska et al., 2003; Riddle et al., 2009). Response amplitudes were measured from the onset to peak of the EPSP.
At the end of the experiments, stimulating electrode positions were marked with electrolytic lesions (50 μA for 20 s), anesthesia was increased to a lethal level, and the animals were perfused through the heart with PBS, followed by 4% paraformaldehyde in PBS. Brains were removed and, after cryoprotection in 30% sucrose PBS solution, sectioned at 75 μm on a microtome. Sections were mounted and stained with cresyl violet before reconstruction of the location of stimulating electrode tips.
Behavioral paradigm
Two female rhesus macaques (monkeys T and E; 4 years old; ∼6 kg) were trained on the precision grip task described by Soteropoulos and Baker (2006). The animal was presented with two precision grip manipulanda for left and right hands. Access to the manipulanda was obstructed by plastic flags. The monkey commenced a trial by placing both hands on homepad switches in front of the flags. After ∼500 ms, a 1-s-long audiovisual cue indicated the required movement (left hand only, right hand only, or bimanual), chosen at random. After an instructed delay period (0.7–1.3 s), during which the animal kept the hands on the homepad switches, both flags then moved down (“Go Cue”) permitting access to the manipulanda. The animal reached out with the correct hand and grasped the levers between finger and thumb in a precision grip. The levers were held above a criterion displacement for 1 s, before being released to obtain a food reward. Motors opposed lever movement, simulating the action of springs (force for initial lever movement, 0.15 N; spring constant, 0.03 N/mm). Incorrect movements or premature homepad switch release resulted in a failure tone and termination of that trial. In this study, we analyze only data from the unimanual trials, which are referred to as “contralateral” or “ipsilateral,” referring to the side of the moving hand relative to the M1 recording site.
Surgical preparation for awake recordings
All surgical operations were performed under deep general anesthesia (2–2.5% isoflurane in 50:50 O2:N2O) and were followed by a full course of antibiotics (coamoxyiclav 140/35, 1.75 mg kg−1 clavulanic acid, 7 mg kg−1 amoxycillin; Synulox, Pfizer) and analgesic (buprenorphine; Vetergesic, 10 μg kg−1; Reckitt & Coleman) treatment. In an initial surgery, epimysial patch electrodes (Miller et al., 1993) were implanted over the following muscles bilaterally, with wires routed subcutaneously to a connector on the back: first dorsal interosseus (1DI), abductor pollicis brevis (AbPB), abductor pollicis longus (AbPL), flexor digitorum superifcialis (FDS), extensor digitorum communis (EDC), biceps, and triceps. In a subsequent surgery, the monkeys were implanted with a headpiece to allow atraumatic head fixation (Lemon, 1984) and recording chambers (craniotomy center A18 ML13) allowing access to M1 bilaterally. Two insulated tungsten stimulating electrodes (LF501G; Microprobe) were chronically implanted in each PT for antidromic identification of PTNs (Lemon, 1984; Baker et al., 1999).
Awake recordings
A 16-channel Eckhorn microdrive (Thomas Recording Germany) was used to make up to 14 simultaneous microelectrode penetrations into M1 during daily recording sessions (average number of electrodes used per session was nine, range 3–14). Electrodes were platinum insulated with quartz glass and had a shaft diameter of 80 μm and an impedance of 1–2 MΩ (Thomas Recording). Cells were identified as PTNs if they responded at constant latency to stimulation through the chronically implanted PT electrodes (maximum stimulus intensity, 400 μA; 0.2 ms pulse, 1 Hz) and if the evoked spikes could be collided by orthodromic spikes occurring shortly before the stimulus. Cells that could not be so activated were classified as unidentified neurons (UIDs). Single-unit activity (bandpass, 300 Hz to 10 kHz; sampled at 25 kHz) was recorded while the animal performed the task, together with lever displacement and EMG activity (bandpass, 30 Hz to 2 kHz; sampled at 5 kHz). Off-line, action potential waveforms were discriminated to generate the occurrence times of single spikes using custom-written cluster-cutting software [Getspike, SN Baker, Spikelab (Dyball and Bhumbra, 2003)]. Only single units with a consistent spike waveform and no interspike intervals <1 ms were used in subsequent analysis.
The hand representation of M1 was identified by multiple pulse stimulation (13 biphasic stimuli, 0.2 ms per phase, 300 Hz train frequency, 1 Hz repetition rate) through the recording electrodes and visual observation of muscle twitches at low (<20 μA) current intensities. In some sessions, we recorded the EMG responses to single-stimulus intracortical microstimulation (sICMS; 3.3 or 6 Hz repetition rate).
Corticospinal stimulation in an awake behaving monkey
A third monkey (monkey O; age, 5 years; weight, 6.5 kg) trained on a similar bimanual task as described above was implanted with two stimulating electrodes in the left medullary PT, rostral to the decussation. Bilateral M1 epidural recordings (25 kHz sampling rate; gain, 10,000–20,000; 30–10 KHz bandpass) during the implantation procedure were used to optimize the location of the electrodes so that there was an ipsilateral, but not contralateral, antidromic field potential in M1 with a stimulus intensity of 400 μA. In later experiments, biphasic stimuli (0.1 ms duration pulse, 2 Hz) were delivered through the PT electrodes, using a DS4 Stimulus Isolator (Digitimer UK), at two intensities (500 μA and 1 mA) while the monkey performed the task so that both forelimbs were active during stimulation. The same EMGs were recorded as in monkeys E and T, with the exception of FDS and AbPB on the right and the addition of the lateral deltoid bilaterally.
Data analysis
Stimulus-triggered averages.
Stimulus-triggered averages of all ipsilateral- and contralateral-rectified EMGs were compiled after sICMS (monkeys E and T), covering a period 70 ms before to 70 ms after the stimulus. Because the earliest onset latency was expected to be ∼4 ms (for triceps/biceps muscles), we examined a standardized response region from 4 to 20 ms after the stimulus; as a control region, we used 4–20 ms before the stimulus. The time of the maximum value within the response region was found, and the average of the 12-ms-long data section centered on this time found for each stimulus presentation. The control region was similarly processed. To detect significant responses, single-sweep mean values from control and response regions were compared with paired t tests (significance level, p < 0.05).
Any significant responses were also checked by recompiling the averages, excluding sweeps that included large-amplitude artifacts or EMG modulation. This typically rejected <5% of stimuli. Statistical comparisons were repeated; the only responses that remained significant in this further analysis are considered here.
Spike-triggered averages.
For each cell where >5000 spikes were recorded, we calculated a spike-triggered average (STA; ±2 s) of each rectified EMG to assess the cell's connectivity with motoneuron pools innervating the recorded muscles. Comodulation of the cell firing rate and muscle activity can lead to a nonstationary baseline in STAs. We estimated this baseline by convolving the STA with a Gaussian kernel of unit area and width parameter σ = 30 ms; this was then subtracted from the STA (Williams et al., 2009). The STA was then truncated by 60 ms on either end to remove the convolution edge effects. The SD of this baseline-corrected STA was calculated, excluding the middle region within 50 ms of the triggering spike. To detect significant effects, the maximal and minimal values were found within a standard window 3–20 ms postspike. Averages were classified as facilitations or suppressions, depending on whether the maximum or minimum showed the largest deviation from baseline. The number of bins within the 17-ms-long response region (total of 85 bins) that were larger (for facilitations) or smaller (for suppressions) than the 2 SD level was counted. The rest of the baseline-corrected STAs (excluding the middle ±50 ms region) were subdivided into a total of 222 sections, 17 ms long, and the same procedure was repeated. If the number of bins in the response region exceeding 2 SD of the mean was larger than or equal to the maximum number found in the control region, this was considered a significant effect (p < 0.0045).
All significant responses were also examined by recompiling the averages excluding sweeps with artifacts or other large changes in the EMG; only responses that were still visible in these averages are considered in the results.
Analysis of cell rate modulation.
For each cell, activity was aligned to the end of the 1-s-long lever squeeze (“End Hold” event) for ipsilateral and contralateral trials, and a perievent time histogram (PETH; 20 ms bin width) was generated. Baseline rate was estimated from a period 3–4 s before the End Hold event; in this period, the monkey rested both hands on the home pads. The maximal and minimal rate relative to the baseline, and the time at which these occurred relative to End Hold, was measured over the 2.5 s period before End Hold.
Latency regression analysis.
We assessed the temporal relationship between cell firing and muscle activity by measuring the extent to which the latency of the peak of cell and EMG activity was correlated from trial to trial (Schepens and Drew, 2004). The instantaneous firing rate of the cell was estimated by Gaussian convolution (Baker and Lemon, 2000; Nawrot et al., 2000) (kernel with 30 ms width parameter), and the rectified EMG was smoothed using the same kernel. The time of maximum cell firing and maximum EMG was measured for each trial over the period 1 s before to 1.2 s after the Go Cue. The linear correlation between these two latencies was measured across trials. A similar analysis was performed for the minimum cell and EMG activity.
In cases in which the greatest difference from baseline was a suppression, and the rate dropped fully to zero, we took the first bin in the epoch of interest whose rate dropped below 1 Hz as the latency of the response.
Results
Synaptic responses of motoneurons to PT stimulation
Intracellular recording affords a direct window on the functional connectivity of the corticospinal tract with motoneurons. A total of 62 motoneurons was recorded in three monkeys, of which 34 were tested only with a single stimulus; the remaining 28 were also tested with three or more stimuli to the ipsilateral PT (iPT). Example recordings from two different motoneurons are illustrated in Figure 1, A and B. Figure 1A shows the mean intracellular responses in a forearm flexor motoneuron after a single stimulus (300 μA) delivered to the iPT (black traces) and contralateral PT (cPT; gray traces). The cord dorsum (volley) recordings are also shown underneath. The descending volleys produced by iPT and cPT stimulation were of similar amplitudes, confirming that each electrode activated a similar fraction of PT fibers on either side. The intracellular recordings showed a clear EPSP after cPT stimulation but no response to iPT stimulation. Figure 1B shows the response of a different motoneuron (also projecting to a forearm flexor muscle) after a train of stimuli to each PT. By delivering a train of stimuli, we would expect to produce temporal summation in interposed interneurons and to potentiate any indirect (disynaptic or oligosynaptic) responses. Once again, there was a clear response to the cPT; this followed each stimulus, as expected for a monosynaptic response. By contrast, trains of three or four stimuli to the iPT (train of four illustrated) did not elicit detectable synaptic potentials. In this experiment, the volley from iPT stimulation was larger than that from cPT stimulation (both with 300 μA stimulus intensity).
Figure 1.
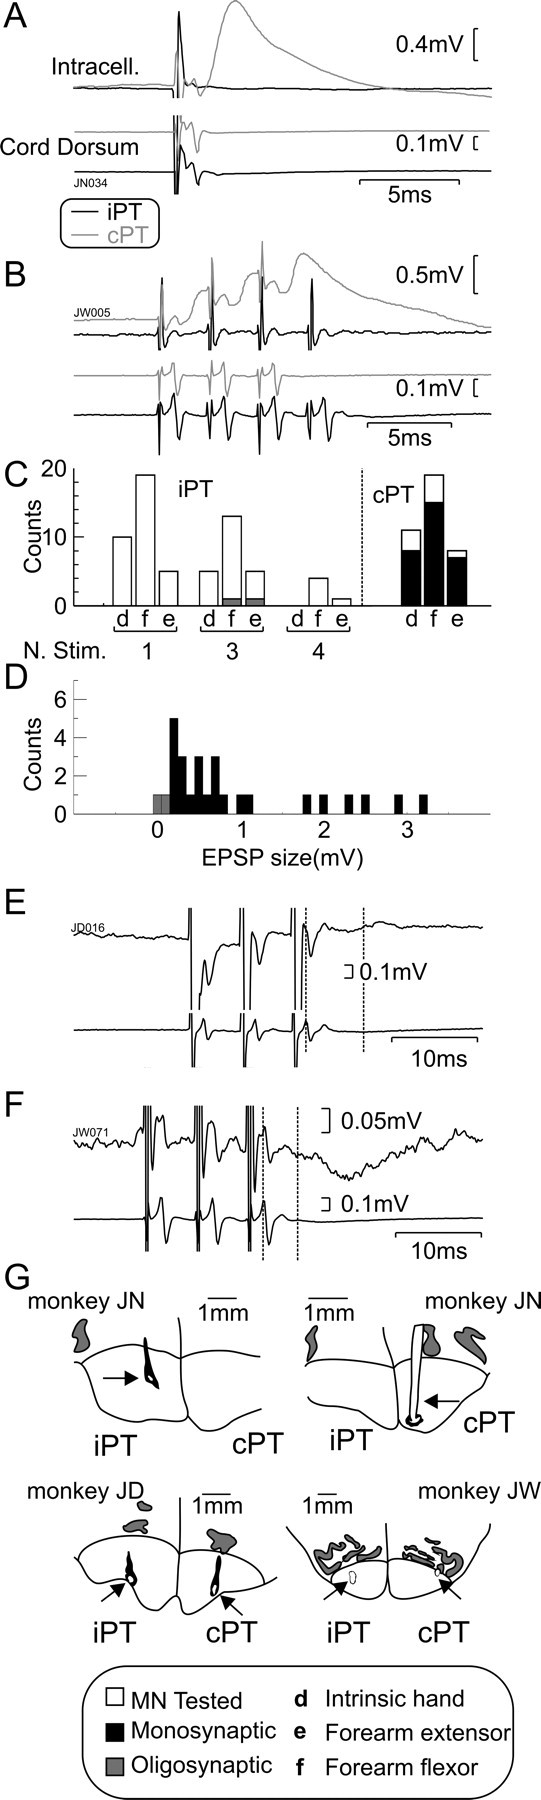
Intracellular motoneuron responses to PT stimulation. A, Example averaged intracellular recordings (intracell.) from a forearm flexor motoneuron in which an EPSP is evoked by a single stimulus to cPT (n = 36) but not to iPT (n = 37). B, Averaged intracellular recordings from a different forearm flexor motoneuron showing EPSPs evoked by multiple stimuli to cPT (3 stimuli; n = 30) but not to iPT (4 stimuli; n = 55). C, Histogram showing the types of motoneurons tested with iPT/cPT and the maximum number of stimuli (N. Stim.) used. Bars to the right of the dotted line correspond to cPT (single stimulus). Gray bars, Oligosynaptic responses; black bars, monosynaptic responses; white bars, no responses. D, Distribution of postsynaptic response amplitudes from PT stimulation. Black bars, cPT effects; gray bars, iPT effects seen. E, Example of weak polysynaptic facilitatory response after a train of three stimuli to iPT. F, Example of weak polysynaptic inhibitory response to a train of three stimuli to iPT. G, Drawings showing the locations of tips of PT stimulating electrodes (arrows) reconstructed from histology. In A, B, E, and F, intracellular recordings are shown above cord dorsum records. In E and F, dotted vertical lines indicate the arrival of the PT volley to the cord and the measured onset of the response.
Figure 1C shows the distribution of sampled motoneurons, divided by the category of the projection muscle (d, distal, intrinsic hand motoneuron; f, forearm flexor; e, forearm extensor) and the maximum number of stimuli tested in a train to the iPT or cPT. Responses were assumed to be monosynaptic if their segmental latency was shorter than 1 ms. No monosynaptic responses were seen from iPT stimulation; in contrast, the great majority of motoneurons (30 of 38 cells) in all three muscle categories received robust monosynaptic EPSPs after cPT stimulation (Fig. 1C, bars to the right of the dotted line).
In just 2 of 62 cells, weak oligosynaptic effects could be detected (Fig. 1C,D, gray shaded bars) after iPT stimulation. These are illustrated in Figure 1, E and F; one was excitatory, the other inhibitory (segmental latencies of 6.1 and 4.1 ms, respectively). Figure 1D shows the distribution of the amplitudes of the monosynaptic EPSPs from cPT; for comparison, the amplitudes of the single oligosynaptic EPSP (Fig. 1E) and IPSP (Fig. 1F) found from iPT are marked as gray bars. The ease with which cPT responses could be seen serves to emphasize the indirect, weak, and rare nature of any effects from iPT.
As in our previous intracellular recordings (Riddle et al., 2009), we often observed IPSPs after cPT stimulation (20 of 38 cells); these were always superimposed on the falling phase of monosynaptic EPSPs, making further analysis difficult. Additionally, stimulation of the medial longitudinal fasciculus in the brainstem as part of a different experiment in these animals generated disynaptic EPSPs (see Riddle et al., 2009). This suggests that our anesthetic regimen left spinal circuits sufficiently excitable for disynaptic responses to be observed. The lack of effects from iPT stimulation therefore probably indicates that iPT axons do not generate either monosynaptic or disynaptic responses in motoneurons.
The drawings of histological sections in Figure 1G show the locations of the stimulating electrode tips in the corticospinal tract of the three monkeys used to gather the above data.
Responses in awake behaving monkeys to M1 stimulation
We recorded bilateral EMG responses during sICMS delivered to 27 forearm M1 sites in two awake behaving monkeys. During stimulation, animals performed the bilateral behavioral task described in Materials and Methods. Figure 2A illustrates the results from a single representative example, in which the stimulus intensity was 30 μA. The EMGs were rectified, and the responses were normalized relative to the mean EMG level during the prestimulus epoch. At this site, the threshold stimulus to elicit visible movements after a train of pulses was estimated as 6 μA. Significant responses were seen in all contralateral muscles except biceps; in contrast, no responses were seen in the corresponding ipsilateral muscles.
Figure 2.
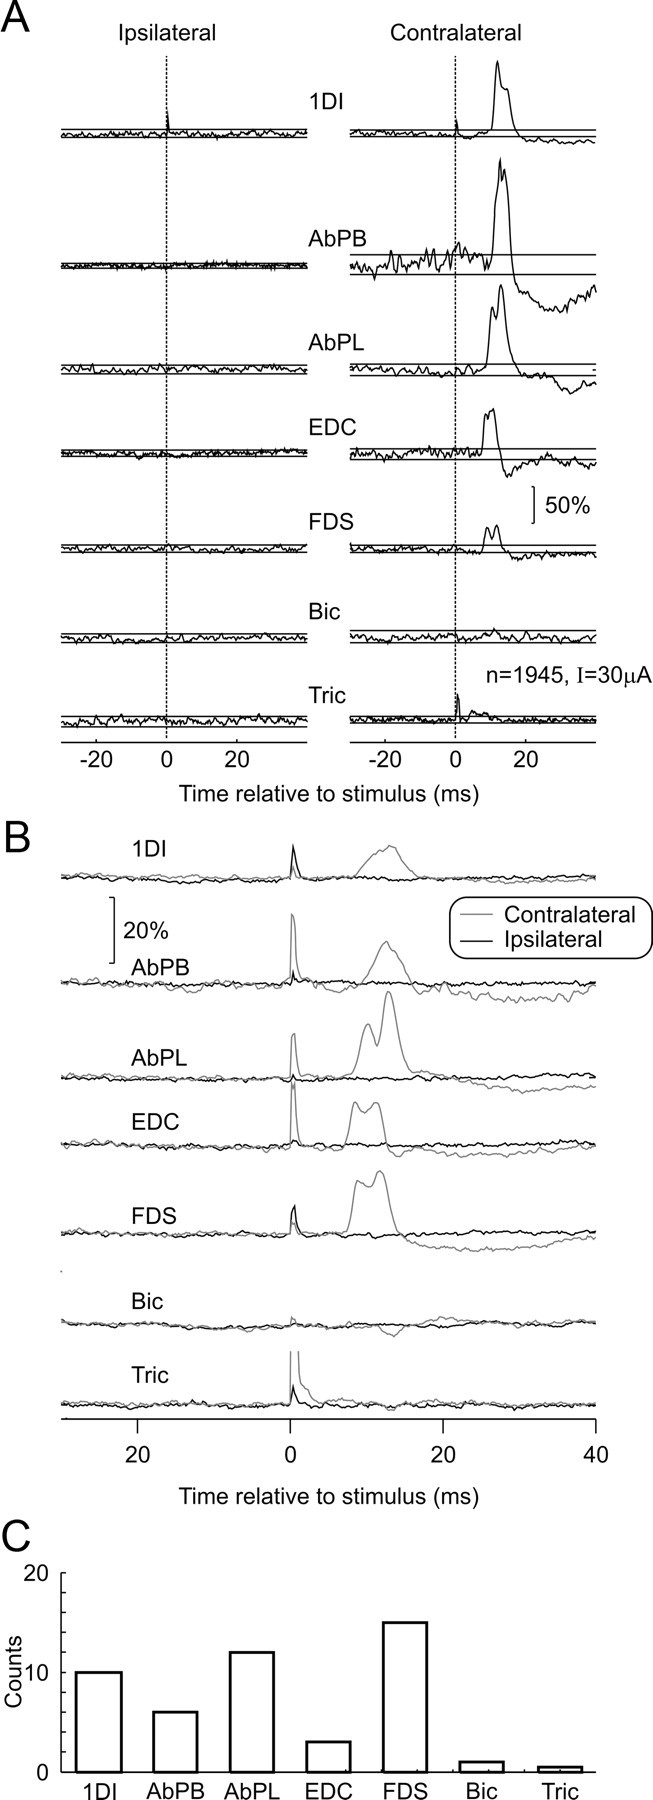
Responses to single-pulse intracortical microstimulation in M1. A, Average EMG responses evoked by sICMS delivered to a single site in M1 (intensity, 30 μA) while the monkey was performing the behavioral task. Traces are normalized as a percentage of the mean baseline level. B, Average across all 23 stimulation sites (black, ipsilateral muscles; gray, contralateral muscles). C, Frequency of effects in different contralateral muscles. Bic, Biceps; Tric, triceps.
Significant contralateral responses were elicited from 23 of 27 sites tested. The stimulus intensity tested varied from 10 to 30 μA (mean, 18.8 μA); this was one to five times greater than the threshold (mean threshold, 8.4 μA) to elicit twitches from a train of stimuli (mean, 2.9 times). The mean number of stimuli given was 2474 (range, 1087–6444).
Overall, 65 significant muscle responses (p < 0.05) were seen, six of which were in ipsilateral muscles. However, all six apparent ipsilateral effects (and five contralateral ones) were produced by artifacts in a small number of sweeps, as excluding these sweeps from the average abolished the effect. Although no genuine ipsilateral responses were seen from individual sites, it might be that the effects were too weak to reach significance with the number of stimuli available to average. Accordingly, Figure 2B presents grand-averaged traces over all 23 sites that showed a significant contralateral response; although these will blur distinctions between sites, they will improve the available signal-to-noise ratio and allow the detection of weak effects, if they are present in many recordings. Although clear effects can be seen in contralateral forearm and hand muscles (Fig. 2B, gray traces), no modulation is visible in the ipsilateral EMGs (Fig. 2B, black traces). Figure 2C shows the overall incidence of significant effects for each contralateral muscle.
Responses in awake behaving monkeys to PT stimulation
Because focal M1 stimulation is likely to activate only a small number of PTNs [both directly and indirectly (Baker et al., 1998)], it is possible that this was insufficient to generate significant responses in ipsilateral muscles, especially if connections are weak or polysynaptic. To test for ipsilateral effects when a large fraction of PT axons are active, we stimulated the PT directly at the medullary pyramids with high stimulus currents in a single monkey. The stimulating electrodes were placed in the left PT rostral to the decussation of the pyramidal fibers, so that they should activate both contralaterally and ipsilaterally descending fibers from the left PT. Recordings were made during the performance of a similar bilateral behavioral task as described in Materials and Methods, ensuring that both arms were active during stimulation.
The results are shown in Figure 3. The two columns in Figure 3A show stimulus-triggered averages from left (ipsilateral) and right (contralateral) muscles. The gray and black traces correspond to the different stimulus intensities tested (black, 500 μA; gray, 1 mA). Clear effects can be seen in contralateral muscles after stimulation at 500 μA (the lowest threshold for seeing effects in contralateral muscles was 100 μA for EDC and 1DI), whereas in ipsilateral EMGs, only a weak suppression is visible, which occurs at a longer latency than the contralateral effects. Figure 3B shows M1 local field potentials evoked by the stimuli, which were recorded simultaneously with the EMG. For a stimulus intensity of 500 μA, there was an antidromic response only in the left M1, confirming that there was no current spread to the PT contralateral to the stimulating electrode. This was, therefore, a purely unilateral activation of the PT. In contrast, when the intensity was increased to 1 mA, a small antidromic response was seen in M1 on both sides, suggesting current spread from the electrode tip to both pyramids. Even at such a high intensity, however, there was no visible facilitation of ipsilateral EMGs. In comparison, contralateral EMGs, especially those from more distal muscles, were clearly facilitated. Even when a large number of PT axons are activated, there is thus no evidence for any monosynaptic responses in ipsilateral muscles.
Figure 3.
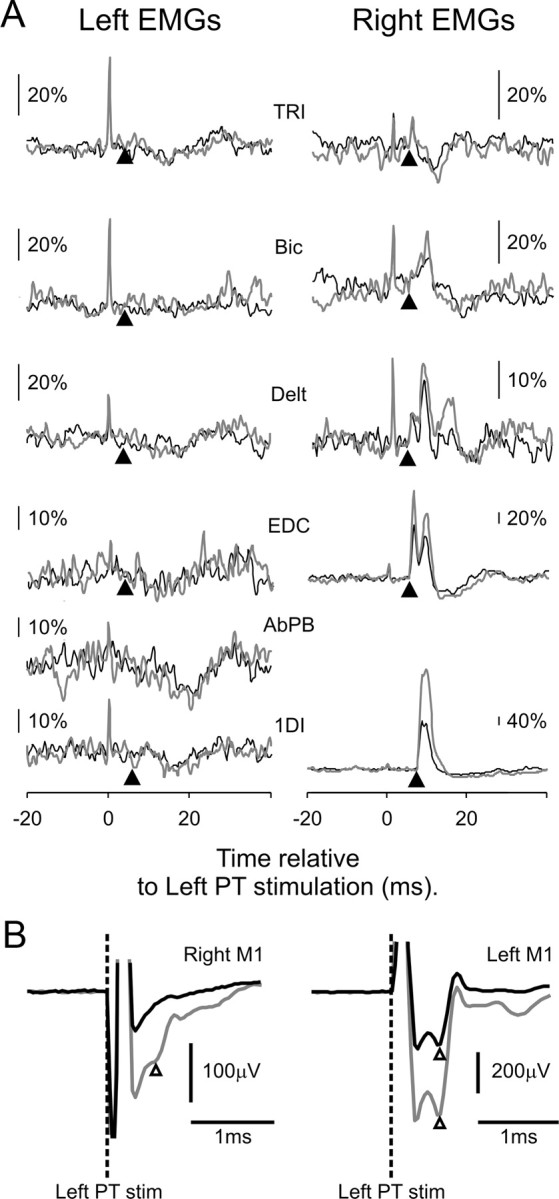
Responses to single-pulse stimulation of the PT. A, Stimulus-triggered averages of bilateral rectified EMGs, using left PT stimulation at intensities of 500 μA (black) and 1000 μA (gray); n = 1511 and 919, respectively. The arrowheads under each trace indicate the onset latency of the response in that muscle after stimulation on the contralateral side. TRI, Triceps; Bic, biceps; Delt, deltoid. B, Antidromic field potentials (onsets marked by white arrowheads) recorded from M1 bilaterally following left PT stimulation (PT stim; indicated by dashed lines). Note that 500 μA stimuli evoked a response in left M1 only (black traces), whereas stimulation at 1000 μA (gray traces) also elicited a small response on the left side, indicating stimulus spread to the contralateral PT.
Spike-triggered averaging
Activity from a total of 211 neurons was recorded from M1 during performance of the behavioral task [monkey T, 142 cells (65 PTNs); monkey E, 69 cells (43 PTNs)]; the activity of 184 cells with ≥5000 spikes was used to perform STA of bilateral EMGs (a total of 2576 STAs). A total of 145 significant postspike effects (facilitation in 104; suppression in 41) were seen, with 12 occurring in ipsilateral muscles. The nine clearest (most significant) potential ipsilateral effects are shown in Figure 4A.
Figure 4.
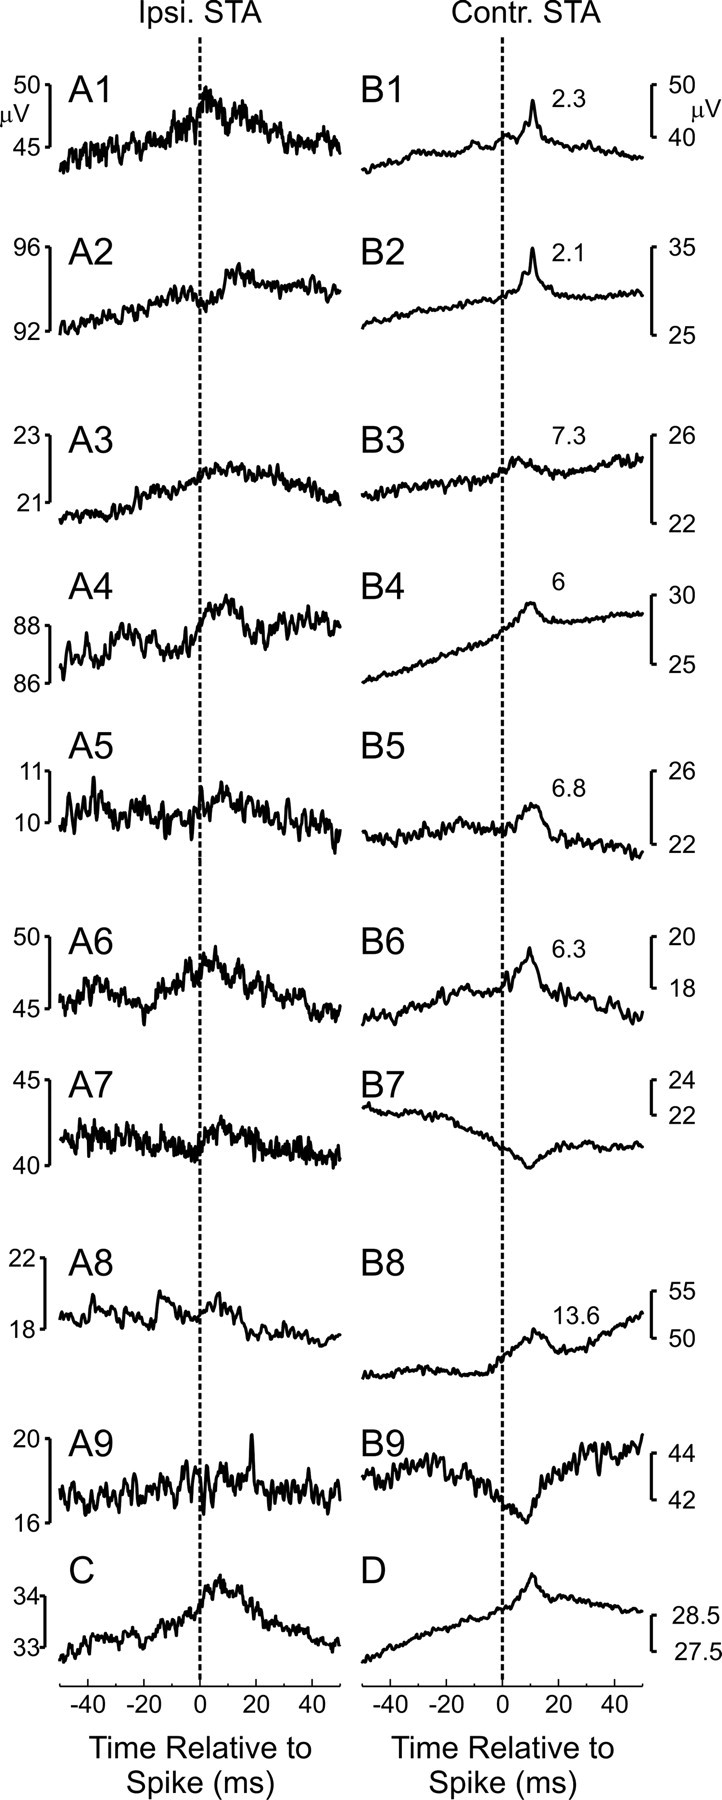
Spike-triggered averages of EMG from M1 cell activity. A1–A9, Nine example ipsilateral averages showing the clearest significant effects found. B1–B9, Same as A1–A9 but for contralateral muscles. C, Average across all significant ipsilateral effects. D, Average across all significant contralateral effects. Note that the averages are differently scaled. The numbers to the right of the contralateral effects correspond to the peak width at half-maximum.
Although STA is a powerful method to detect a monosynaptic connection between a cortical cell and motoneurons innervating a given muscle, care must be taken in the interpretation of effects. Significant features can be produced if the triggering cell is synchronized with other cells that make monosynaptic connections to motoneurons, even if the triggering cell makes no connections of its own (Fetz and Cheney, 1980; Lemon et al., 1986; Baker and Lemon, 1998). Such synchrony effects often have an earlier onset latency than possible for a causal influence from cell to muscle, given known central and peripheral conduction delays. Additionally, jitter in the synchronization leads to wider postspike effects when generated by synchrony than by direct corticomotoneuronal connections; a peak-width at half-maximum (PWHM) larger than 7 ms has been suggested as a criterion to exclude pure synchrony effects (Baker and Lemon, 1998). All of the significant effects seen in ipsilateral muscles were either too broad or had too early an onset latency to be accepted as evidence for a monosynaptic corticomotoneuronal connection. Some had clear oscillations (Fig. 4A2,A4); it is well known that there is oscillatory synchronization between M1 bilaterally (Murthy and Fetz, 1996a,b; Kilner et al., 2003). In other cases, significant ipsilateral effects were caused by a small number of sweeps containing high-amplitude artifacts in the EMG (five effects, two of which are shown in Fig. 4, A8 and A9). These effects disappeared when the sweeps with artifacts were excluded.
In contrast, effects seen in contralateral EMGs (Fig. 4B) included examples of likely monosynaptic effects (Fig. 4B1,B2,B4–B6), based on the PWHM measure (listed to the right of each plot) falling below the criterion of 7 ms. Of the 133 contralateral effects, 19 were excluded as caused by artifacts, and 33 of 114 had PWHM below 7 ms (mean, 4.6 ms); 29 of 33 effects were from PTNs. Figure 4, C and D, shows the grand average of all significant ipsilateral and contralateral effects. Whereas such grand averages lose many of the features of the individual effects, they do reveal clearly that the ipsilateral effects were much broader than those in contralateral muscles. The effect in Figure 4C had an estimated PWHM of 13.8 ms and an onset of 0 ms relative to the spike trigger time. These figures are well outside what would normally be considered as a causal postspike effect.
Modulation of cells in M1 with ipsilateral and contralateral movements
The activity of 191 cells (104 PTNs) in M1 was recorded for at least five trials of the behavioral task performed with each hand. Figure 5A shows the mean PETH, averaged across all PTNs, for ipsilateral (thin line) and contralateral (thick line) trials. Figure 5B presents a similar display for the UIDs. Both populations showed a clear modulation in average activity for contralateral trials. Although there were fluctuations in the mean PETH for ipsilateral trials, these were small.
Figure 5.
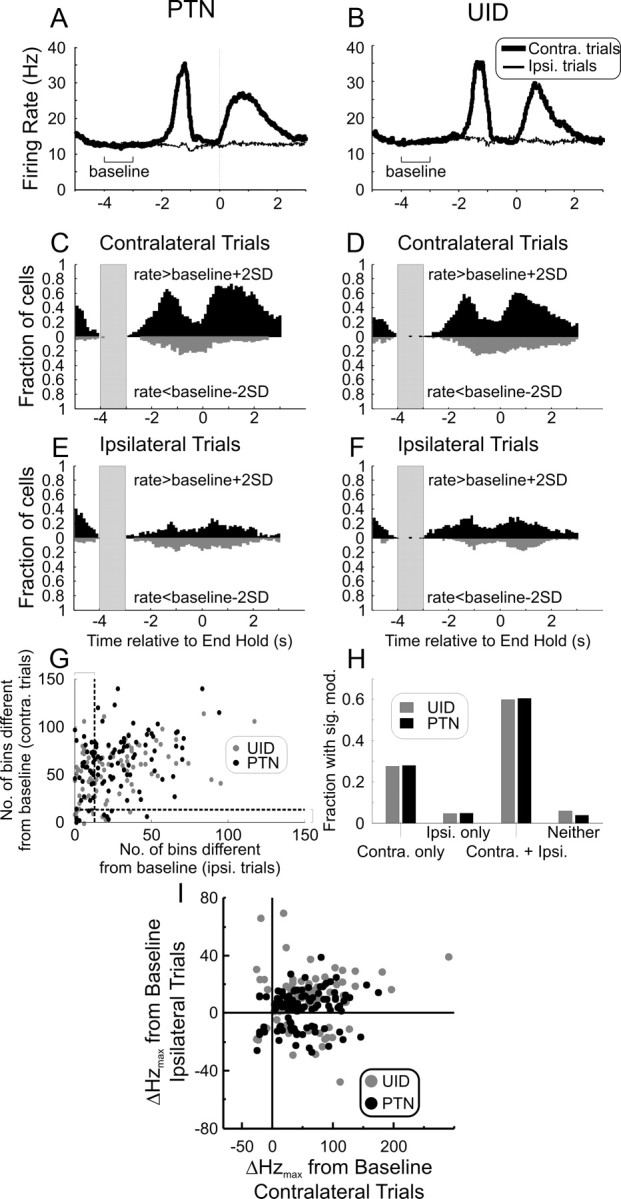
Task-related activity of cells in M1 during ipsilateral (Ipsi.) and contralateral (Contra.) limb movements. A, Mean PSTH of 104 PTNs during ipsilateral (thin line) and contralateral (thick line) trials aligned to the End Hold task marker. B, Same as A but for 87 UIDs. C, Number of bins across the population of PTNs with rates higher than baseline plus 2 SD (upward, black bars) and with rates lower than baseline minus 2 SD (downward, gray bars) for contralateral trials. D, Same as C but for UIDs. E, Same as B but for ipsilateral trials. F, Same as D but for ipsilateral trials. The shaded area in C–F indicates the region used as baseline. Cell activity aligned to end of hold event (time 0). The time axis is the same for A–F. G, Cluster plot of the number of bins crossing the 2 SD limit for ipsilateral and contralateral trials. Each dot corresponds to a single neuron (gray, UIDs; black, PTNs). The vertical and horizontal dotted lines indicate the minimum number of bins needed before a cell can be judged to have significant modulation with the particular trial. H, Histogram of the number of cells showing modulation with the different trial lateralities. Simply by chance, we would expect a certain number of false positives in each category, and only the Contra. only and Contra. + Ipsi. categories have counts above the number expected by chance. I, Cluster plot of maximal rate modulation during ipsilateral (ordinate axis) and contralateral (abscissa) trials for PTNs and UIDs. The rate modulation is defined as the maximal absolute deviation relative to a baseline epoch. For both PTNs and UIDs during contralateral trials, the majority showed a rate increase; for ipsilateral trials, a higher proportion of cells showed a rate suppression.
These average PETHs are useful as summary measures of the population activity; however, they obscure modulations in firing that differ between cells. When we calculated the size of the modulation for single cells, they were larger than the population modulation shown in Figure 5, A and B. For contralateral trials, the modulations were 62 ± 39 Hz (mean ± SD) for PTNs and 68 ± 52 Hz for UIDs. For ipsilateral trials, the corresponding modulations were 18 ± 10 Hz for PTNs and 24 ± 17 Hz for UIDs. There was no significant difference in modulation between PTNs and UIDs for either trial laterality (unpaired t test, p > 0.2).
To assess the fraction of each cell category that modulated with a given trial type, we counted the number of cells where rate deviated from a pretask baseline period (between 3 and 4 s before End Hold) by more than 2 SDs, in successive 20 ms bins. This is illustrated in Figure 5C–F for PTNs and UIDs and for contralateral and ipsilateral trials. Gray plots illustrate bins with a rate significantly lower than baseline, and black plots illustrate bins with a rate significantly higher than baseline. Fewer cells modulated with ipsilateral than contralateral trials.
For each cell, we counted the number of bins significantly different (by ±2 SD; p < 0.05) from baseline over the 3 s period before End Hold. Since there are 150 bins in this period, we required ≥13 significant bins for the cell to be categorized as significantly modulated (p < 0.05, binomial correction for multiple comparisons). Figure 5G is a cluster plot of the number of significant bins for each trial type for each cell. Figure 5H presents the fraction of the PTNs and UIDs that were significantly modulated by ipsilateral, contralateral, or both trial lateralities. The great majority of cells with an ipsilateral modulation were also modulated by contralateral trials (93% for both PTNs and UIDs).
Figure 5I shows the deviation from baseline firing rate for all cells during ipsilateral and contralateral trials. During this task, the majority of cells (PTN, 92%; UID, 90%) showed an overall increase in rate for contralateral trials (most of the points are to the right side of the abscissa zero line). For ipsilateral trials, however, there was a larger fraction of PTN cells that had a suppression in their activity as their largest response (relative to baseline; PTN, 31% compared with 8% in contralateral trials); the fraction of UID cells that showed a suppression relative to baseline for ipsilateral trials was 25%.
M1 cell firing latency correlation with EMG activity
Although cell responses during ipsilateral trials were weak, they were still significant and present in more than half of the M1 cells recorded. It may be that this activity is used to control the movements of the ipsilateral limb. However, another possibility is that it relates to contralateral movements. Although the noncued hand was required to remain on the home pad during execution of the precision grip task, some weak modulation in the EMG was still seen. Representative data (rectified EMG) from a single muscle (left AbPL) is illustrated in Figure 6A. Although this muscle modulates clearly with left arm trials, there is also a small modulation in activity during trial performance with the right hand (Fig. 6A, gray shading). Figure 6B presents an average of the rectified EMG from this muscle, aligned on the End Hold task marker. There is a robust modulation during left-handed trials (black line) but also a small consistent modulation during right-handed trials (Fig. 6B, gray line; note different scales used for each trace).
Figure 6.

Muscle mirroring. A, Excerpt from a single recording session showing the rectified activity of the left AbPL muscle during ipsilateral and contralateral trials. RF, Right finger lever displacement trace; RTh, right thumb lever displacement trace; LF, left finger lever displacement trace; LTh, left thumb lever displacement trace. Vertical dashed lines indicate the ends of the hold period. The shaded box marks modulation of left muscle activity during a right-handed trial. B, Activity of the left AbPL muscle averaged relative to the End Hold task marker, during ipsilateral (gray) and contralateral (black) trials. There is a weak modulation in activity during ipsilateral trials (note the difference in scale bars between the two trial types).
To determine whether cell firing was likely to relate to contralateral or ipsilateral muscle activity during ipsilateral trials, we took advantage of trial-by-trial fluctuations in the timing of both cell discharge and EMG (Schepens and Drew, 2004). Figure 7 presents an example of the analysis for a single cell. Figure 7A shows the PETH (black) and mean EMG for the contralateral AbPL muscle (gray). Both traces showed a clear peak around the time of the Go Cue, as expected for the fast ballistic movements of reaching out to the manipulandum and squeezing the levers into target. Figure 7B presents five single-trial estimates of these measures. It is apparent that the time of the peak in both cell instantaneous firing rate and rectified EMG amplitude varied from trial to trial. The times of these peaks were measured (Fig. 7B, arrows); Figure 7C shows the correlation between the EMG and cell peak latencies. There was a strong and significant correlation (r2 = 0.69, p < 0.001), which persisted even when the four outlier trials were excluded (Fig. 7C, outside the dotted square). The correlation provides evidence that this cell probably contributes to the control of this muscle.
Figure 7.
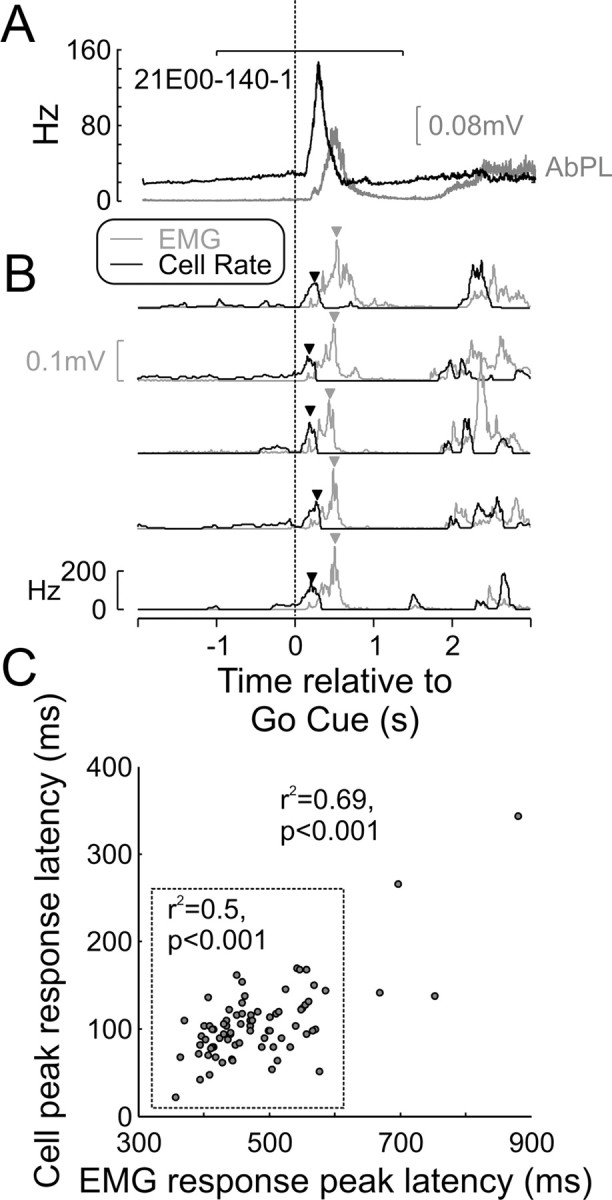
Latency correlation between M1 cell activity and EMG. A, Mean EMG activity of contralateral AbPL (gray line) and PSTH of M1 PTN (black line) aligned to the Go Cue. The horizontal bar at the top indicates the region used to search for the peak in cell and EMG response on a trial-by-trial basis. B, Five example trials showing the cell's instantaneous firing rate (black line) and EMG activity (gray line), with triangles indicating peak response times of both. C, Cluster plot showing good correlation between EMG peak response latency and neuronal peak response latency. When including all trials, the correlation coefficient was 0.69, and when extreme values (data points outside the dotted square) were excluded, this correlation was still highly significant at 0.5.
This analysis was performed for all cells that showed significant rate modulation during ipsilateral trials, for each muscle and laterality of trial. For each cell, we noted the muscle with the largest significant correlation coefficient as the muscle that the cell was best related to. The results across the recorded cell population are illustrated for PTNs (Fig. 8A) and for UIDs (Fig. 8B); black bars correspond to contralateral trials, and gray bars correspond to ipsilateral trials. The upward projecting bars show the mean correlation coefficients for each muscle; the downward going bars show the fraction of cells that had that muscle as the best correlated. For PTNs, 35 of 68 cells showed a significant correlation with muscle during contralateral trials; in contrast, only 4 of 68 showed a significant correlation with muscle during ipsilateral trials. In all cases, however, the best correlated muscle was always contralateral to the recording site. For UIDs, 23 of 56 cells had significant correlation with muscles during contralateral trials; in all cases, the best muscle was contralateral. Only 9 of 56 unidentified cells had significant correlation during ipsilateral trials; of these, in two cases the best muscles were ipsilateral (EDC for one cell and triceps for the other). In both cases, the r2 value was <0.2. Overall, therefore, in cells where we could detect a timing correlation of spiking with muscle during ipsilateral trials, the best related muscle was contralateral to the recording site in 11 of 13 cases.
Figure 8.
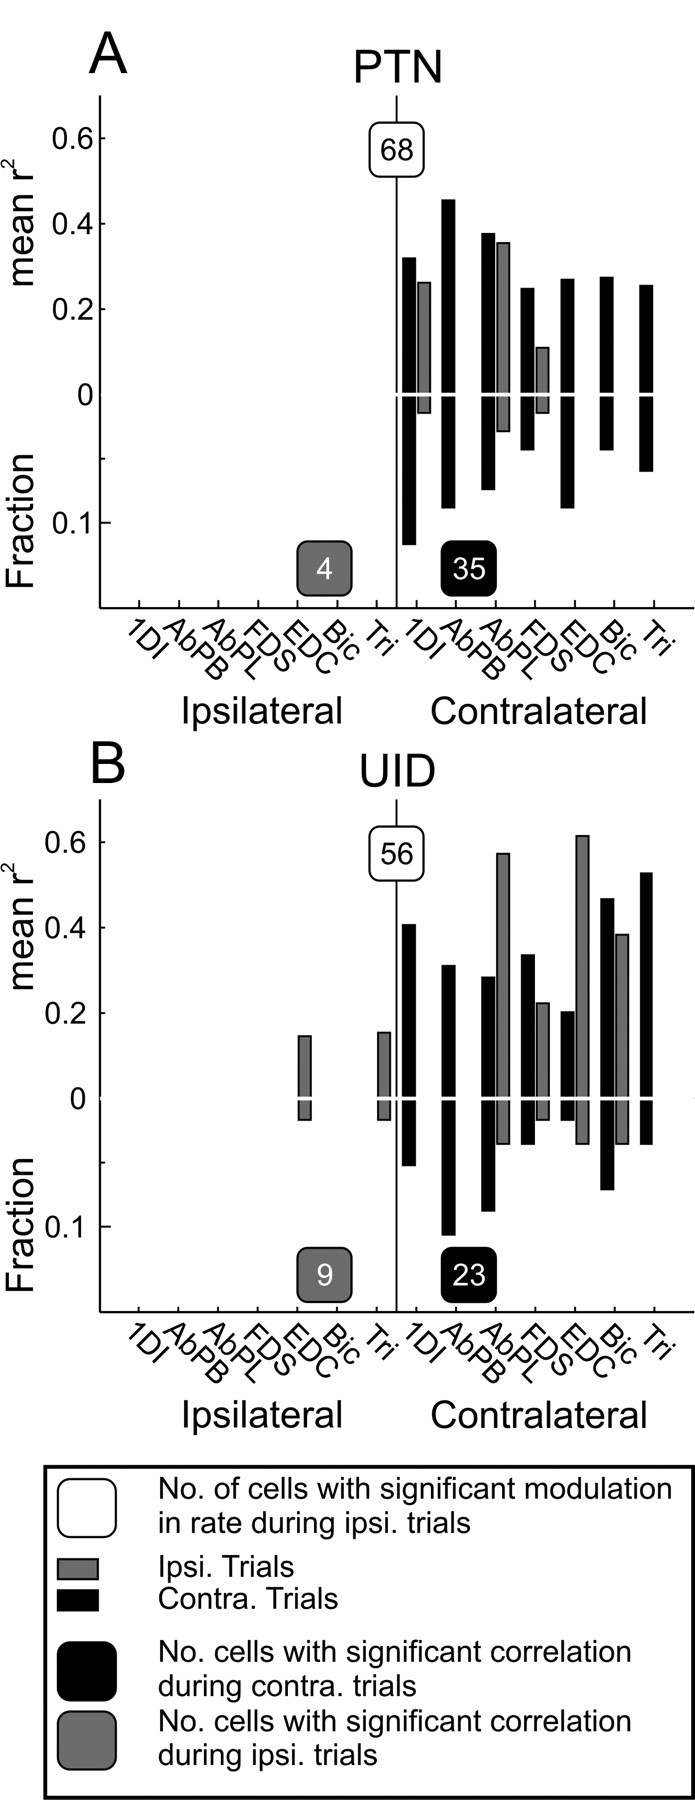
Population results for latency correlation analysis. For this analysis, only cells that showed a significant modulation with ipsilateral trials were considered. In cases in which the cell had a significant correlation with multiple muscles, the one with the strongest correlation was used for this plot. A, Mean peak correlation coefficients per muscle for PTNs showing a significant correlation with EMG. Black bars, Contralateral trials; gray bars, ipsilateral trials. Upward going bars show correlation coefficients, and downward going bars show the proportion of cells with the best correlation with that muscle. For both ipsilateral and contralateral trials, maximal correlations were with contralateral muscles. The numbers in the shaded boxes indicate how many cells showed a significant correlation with EMG during trials of the particular laterality. B, Same as A but for UIDs. Tri, Triceps; Bic, biceps.
Discussion
How supraspinal motor centers communicate with motoneurons constrains how they operate. Here, we assessed the monosynaptic ipsilateral actions of the corticospinal tract and measured M1 neuron activity during behavioral tasks to determine ipsilateral contributions to coordinated hand use and to assess normal connectivity that may be a substrate for recovery of function following lesions. Our data show that M1 activity carried down the corticospinal tract exerts almost exclusively contralateral actions on motoneurons.
Ipsilateral corticospinal connectivity
Several potential routes might allow motor cortex to control the ipsilateral limb. Around 10% of primate corticospinal fibers descend ipsilaterally to the spinal cord, some of which terminate ipsilaterally (Rosenzweig et al., 2009) although many decussate before terminating (Yoshino-Saito et al., 2010). Spinal commissural collaterals can arise from contralaterally descending corticospinal tract fibers (Rosenzweig et al., 2009). Anatomical studies describe ipsilateral corticospinal terminations principally in lamina VIII (Satomi et al., 1988; Rosenzweig et al., 2009; Yoshino-Saito et al., 2010), which contains commissural interneurons. This suggests a role in the control of axial muscles and organizing posture. Ipsilateral terminations outside lamina VIII exist (Lacroix et al., 2004; Rosenzweig et al., 2009) but are sparse (Yoshino-Saito et al., 2010). The single published illustration of ipsilateral corticospinal terminations among motoneurons (Rosenzweig et al., 2009) (Fig. 9) shows terminations in the medial (axial) motoneurons caudal in the T1 segment. Thus, potential anatomical substrates for ipsilateral corticospinal tract actions exist, but their functionality has not been assessed.
We used several complementary methods to assess direct ipsilateral corticospinal influences on hand and arm motoneurons. Intracellular recordings revealed strong monosynaptic input from the contralateral corticospinal tract, but no effects from the ipsilateral tract, even after stimulus trains. The single excitation we detected during lengthy experiments in three animals was a small polysynaptic EPSP (4% of mean monosynaptic EPSP size). Anesthesia will have depressed spinal interneuron activity, so we may have underestimated the frequency of indirect connections. However, as we often observed oligosynaptic IPSPs after cPT stimulation, the level of anesthesia clearly did not completely suppress oligosynaptic effects.
Anesthesia is not a confounding factor in awake monkeys. Results from three different approaches consistently point to the same conclusion. Unilateral stimulation of most corticospinal axons at the brainstem level facilitated contralateral muscles but gave no response or weak, late suppressions in ipsilateral muscles. Such gross activation of the tract is unphysiological, but weak sICMS should activate circuitry with similar functional outputs, yet it too never elicited ipsilateral responses. Finally, spike-triggered averaging provides information on corticospinal connectivity at the single-cell level; again, no monosynaptic ipsilateral effects were detected. Compared with the robust monosynaptic input to motoneurons from the contralateral tract, direct ipsilateral actions appear insignificant.
Our failure to detect facilitation of ipsilateral muscles contrasts markedly with the literature in humans using transcranial magnetic brain stimulation (TMS), which reports ipsilateral effects (Wassermann et al., 1994; Ziemann et al., 1999; Eyre et al., 2001; Chen et al., 2003; MacKinnon et al., 2004). Although it is sometimes assumed that these responses are mediated via the ipsilateral corticospinal tract (Eyre et al., 2001), good evidence implicates other descending pathways e.g., reticulospinal tracts (Ziemann et al., 1999), which connect to hand and forearm muscles in primates (Riddle et al., 2009) and are bilaterally organized (Davidson and Buford, 2006; Davidson et al., 2007). Strong TMS stimuli elicit multiple corticospinal volleys (Edgley et al., 1990) that may be more likely to excite cortico-reticular fibers than weak sICMS. TMS may thus reveal ipsilateral responses via a cortico-reticulospinal route, as proposed for ipsilateral responses generated in cat hindlimb (Jankowska et al., 2005).
The only significant effects of PT stimulation found in ipsilateral muscles were weak suppressions (Fig. 3). These had longer latencies than the facilitations of homologous contralateral muscles, suggesting an indirect pathway. Several possibilities exist. Antidromic activation of corticospinal axon collaterals could lead to suppression in the contralateral hemisphere via a transcallosal route. Whether these collaterals project directly via the corpus callosum is unclear (Catsman-Berrevoets et al., 1980; Matsunami and Hamada, 1984), but even if not, they may still activate transcallosal neurons. Alternatively, reticulospinal axons can both suppress and/or facilitate upper limb muscles (Davidson and Buford, 2006; Schepens and Drew, 2006; Davidson et al., 2007). Ipsilateral corticospinal fibers acting through segmental inhibitory interneurons, or contralateral corticospinal fibers acting via spinal commissural interneurons, provide further alternatives (Jankowska and Stecina, 2007; Stecina and Jankowska, 2007).
Our findings slightly contrast with the report by Aizawa et al. (1990) that trains of microstimuli delivered to a region of M1 lying between the face and hand representations could elicit ipsilateral hand movements. Our study was focused more medially, in the conventional hand representation. Since ipsilateral responses were not seen after PT stimulation, it is likely that, like ipsilateral responses after TMS in humans, the stimulus trains used by Aizawa et al. (1990) generated responses indirectly via callosal or reticulospinal pathways. Similarly, Boudrias et al. (2010) recently reported activation of ipsilateral muscles after sICMS in supplementary motor area (SMA). Since PT stimulation that activates corticospinal axons from all cortical areas does not generate ipsilateral effects, a probable substrate for the responses to SMA stimulation, given their longer latencies than M1-evoked responses, is reticulospinal pathways. These terminate bilaterally in the spinal cord (Peterson et al., 1975; Davidson and Buford, 2006), can access distal muscles (Riddle et al., 2009; Riddle and Baker, 2010), and receive SMA projections (Keizer and Kuypers, 1989).
Modulation of M1 discharge with ipsilateral movement
As in previous reports (Matsunami and Hamada, 1978, 1980, 1981; Tanji et al., 1988; Donchin et al., 1998; Kermadi et al., 1998; Kazennikov et al., 1999; Cisek et al., 2003), we found discharge modulation in M1 neurons during ipsilateral limb movements. This could serve several functions.
One possibility is that ipsilaterally modulated discharge is related to control of the contralateral limb. During unimanual movements, weak muscle activity can occur in the nonmoving hand [mirroring (Armatas et al., 1994; Mayston et al., 1999)]; we also demonstrated activity of this type in our experiments (see also Soteropoulos and Baker, 2008). Most cells in which timing of discharge and ipsilateral EMG correlated were, nevertheless, better correlated with activity in a contralateral muscle, suggesting that mirroring at least partially explains the ipsilateral movement-related modulation. The two neurons (UIDs) that correlated best with an ipsilateral muscle may have correlated better with a contralateral muscle that was not sampled.
Alternatively, the M1 discharge modulation during ipsilateral movements may suppress unwanted movements contralaterally. Corticospinal activity can generate powerful disynaptic inhibition in motoneurons (Jankowska et al., 1976; Kasser and Cheney, 1985). Patients with proprioceptive loss often develop involuntary movements [pseudoathetosis (Spitz et al., 2006)], and mirroring of movements is common (Armatas et al., 1994), especially in children (Mayston et al., 1999), suggesting that preventing limb movement requires active, carefully controlled inhibition. More than 30% of M1 PTNs recorded showed a suppression in activity during ipsilateral movements (Fig. 5I).
When a hand moves, widespread anticipatory postural adjustments are required to maintain posture. These have been studied extensively in cat and shown to involve both the reticular formation and M1 (Schepens and Drew, 2006; Yakovenko and Drew, 2009). These postural adjustments are tailored to the situation; during our recordings, seated with the head fixed, they might be expected to be small. Nevertheless, ipsilateral limb movement-related activity may contribute to postural adjustments.
A component of M1 cell discharge during ipsilateral movements may reflect ipsilateral limb control. Although unlikely to exert effects on motoneurons via the ipsilateral corticospinal tract, subtle modulation of spinal interneuron circuits or brainstem pathways is a possibility. It is important to emphasize the likely relative importance of ipsilateral and contralateral M1. Modulation across the population of M1 cells was very small during ipsilateral compared with contralateral movements (Fig. 4A,B). For the reach-to-grip movements studied here, ipsilateral M1 is likely to contribute minimally, although we cannot rule out a significant role in more proximal movements (Brinkman and Kuypers, 1973).
Implications for recovery from lesion
Our data suggest that ipsilateral corticospinal axons are unlikely to play an important role in mediating the motor command to hand and wrist motoneurons in healthy adult primates. However, during recovery from corticospinal lesion, ipsilateral M1 activity can play an important role (Marshall et al., 2000; Feydy et al., 2002; Nishimura et al., 2007), although this is not always the case (Liu and Rouiller, 1999; Feydy et al., 2002). Recent evidence implicates substantial sprouting of surviving decussating corticospinal axons, both from ipsilateral and contralateral cortex, in functional recovery after spinal hemisections in primates (Rosenzweig et al., 2010). Our data suggest that if direct connections to motoneurons from ipsilateral corticospinal axons contribute to recovery of hand and arm movement after damage, this must occur through the formation of new connections, since we find no preexisting connections in normal animals. Our own preliminary work suggests that changes in brainstem pathways are important in recovery (Zaaimi et al., 2009), as proposed by Jankowska and Edgley (2006). Better understanding the limitations on the role of ipsilateral pathways in health may enable more rational therapeutic approaches to enhancing their actions during functional recovery.
Footnotes
This work was supported by the Wellcome Trust and the Biotechnology and Biological Sciences Research Council. We thank Shelley Rhodes and Rosie Pyper for assistance with animal training, Paul Flecknell and Silke Corbach-Soehle for veterinary anesthesia, and Caroline Fox for theater support.
References
- Aizawa H, Mushiake H, Inase M, Tanji J. An output zone of the monkey primary motor cortex specialized for bilateral hand movement. Exp Brain Res. 1990;82:219–221. doi: 10.1007/BF00230856. [DOI] [PubMed] [Google Scholar]
- Armatas CA, Summers JJ, Bradshaw JL. Mirror movements in normal adult subjects. J Clin Exp Neuropsychol. 1994;16:405–413. doi: 10.1080/01688639408402651. [DOI] [PubMed] [Google Scholar]
- Baker SN, Lemon RN. A computer simulation study of the production of post-spike facilitation in spike triggered averages of rectified EMG. J Neurophysiol. 1998;80:1391–1406. doi: 10.1152/jn.1998.80.3.1391. [DOI] [PubMed] [Google Scholar]
- Baker SN, Lemon RN. Precise spatiotemporal repeating patterns in monkey primary and supplementary motor areas occur at chance levels. J Neurophysiol. 2000;84:1770–1780. doi: 10.1152/jn.2000.84.4.1770. [DOI] [PubMed] [Google Scholar]
- Baker SN, Olivier E, Lemon RN. An investigation of the intrinsic circuitry of the motor cortex of the monkey using intra-cortical microstimulation. Exp Brain Res. 1998;123:397–411. doi: 10.1007/s002210050585. [DOI] [PubMed] [Google Scholar]
- Baker SN, Philbin N, Spinks R, Pinches EM, Wolpert DM, MacManus DG, Pauluis Q, Lemon RN. Multiple single unit recording in the cortex of monkeys using independently moveable microelectrodes. J Neurosci Methods. 1999;94:5–17. doi: 10.1016/s0165-0270(99)00121-1. [DOI] [PubMed] [Google Scholar]
- Boudrias MH, Lee SP, Svojanovsky S, Cheney PD. Forelimb muscle representations and output properties of motor areas in the mesial wall of rhesus macaques. Cereb Cortex. 2010;20:704–719. doi: 10.1093/cercor/bhp136. [DOI] [PMC free article] [PubMed] [Google Scholar]
- Brinkman J, Kuypers HGJM. Cerebral control of contralateral and ipsilateral arm, hand and finger movements in the split-brain rhesus monkey. Brain. 1973;96:653–674. doi: 10.1093/brain/96.4.653. [DOI] [PubMed] [Google Scholar]
- Brus-Ramer M, Carmel JB, Chakrabarty S, Martin JH. Electrical stimulation of spared corticospinal axons augments connections with ipsilateral spinal motor circuits after injury. J Neurosci. 2007;27:13793–13801. doi: 10.1523/JNEUROSCI.3489-07.2007. [DOI] [PMC free article] [PubMed] [Google Scholar]
- Catsman-Berrevoets CE, Lemon RN, Verburgh CA, Bentivoglio M, Kuypers HG. Absence of callosal collaterals derived from rat corticospinal neurons. A study using fluorescent retrograde tracing and electrophysiological techniques. Exp Brain Res. 1980;39:433–440. doi: 10.1007/BF00239308. [DOI] [PubMed] [Google Scholar]
- Chen R, Yung D, Li JY. Organization of ipsilateral excitatory and inhibitory pathways in the human motor cortex. J Neurophysiol. 2003;89:1256–1264. doi: 10.1152/jn.00950.2002. [DOI] [PubMed] [Google Scholar]
- Cisek P, Crammond DJ, Kalaska JF. Neural activity in primary motor and dorsal premotor cortex in reaching tasks with the contralateral versus ipsilateral arm. J Neurophysiol. 2003;89:922–942. doi: 10.1152/jn.00607.2002. [DOI] [PubMed] [Google Scholar]
- Davidson AG, Buford JA. Bilateral actions of the reticulospinal tract on arm and shoulder muscles in the monkey: stimulus triggered averaging. Exp Brain Res. 2006;173:25–39. doi: 10.1007/s00221-006-0374-1. [DOI] [PubMed] [Google Scholar]
- Davidson AG, Schieber MH, Buford JA. Bilateral spike-triggered average effects in arm and shoulder muscles from the monkey pontomedullary reticular formation. J Neurosci. 2007;27:8053–8058. doi: 10.1523/JNEUROSCI.0040-07.2007. [DOI] [PMC free article] [PubMed] [Google Scholar]
- Donchin O, Gribova A, Steinberg O, Bergman H, Vaadia E. Primary motor cortex is involved in bimanual coordination. Nature. 1998;395:274–278. doi: 10.1038/26220. [DOI] [PubMed] [Google Scholar]
- Dum RP, Strick PL. The origin of corticospinal projections from the premotor areas in the frontal lobe. J Neurosci. 1991;11:667–689. doi: 10.1523/JNEUROSCI.11-03-00667.1991. [DOI] [PMC free article] [PubMed] [Google Scholar]
- Dyball R, Bhumbra G. Digital spike discrimination combining size and shape elements. J Physiol. 2003;547P:D9. [Google Scholar]
- Edgley SA, Eyre JA, Lemon RN, Miller S. Excitation of the corticospinal tract by electromagnetic and electrical stimulation of the scalp in the macaque monkey. J Physiol. 1990;425:301–320. doi: 10.1113/jphysiol.1990.sp018104. [DOI] [PMC free article] [PubMed] [Google Scholar]
- Eyre JA, Taylor JP, Villagra F, Smith M, Miller S. Evidence of activity-dependent withdrawal of corticospinal projections during human development. Neurology. 2001;57:1543–1554. doi: 10.1212/wnl.57.9.1543. [DOI] [PubMed] [Google Scholar]
- Fetz EE, Cheney PD. Postspike facilitation of forelimb muscle activity by primate corticomotoneuronal cells. J Neurophysiol. 1980;44:751–772. doi: 10.1152/jn.1980.44.4.751. [DOI] [PubMed] [Google Scholar]
- Feydy A, Carlier R, Roby-Brami A, Bussel B, Cazalis F, Pierot L, Burnod Y, Maier MA. Longitudinal study of motor recovery after stroke: recruitment and focusing of brain activation. Stroke. 2002;33:1610–1617. doi: 10.1161/01.str.0000017100.68294.52. [DOI] [PubMed] [Google Scholar]
- Jankowska E, Edgley SA. How can corticospinal tract neurons contribute to ipsilateral movements? A question with implications for recovery of motor functions. Neuroscientist. 2006;12:67–79. doi: 10.1177/1073858405283392. [DOI] [PMC free article] [PubMed] [Google Scholar]
- Jankowska E, Stecina K. Uncrossed actions of feline corticospinal tract neurones on lumbar interneurones evoked via ipsilaterally descending pathways. J Physiol. 2007;580:133–147. doi: 10.1113/jphysiol.2006.122739. [DOI] [PMC free article] [PubMed] [Google Scholar]
- Jankowska E, Padel Y, Tanaka R. Disynaptic inhibition of spinal motoneurones from the motor cortex in the monkey. J Physiol. 1976;258:467–487. doi: 10.1113/jphysiol.1976.sp011431. [DOI] [PMC free article] [PubMed] [Google Scholar]
- Jankowska E, Hammar I, Slawinska U, Maleszak K, Edgley SA. Neuronal basis of crossed actions from the reticular formation on feline hindlimb motoneurons. J Neurosci. 2003;23:1867–1878. doi: 10.1523/JNEUROSCI.23-05-01867.2003. [DOI] [PMC free article] [PubMed] [Google Scholar]
- Jankowska E, Cabaj A, Pettersson LG. How to enhance ipsilateral actions of pyramidal tract neurons. J Neurosci. 2005;25:7401–7405. doi: 10.1523/JNEUROSCI.1838-05.2005. [DOI] [PMC free article] [PubMed] [Google Scholar]
- Kasser RJ, Cheney PD. Characteristics of corticomotoneuronal post-spike facilitation and reciprocal suppression of EMG activity in the monkey. J Neurophysiol. 1985;53:959–978. doi: 10.1152/jn.1985.53.4.959. [DOI] [PubMed] [Google Scholar]
- Kazennikov O, Hyland B, Corboz M, Babalian A, Rouiller EM, Wiesendanger M. Neural activity of supplementary and primary motor areas in monkeys and its relation to bimanual and unimanual movement sequences. Neuroscience. 1999;89:661–674. doi: 10.1016/s0306-4522(98)00348-0. [DOI] [PubMed] [Google Scholar]
- Keizer K, Kuypers HGJM. Distribution of corticospinal neurons with collaterals to the lower brain stem reticular formation in monkey (Macaca fascicularis) Exp Brain Res. 1989;74:311–318. doi: 10.1007/BF00248864. [DOI] [PubMed] [Google Scholar]
- Kermadi I, Liu Y, Tempini A, Calciati E, Rouiller EM. Neuronal activity in the primate supplementary motor area and the primary motor cortex in relation to spatio-temporal bimanual coordination. Somatosens Mot Res. 1998;15:287–308. doi: 10.1080/08990229870709. [DOI] [PubMed] [Google Scholar]
- Kilner JM, Salenius S, Baker SN, Jackson A, Hari R, Lemon RN. Task-dependent modulations of cortical oscillatory activity in human subjects during a bimanual precision grip task. Neuroimage. 2003;18:67–73. doi: 10.1006/nimg.2002.1322. [DOI] [PubMed] [Google Scholar]
- Kuypers HGJM, editor. Bethesda, MD: American Physiological Society; 1981. Anatomy of the descending pathways. [Google Scholar]
- Lacroix S, Havton LA, McKay H, Yang H, Brant A, Roberts J, Tuszynski MH. Bilateral corticospinal projections arise from each motor cortex in the macaque monkey: a quantitative study. J Comp Neurol. 2004;473:147–161. doi: 10.1002/cne.20051. [DOI] [PubMed] [Google Scholar]
- Lemon RN, editor. London: Wiley; 1984. Methods for neuronal recording in conscious animals. [Google Scholar]
- Lemon RN, Mantel GW, Muir RB. Corticospinal facilitation of hand muscles during voluntary movement in the conscious monkey. J Physiol. 1986;381:497–527. doi: 10.1113/jphysiol.1986.sp016341. [DOI] [PMC free article] [PubMed] [Google Scholar]
- Liu Y, Rouiller EM. Mechanisms of recovery of dexterity following unilateral lesion of the sensorimotor cortex in adult monkeys. Exp Brain Res. 1999;128:149–159. doi: 10.1007/s002210050830. [DOI] [PubMed] [Google Scholar]
- MacKinnon CD, Quartarone A, Rothwell JC. Inter-hemispheric asymmetry of ipsilateral corticofugal projections to proximal muscles in humans. Exp Brain Res. 2004;157:225–233. doi: 10.1007/s00221-004-1836-y. [DOI] [PubMed] [Google Scholar]
- Marshall RS, Perera GM, Lazar RM, Krakauer JW, Constantine RC, DeLaPaz RL. Evolution of cortical activation during recovery from corticospinal tract infarction. Stroke. 2000;31:656–661. doi: 10.1161/01.str.31.3.656. [DOI] [PubMed] [Google Scholar]
- Matsunami K, Hamada I. Precentral neuron activity associated with ipsilateral forelimb movements in monkeys. J Physiol. 1978;74:319–322. [PubMed] [Google Scholar]
- Matsunami K, Hamada I. Antidromic latency of the monkey pyramidal tract neuron related to ipsilateral hand movements. Neurosci Lett. 1980;16:245–249. doi: 10.1016/0304-3940(80)90005-1. [DOI] [PubMed] [Google Scholar]
- Matsunami K, Hamada I. Characteristics of the ipsilateral movement-related neuron in the motor cortex of the monkey. Brain Res. 1981;204:29–42. doi: 10.1016/0006-8993(81)90649-1. [DOI] [PubMed] [Google Scholar]
- Matsunami K, Hamada I. Effects of stimulation of corpus callosum on precentral neuron activity in the awake monkey. J Neurophysiol. 1984;52:676–691. doi: 10.1152/jn.1984.52.4.676. [DOI] [PubMed] [Google Scholar]
- Mayston MJ, Harrison LM, Stephens JA. A neurophysiological study of mirror movements in adults and children. Ann Neurol. 1999;45:583–594. doi: 10.1002/1531-8249(199905)45:5<583::aid-ana6>3.0.co;2-w. [DOI] [PubMed] [Google Scholar]
- Miller LE, Van Kan PLE, Sinkjaer T, Andersen T, Harris GD, Houk JC. Correlation of primate red nucleus discharge with muscle activity during free-form arm movements. J Physiol. 1993;469:213–243. doi: 10.1113/jphysiol.1993.sp019812. [DOI] [PMC free article] [PubMed] [Google Scholar]
- Murthy VN, Fetz EE. Oscillatory activity in sensorimotor cortex of awake monkeys: synchronization of local field potentials and relation to behavior. J Neurophysiol. 1996a;76:3949–3967. doi: 10.1152/jn.1996.76.6.3949. [DOI] [PubMed] [Google Scholar]
- Murthy VN, Fetz EE. Sychronization of neurons during local field potential oscillations in sensorimotor cortex of awake monkeys. J Neurophysiol. 1996b;76:3968–3982. doi: 10.1152/jn.1996.76.6.3968. [DOI] [PubMed] [Google Scholar]
- Nawrot M, Aertsen A, Rotter S. Single-trial estimation of neuronal firing rates: from single-neuron spike trains to population activity. J Neurosci Methods. 2000;94:81–92. doi: 10.1016/s0165-0270(99)00127-2. [DOI] [PubMed] [Google Scholar]
- Nishimura Y, Onoe H, Morichika Y, Perfiliev S, Tsukada H, Isa T. Time-dependent central compensatory mechanisms of finger dexterity after spinal cord injury. Science. 2007;318:1150–1155. doi: 10.1126/science.1147243. [DOI] [PubMed] [Google Scholar]
- Peterson BW, Maunz RA, Pitts NG, Mackel RG. Patterns of projection and braching of reticulospinal neurons. Exp Brain Res. 1975;23:333–351. doi: 10.1007/BF00238019. [DOI] [PubMed] [Google Scholar]
- Riddle CN, Baker SN. Convergence of pyramidal and medial brain stem descending pathways onto macaque cervical spinal interneurons. J Neurophysiol. 2010;103:2821–2832. doi: 10.1152/jn.00491.2009. [DOI] [PMC free article] [PubMed] [Google Scholar]
- Riddle CN, Edgley SA, Baker SN. Direct and indirect connections with upper limb motoneurons from the primate reticulospinal tract. J Neurosci. 2009;29:4993–4999. doi: 10.1523/JNEUROSCI.3720-08.2009. [DOI] [PMC free article] [PubMed] [Google Scholar]
- Rosenzweig ES, Brock JH, Culbertson MD, Lu P, Moseanko R, Edgerton VR, Havton LA, Tuszynski MH. Extensive spinal decussation and bilateral termination of cervical corticospinal projections in rhesus monkeys. J Comp Neurol. 2009;513:151–163. doi: 10.1002/cne.21940. [DOI] [PMC free article] [PubMed] [Google Scholar]
- Rosenzweig ES, Courtine G, Jindrich DL, Brock JH, Ferguson AR, Strand SC, Nout YS, Roy RR, Miller DM, Beattie MS, Havton LA, Bresnahan JC, Edgerton VR, Tuszynski MH. Extensive spontaneous plasticity of corticospinal projections after primate spinal cord injury. Nat Neurosci. 2010;13:1505–1510. doi: 10.1038/nn.2691. [DOI] [PMC free article] [PubMed] [Google Scholar]
- Satomi H, Takahashi K, Aoki M, Kosaka I. Anatomical evidence for the re-crossing of lateral corticospinal fibers via the posterior gray commissure in the cat spinal cord. Neurosci Lett. 1988;88:157–160. doi: 10.1016/0304-3940(88)90118-8. [DOI] [PubMed] [Google Scholar]
- Schepens B, Drew T. Independent and convergent signals from the pontomedullary reticular formation contribute to the control of posture and movement during reaching in the cat. J Neurophysiol. 2004;92:2217–2238. doi: 10.1152/jn.01189.2003. [DOI] [PubMed] [Google Scholar]
- Schepens B, Drew T. Descending signals from the pontomedullary reticular formation are bilateral, asymmetric, and gated during reaching movements in the cat. J Neurophysiol. 2006;96:2229–2252. doi: 10.1152/jn.00342.2006. [DOI] [PubMed] [Google Scholar]
- Soteropoulos DS, Baker SN. Cortico-cerebellar coherence during a precision grip task in the monkey. J Neurophysiol. 2006;95:1194–1206. doi: 10.1152/jn.00935.2005. [DOI] [PubMed] [Google Scholar]
- Soteropoulos DS, Baker SN. Bilateral representation in the deep cerebellar nuclei. J Physiol. 2008;586:1117–1136. doi: 10.1113/jphysiol.2007.144220. [DOI] [PMC free article] [PubMed] [Google Scholar]
- Spitz M, Costa Machado AA, Carvalho Rdo C, Maia FM, Haddad MS, Calegaro D, Scaff M, Reis Barbosa E. Pseudoathetosis: report of three patients. Mov Disord. 2006;21:1520–1522. doi: 10.1002/mds.21014. [DOI] [PubMed] [Google Scholar]
- Stecina K, Jankowska E. Uncrossed actions of feline corticospinal tract neurones on hindlimb motoneurones evoked via ipsilaterally descending pathways. J Physiol. 2007;580:119–132. doi: 10.1113/jphysiol.2006.122721. [DOI] [PMC free article] [PubMed] [Google Scholar]
- Tanji J, Okano K, Sato KC. Neuronal activity in cortical motor areas related to ipsilateral, contralateral, and bilateral digit movements of the monkey. J Neurophysiol. 1988;60:325–343. doi: 10.1152/jn.1988.60.1.325. [DOI] [PubMed] [Google Scholar]
- Wassermann EM, Pascual-Leone A, Hallett M. Cortical motor representation of the ipsilateral hand and arm. Exp Brain Res. 1994;100:121–132. doi: 10.1007/BF00227284. [DOI] [PubMed] [Google Scholar]
- Williams ER, Soteropoulos DS, Baker SN. Coherence between motor cortical activity and peripheral discontinuities during slow finger movements. J Neurophysiol. 2009;102:1296–1309. doi: 10.1152/jn.90996.2008. [DOI] [PMC free article] [PubMed] [Google Scholar]
- Yakovenko S, Drew T. A motor cortical contribution to the anticipatory postural adjustments that precede reaching in the cat. J Neurophysiol. 2009;102:853–874. doi: 10.1152/jn.00042.2009. [DOI] [PubMed] [Google Scholar]
- Yoshino-Saito K, Nishimura Y, Oishi T, Isa T. Quantitative inter-segmental and inter-laminar comparison of corticospinal projections from the forelimb area of the primary motor cortex of macaque monkeys. Neuroscience. 2010;171:1164–1179. doi: 10.1016/j.neuroscience.2010.10.007. [DOI] [PubMed] [Google Scholar]
- Zaaimi B, Edgley SA, Baker SN. Reticulospinal and ipsilateral corticospinal tract contributions to functional recovery after unilateral corticospinal lesion. Soc Neurosci Abstr. 2009;35:568–529. [Google Scholar]
- Ziemann U, Ishii K, Borgheresi A, Yaseen Z, Battaglia F, Hallett M, Cincotta M, Wassermann EM. Dissociation of the pathways mediating ipsilateral and contralateral motor-evoked potentials in human hand and arm muscles. J Physiol. 1999;518:895–906. doi: 10.1111/j.1469-7793.1999.0895p.x. [DOI] [PMC free article] [PubMed] [Google Scholar]