

SUMMARY
Recent studies demonstrate that mosquitoes listen to each other's wing beats just prior to mating in flight. Field potentials from sound-transducing neurons in the antennae contain both sustained and oscillatory components to pure and paired tone stimuli. Described here is a direct comparison of these two types of response in the dengue vector mosquito, Aedes aegypti. Across a wide range of frequencies and intensities, sustained responses to one- and two-tone stimuli are about equal in magnitude to oscillatory responses to the beats produced by two-tone stimuli. All of these responses are much larger than the oscillatory responses to one-tone stimuli. Similarly, the frequency range extends up to at least the fifth harmonic of the male flight tone for sustained responses to one- and two-tone stimuli and oscillatory responses at the beat frequency of two-tone stimuli, whereas the range of oscillatory response to a one-tone stimulus is limited to, at most, the third harmonic. Thresholds near the fundamental of the flight tone are lower for oscillatory responses than for sustained deflections, lower for males than for females, and within the behaviorally relevant range. A simple model of the transduction process can qualitatively account for both oscillatory and sustained responses to pure and paired tones. These data leave open the question as to which of several alternative strategies underlie flight tone matching behavior in mosquitoes.
KEY WORDS: sound recognition, efference copy, frequency tuning, rate and time coding
INTRODUCTION
Many comparative studies of hearing only consider cases in which the receiving animal is silent, but communication is a two-way street, so to speak, and receivers need to be senders at times as well. One way to avoid acoustic interference in these interactions is to engage in antiphony, such as is common in polite human conversation and in duets among many other species including insects (Bailey, 2003), frogs (Narins, 1995) and birds (Thorpe, 1973). Alternatively, it is common for different species to segregate their signals into different frequencies, much as TV and radio stations broadcast on different channels. By contrast, recent studies indicate that mosquitoes communicate with each other during flight by modulating the continuous tone that their wing beats produce (Gibson and Russell, 2006; Cator et al., 2009; Warren et al., 2009). They are, hence, simultaneously listening and speaking to each other at similar frequencies, and so are confronted with potentially problematic interference.
Many species of mosquitoes mate in aerial swarms (reviewed by Clements, 1992). Males swarm around or near objects, such as visual landmarks or for some species, a living host, awaiting the arrival of females. As a female enters the swarm, males find her by the sound of her wings. When a male and female are within a few centimeters of one another, they may match their wing beat frequencies. In Toxorhynchites brevipalpis, this matching occurs at the fundamental wing beat frequency (Gibson and Russell, 2006). In Aedes aegypti, the dengue fever vector, and Culex quinquefasciatus, another important arbovirus vector, the wing beat frequency differs enough between the sexes that matching instead occurs at higher harmonics of the flight tone (Cator et al., 2009; Warren et al., 2009). Frequency matching may be a form of communication indicating sexual receptivity or fitness. It may also be easier to coordinate coupled flight if the pair beat their wings at harmonically related frequencies.
The question then arises as to how, in the presence of interference from its own wing beats, a mosquito perceives whether a conspecific is beating its wings faster or slower. At the base of the antenna is Johnston's organ, which houses the sensory transducers that convert sound-induced antennal vibration into electrical signals (Johnston, 1855; Roth, 1948). It has long been known that the primary afferents therein are sensitive to pure tones near the fundamental frequency of the wing beats, with gross-evoked field potentials oscillating at twice the stimulus frequency (e.g. Tischner, 1953; Wishart et al., 1962; Belton, 1974; Göpfert and Robert, 2000; Jackson et al., 2009). Oscillations are not observed at stimulus frequencies corresponding to the higher harmonics of the flight tone, however, and so cannot underlie matching behavior in Ae. aegypti and C. quinquefasciatus. Concurrent with oscillations, Cator et al. (Cator et al., 2009) found a sustained deflection in the evoked field potential of Ae. aegypti that extended to frequencies including the harmonics, while Warren et al. (Warren et al., 2009), presenting two high-frequency tones simultaneously to C. quinquefasciatus, observed oscillations at the frequency corresponding to the difference between the two stimulus frequencies. Data are presented here that directly compare these two newly described responses in Ae. aegypti. A single physiological mechanism is proposed that can account for both forms, and a comparison is made between their ability to account for the flight tone matching behavior.
MATERIALS AND METHODS
Mosquitoes
A colony of Ae. aegypti was initiated with field-collected eggs from Rio Florido, Mexico and maintained in an environmental chamber at Cornell University on a 14 h:10 h light:dark cycle with 2 h of twilight, 75±7% relative humidity, and a 22−30°C fluctuating temperature, simulating natural conditions. Eggs were hatched simultaneously in water under a vacuum. Larvae were fed a diet of 1:1 lactalbumin and brewer's yeast. Pupae were individually distributed into vials to obtain adult virgin mosquitoes upon eclosion. Adults were grouped by sex and age in 0.5 l cartons with mesh lids and offered a 20% sucrose solution.
Physiology
Two- to 11-day old mosquitoes were tethered with paraffin wax to a 0.66 mm stainless steel wire and positioned on an air table such that one antenna was parallel to the wavefront generated by a magnetically shielded speaker (F6 HiVi, Swan Speakers, Pasadena, CA, USA). Parylene-insulated electrolytically sharpened tungsten electrodes (Z=1.0 MΩ at 1 kHz; WE10011.0F5; MicroProbe Inc., Gaithersburg, MD, USA) (Hubel, 1957) were inserted from a ventrolateral approach into the right Johnston's organ on the side opposite the speaker. The legs were removed to reduce movement artifacts and a reference electrode was placed in the thorax through one of the coxae. The resulting electric signal was amplified (model 1800, A-M Systems, Carlsborg, WA, USA) and digitized for subsequent computer analysis. Filters on the amplifier were set to pass 0.1<10,000 Hz to permit recording of sustained deflections as well as periodic oscillations (Fig. 1A).
Fig. 1.

(A) The response of the amplifier alone (green) to a negative square pulse with no carrier (black). The neural response (blue) to a 500 Hz carrier modulated by the same square pulse is provided for comparison. Both the amplifier and neural recording decay with a time constant of ~1.6 s because of a 0.1 Hz high-pass filter in the amplifier. (B) Control recordings in the head capsule, both without (upper) and with (lower) a second electrode in the ipsilateral Johnston's organ. The contralateral Johnston's organ was removed. Shown below in black is the 250+290 Hz, 110 dB stimulus. (C) Distortion products (green) in the stimulus delivery system generated by playing 500 and 540 Hz simultaneously at 110 dB, overlaid with the distortion generated by the same tones presented separately (red and blue). The noise floor is in black. (D) Intensity tuning curves averaged (±s.e.m.) over nine females showing the threshold at which the sustained deflection (SD, closed squares) and periodic oscillation (F0, open circles) components of the response to tones at 40 Hz exceed pre-stimulus background noise (dashed line at zero). (E) The magnitude (closed circles) and phase (open circles) response of the pressure-gradient microphone used to calibrate the speaker.
Two sets of control experiments were performed to ensure the observed responses were not artifactual. Immediately following each recording from Johnston's organ, the same electrode was placed in the thorax. The stimulus protocol was then repeated to quantify the degree to which the speaker and its amplifier had been adequately shielded and grounded that day. In a separate set of three flies, recordings were performed in the head capsule, both with and without a second electrode inserted into the ipsilateral Johnston's organ and with the contralateral antenna removed. A small but reliable response to sound was observed in the head due to passive propagation from Johnston's organ, as Tischner (Tischner, 1953) and Wishart et al. (Wishart et al., 1962) also observed. Placing the electrode in Johnston's organ had no qualitative effect: responses exhibited sustained deflections and periodic oscillations at the stimulus and beat frequencies with or without it (Fig. 1B). Recordings from the head were much smaller than those in Johnston's organ, and the insertion of the electrode into Johnston's organ made them only slightly smaller. This corroborates unpublished data that two electrodes in a single Johnston's organ does not perturb the motion of the antenna (Belton, 1989).
Stimuli
Acoustic stimuli were presented once every 5 s and consisted of digitally synthesized cosine-enveloped one- or two-tone bursts of 0.5 s duration and variable frequency and intensity. Stereo signals were routed separately through two variable attenuators, combined with a signal summer, and fed through one channel of an amplifier to the speaker (RP2.1, PA5, SM5, Tucker Davis Tech., Alachua, FL, USA; NA-790, Nikko). To limit recording time to less than 60 min, only two of the following five different protocols were performed on each individual: (1) a trio of intensity tuning curves, in which 40, 80 and 160 Hz were played separately at 10 intensities ranging from 20 to 110 dB SPVL [sound particle velocity level, re. 49 nm s−1; equivalent to 0.49 μms−1 to 15.5 mm s−1 (Bennet-Clark, 1971)] in 10dB steps; (2) a pair of frequency tuning curves, in which 110dB tones at 12 frequencies ranging from 250 to 3175Hz in one-third-octave steps were played both separately and together with a second tone 40 Hz higher; (3) another pair of frequency tuning curves, in which 505, 510, 520, 540, 580 and 660Hz tones at 90 dB were played both separately and along with a second tone of 500 Hz; (4) a pair of intensity tuning curves, in which 500 and 540 Hz were played both separately and together at 10 intensities ranging from 20 to 110 dB in 10 dB steps; and (5) a set of envelope-modulated stimuli, in which 2-s tones of 500 Hz carrier frequency and 90 dB intensity were modulated with either square, triangle or sine waves of variable duty cycle and a 4 Hz frequency. For each protocol, all trials were interleaved in a pseudo-random fashion and repeated 5<20 times, with more repetitions devoted to higher frequencies and lower intensities where the neural response was smaller. The choices of 500 Hz and 110 dB were made because the larger responses there required fewer repetitions; frequency and intensity tuning curves show that observed results generalize to broad stimulus combinations.
Analysis
Intertrial variability within an individual due to movement artifacts was reduced by taking Winsorized means (Dixon, 1960) across multiple repetitions of the same stimulus. Signal averaging permits observation of periodic oscillations and sustained deflections even when responses are small. Sustained deflections of the neural responses were then quantified by low-pass filtering each trial(3-Hz 2-pole Butterworth) and taking the most negative value during the stimulus. The amplitudes of the neural response at the fundamental frequency of the stimulus (F0), its harmonics (F1–5), and at the beat frequency for two-tone stimuli (B0) and its harmonics (B1–5), were calculated by fitting sine waves to the response during the stimulus. For both of these measurements, the same calculations were done on a background period of equal duration immediately preceding the stimulus and the result subtracted from that calculated during the stimulus. These differences were then log-transformed using an inverse hyperbolic sine function {y=log10[0.5x+sqrt(0.25x2+1)]} (reviewed by Bagwell, 2005). Frequency ranges and thresholds were then quantified for each individual and means and standard errors of these metrics as well as whole tuning curves were computed by pooling across the population. An identical analysis was performed on thoracic control recordings to assess the level of spurious signal due to contamination directly from the sound delivery system. A response was deemed to have occurred if it was greater than the pre-stimulus and thoracic-control recordings.
Calibration
The intensity of stimuli was measured in situ prior to the recording sessions using a miniature pressure-gradient microphone (NR-23158, Knowles, Itasca, IL, USA) connected to a custom-built amplifier (non-integrating, 3Hz high-pass, 1–1000× gain, INA121; Burr-Brown, Tucson, AZ, USA). The microphone aperture was positioned where the mosquito would be during an actual recording and oriented to be parallel to the wavefront emanating from the 30-cm distant speaker. All four walls, the ceiling, and part of the floor of the 60 cm×70 cm×100 cm Faraday cage atop the air table were covered with sound-absorbing foam to reduce echoes [4″ (~10 cm) Sonex classic, Pinta Acoustic Inc., Minneapolis, MN, USA]. Tones of different frequencies and intensities were played via computer control to gauge the sensitivity of the speaker and its dynamic range.
The distortion present in the sound delivery system was quantified by presenting two tones simultaneously and measuring the power present at the sum and difference frequencies (Fig. 1C). For 500 and 540 Hz at 110 dB, the distortion at the beat frequency (40 Hz) was −63 dB; for 2000 and 2040 Hz at 110 dB, it was −57 dB; and for 500 and 540 Hz at 90 dB, it was −68 dB. These data were then compared with neural threshold tuning data (Fig. 1D) to determine the maximum stimulus intensities for which distortion would not perturb the results. For females the amplitude threshold at 40 Hz is 70±5 dB for the sustained deflection component of the response and 61±6 dB for the fundamental of the periodic oscillation (N=9). At this frequency males have higher thresholds in each case (data not shown). Given these data, stimulus intensities were limited to 110dB, with most data taken at a more conservative level of 90 dB.
The sensitivity of the pressure-gradient microphone and its amplifier (see above) to particle velocity was determined by comparing their response to that of a calibrated pressure microphone [4135 1/4″ (~6 mm) microphone, 5935 amplifier, 4220 piston phone; Brüel & Kjær, Denmark] in the acoustic far field (Fig. 1E). The two microphones were placed closely juxtaposed about 1.5 m above the ground in an open grassy field. A speaker was placed at distances of 1, 3 and 10 m from the microphones and a range of frequencies and intensities was played. All electronics were run off a DC-to-AC inverter connected to the battery of an idling automobile 40 m distant. The output of the pressure microphone was converted to particle velocity by dividing by its known sensitivity and the density of air and speed of sound for the meteorological conditions at the time. This value was used to regress the output of the pressure-gradient microphone versus amplitude to produce multiple frequency-specific measures of sensitivity. Acoustic far-field conditions were assessed by confirming that there was no change in low-frequency sensitivity at different speaker distances. As expected for a pressure-difference microphone, the data show a 10-fold increase in sensitivity to particle velocity per decade of frequency and a phase shift of almost 90 deg.
RESULTS
Acoustically evoked field potential recordings were made in the Johnston's organs of 25 male and 30 female Aedes aegypti (L.). Each organ responded to tones presented singly and to pairs of tones presented simultaneously (Fig. 2A and B, respectively). A response consisted of two simultaneous components: a negative voltage deflection that was sustained throughout the stimulus, and multiple oscillations with different periods. When a single tone was presented, oscillations occurred at the frequency of the stimulus and its harmonics. When two different tones of nearby frequencies were presented together, there were oscillations at the frequency of each tone and its harmonics, as expected, as well as at the frequency corresponding to the difference between the two tones and its harmonics. In other words, there were additional oscillatory responses to the beats in the amplitude envelope of the stimulus. Single tones at the beat frequencies tested produced very small sustained deflections and even smaller periodic oscillations, showing that the additional oscillations in response to two-tone stimuli were not artifactual (Fig. 2C). Moreover, the response to a pair of tones was qualitatively different from the sum of the responses to each tone presented separately, showing that the system is non-linear (Fig. 2D). The effects of stimulus frequency and intensity were systematically explored to quantify whether sustained deflections or periodic oscillations are better suited to the task of frequency matching.
Fig. 2.
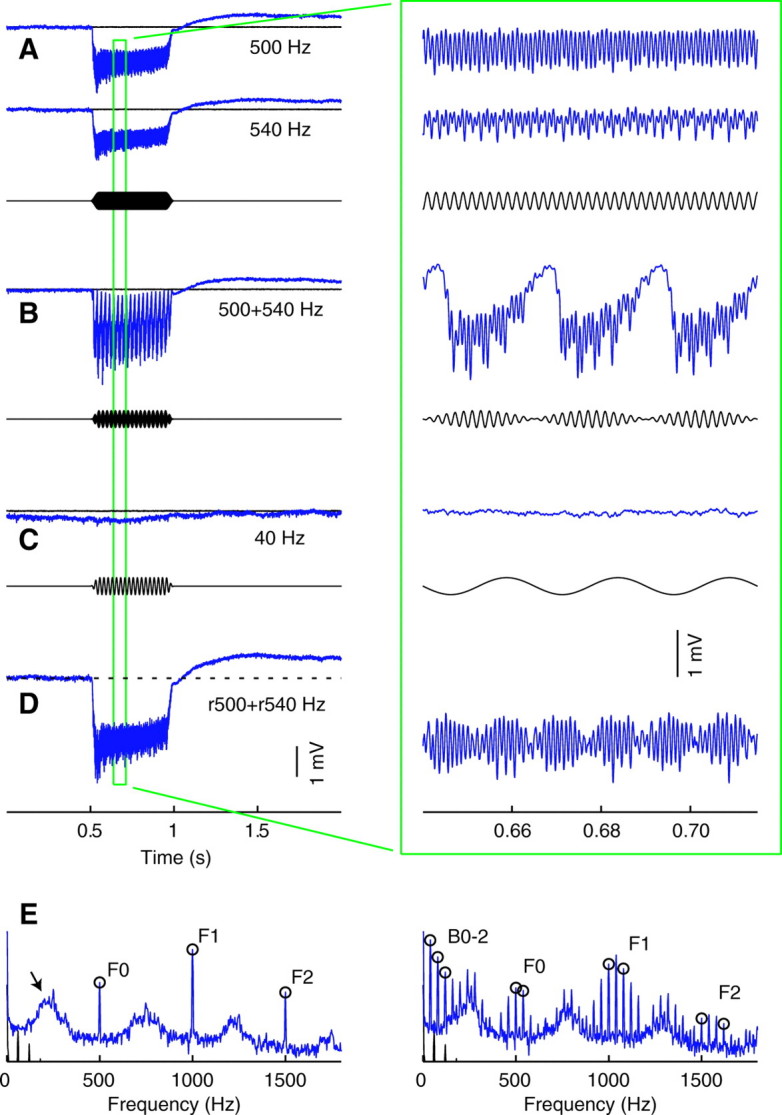
(A) Averaged field potentials recorded in response to 500 and 540 Hz tones presented separately at 90 dB in one male (blue). Thoracic control recordings are overlaid in black; stimulus is shown immediately below. (B) The response when two tones were presented simultaneously. (C) The response to a single 40 Hz tone at 90 dB, which corresponds to the difference, or beat, frequency of the two-tone stimulus in B. (D) A linear summation of the two responses in A for comparison with that in B. (E) Spectrograms of the response to the 500 Hz tone shown in A on the left, and of the response to the simultaneous presentation of 500 and 540 Hz in B on the right (blue). Spectrograms of thoracic control recordings are in black. Open circles and labels F0, F1 and F2 indicate the fundamental, second and third harmonics, respectively, of the stimuli. B0<2 indicate the same for the beat frequency. The arrow points to a sub-harmonic of the stimulus.
Frequency tuning curves
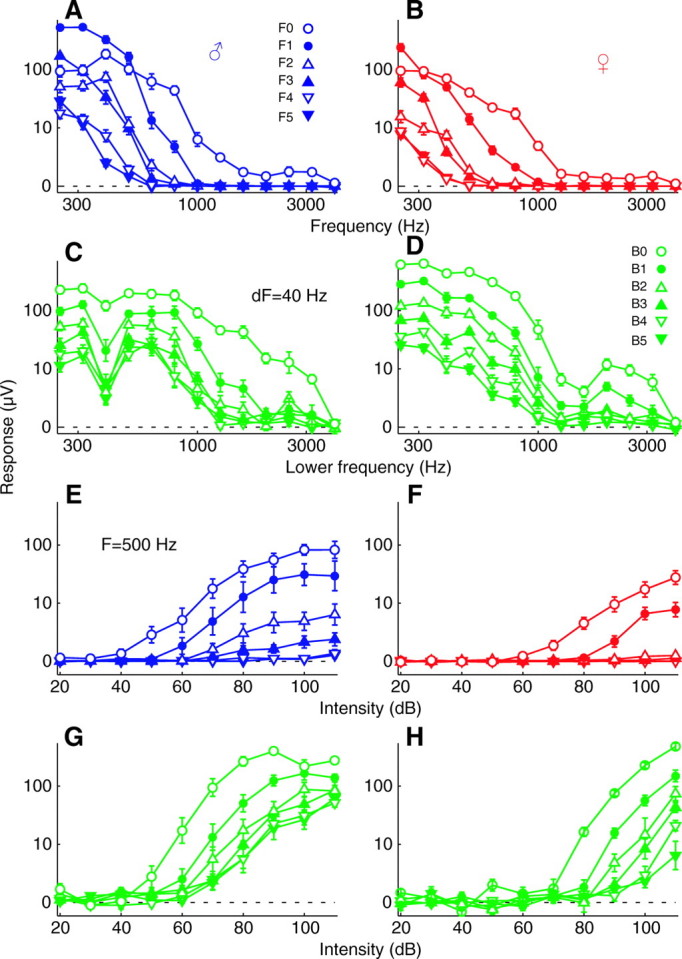
Sustained and oscillatory responses occurred in both males and females over a wide range of stimulus frequencies that included the higher harmonics of the flight tones. In response to single tones at 110 dB, sustained deflections occurred up to 3175 Hz, the highest frequency tested, in all 10 males tested, and periodic oscillations at the stimulus frequency occurred up to 1492±116 Hz (Fig. 3A). The corresponding limits in females were 1371±219 and 1559±192 Hz (N=15), respectively, although sustained deflections increased at frequencies beyond this, becoming large again around 3000 Hz (Fig. 3B). Adding a second tone 40 Hz higher increased sustained deflections only slightly (1.2× in males, 1.6× in females). By contrast, oscillations at the difference frequency of a two-tone stimulus were much greater than those at the fundamental of a one-tone stimulus (4.8× and 6.9×, respectively). As a consequence, oscillatory responses to 40 Hz beats were observed with stimulus frequencies up to 2940±157 Hz in males and 2494±245 in females. These trends occurred not just for 40 Hz beats, but at difference frequencies ranging from 5 to 160Hz (Fig. 3C,D). Across this range, there was little difference between sustained deflections to two- and one-tone stimuli in males (1.05×) or females (1.7×). However, periodic oscillations at the beat frequency of two-tone stimuli were much greater than oscillations at the fundamental of one-tone stimuli (3.1× males, 5.4× females). Comparing the sustained deflection to a one-tone stimulus with the periodic oscillation for a two-tone stimulus, the former was much larger in males (3.8× and 2.1× for the data in Fig. 3A and C, respectively), but slightly smaller in females (0.7× and 0.5×, respectively).
Fig. 3.

(A) The response to two-tone stimuli (green) in which the lower tone was varied from 250 to 3175 Hz, while the second tone was kept 40 Hz higher. The response to the lower tone presented alone is in blue. Sustained deflections (solid squares) and periodic oscillations at the fundamental frequency of one-tone stimuli (F0, blue open circles) and at the beat frequency of two-tone stimuli (B0, green open circles) are plotted separately. An ordinate of zero indicates a response equal to the level of the pre-stimulus background noise. The intensity is 110 dB for each tone played alone, making the two-tone stimuli 113 dB overall. Values are means ± s.e.m. for 10 males. (C) Here the lower tone was fixed at 500 Hz and the higher tone was varied from 505 to 660 Hz, creating difference frequencies from 5 to 160 Hz (green). The response to a 500 Hz tone presented alone is shown in blue. Intensity is 90 dB for a tone alone, 93 dB for a pair; N=10 males. (B,D) Same as in A and C but for 15 females.
Intensity tuning curves
Sustained and oscillatory responses both occur at behaviorally relevant intensities (~90 dB SPVL at 1 cm) (Göpfert et al., 1999). Response thresholds are quantified here in three complementary ways, all of which yield similar results. In males, the amplitude of the sustained deflection in response to a single tone at 500 Hz rises above the pre-stimulus background noise and thoracic controls at 64±3dB when averaged across trials, while the sustained deflection to a pair of tones at 500 and 540 Hz exceeds baseline at 53±4 dB (N=10; Fig. 4A). The amplitude threshold for the periodic oscillation at the fundamental frequency of the same one-tone stimulus was 38±4 dB, whereas that of the periodic oscillation at the beat frequency of the same two-tone stimulus was 46±4 dB. Amplitude thresholds in females were considerably higher, at 84±4 and 83±3 dB for the corresponding sustained deflections and 61±3 and 62±4 dB for the periodic oscillations (N=10; Fig. 4B). Thresholds determined by neurometric functions show a similar pattern, with a sustained deflection to a single tone being present in 75% of trials for males at 77±4 dB and to a pair of tones at 70±1 dB (Fig. 4C,D). The neurometric threshold for the periodic oscillation at the fundamental frequency of a one-tone stimulus was 60±3 dB, and that at the beat frequency of a two-tone stimulus was 62±2 dB. In females the corresponding neurometric thresholds were 97±3 and 90±3 dB for sustained deflections and 76±3 and 81±1 dB for periodic oscillations, respectively. Thresholds determined by the vector strength to periodic oscillations were also similar, with that at the fundamental frequency of the one-tone stimulus being 58±4 dB in males, and that at the beat frequency of the two-tone stimulus being 58±2 dB (Fig. 4E,F). In females the corresponding vector strength thresholds were 77±5 dB and 80±1 dB. Averaged across these three metrics, thresholds were 21 dB lower in males than in females, 1 dB lower for two-tone than one-tone stimuli, and 17 dB lower for periodic oscillations than for sustained deflections. On average, thresholds for oscillatory responses to two-tone stimuli were 18 dB lower than for sustained responses to one-tone stimuli.
Fig. 4.

(A) The response to one- and two-tone stimuli in which the frequencies were fixed at 500 and 540 Hz and intensity was varied. Symbol scheme is the same as that in Fig. 3. Intensities shown for two-tone stimuli are for just one of their constituent tones, the overall intensity then being 3 dB higher. Values are means ± s.e.m. for 10 males (C) Neurometric functions for the same data as in A. Dashed lines indicate chance level at 50% and threshold criterion at 75%. (E) Vector strengths for the same data as in A. Dashed line indicates significance at P<0.01. (B,D,F) Same as A,C,E but for 10 females.
Harmonics in the response
Oscillatory responses to one and two tones contain energy at the higher harmonics of the stimulus and beat frequencies. Intense low-frequency stimuli elicited at least six harmonics; less-intense higher frequencies elicited fewer. Specifically, whereas single 110 dB tones up to 1492±116 Hz evoked an oscillation at the fundamental of the stimulus frequency (F0), harmonics F1<F5 were only evoked by tones up to 1213±176, 815±96, 812±61, 624±59, and 545±35 Hz, respectively (N=10 males; Fig. 5A). As this implies, higher intensities are generally needed to elicit higher harmonics. At 500 Hz, the lowest intensity that elicited each harmonic was 38±4 for F0, 62±7 for F1, 67±6 for F2, 78±6 for F3, 91±7 for F4, and 89±8 dB for F5 (Fig. 5E). Similarly, two-tone stimuli elicited oscillations at the harmonics of the beat frequency. The corresponding high-frequency limits for harmonics B0 to B5 of the 40 Hz beat frequency of two-tone stimuli were 2940±157, 1627±288, 1055±271, 1158±204, 1078±184 and 1513±332 Hz, respectively (Fig. 5C). Amplitude thresholds were 46±4, 53±5, 59±6, 60±7, 63±4 and 67±7 dB for B0 to B5, respectively (Fig. 5G). By contrast, response amplitude was systematically non-monotonically related to harmonic number. Whereas amplitude usually decreased with harmonic number for all two-tone stimuli and high-frequency one-tone stimuli, the even harmonics (F1, F3, F5) of low-frequency one-tone stimuli had consistently larger amplitudes than the next-lower odd harmonic (F0, F2, F4; see Fig. 5A filled vs open symbols). Crossover points were about 550, 350 and 300 Hz for the F0/F1, F2/F3 and F4/F5 harmonic pairs in males, respectively. Despite these reversals, the first two harmonics (F0, F1) were still of larger amplitude for low-frequency stimuli than the next two harmonics (F2, F3), which in turn were larger than the last two harmonics measured (F4, F5). Females showed similar trends with harmonic number in the frequency range, intensity threshold and overall amplitude, although frequency limits were shifted lower and thresholds shifted higher compared with males (Fig. 5B,D,F,H).
Fig. 5.
(A,B) The magnitude of periodic oscillations at the fundamental frequency (F0) and multiple harmonics (F1–5) in response to a one-tone stimulus as a function of stimulus frequency and sex. (C,D) The magnitude of additional periodic oscillations at the difference, or beat, frequency (B0) and its harmonics (B1–5) in response to a pair of tones presented simultaneously. (E–H) Same as A–D but as a function of intensity. Intensity in A and B is 110 dB and in C and D 113 dB; frequency in E and F is 500 Hz and in G and H 500 and 540 Hz. Values are means ± s.e.m. for the same data as in Figs 3 and 4.
Stimulus envelope
Neural responses follow the stimulus envelope in amplitude-modulated stimuli. Whether the stimulus envelope was square-, triangle- or sine-wave modulated, the response is analogous to that shown above for simple one- and two-tone stimuli: there is a slow component that follows the lower (i.e. negative) half of the envelope and a superimposed fast component at the frequency of the carrier (Fig. 6A–C). The slow component, while not precisely the same shape as the stimulus envelope, is distinct enough that differences in the duty cycles of square waves can easily be discerned by eye, as can differences in locations of peaks in triangle waves. A single long pulse (Fig. 6D) clearly shows drooping of the response due to the 0.1 Hz high-pass filter on the recording amplifier, which is not as prominent in Fig. 2 because of the shorter stimulus lengths.
Fig. 6.

Averaged field potentials recorded in response to amplitude-modulated tones with a 500 Hz carrier frequency at 90 dB in one male. Same color scheme and layout as in Fig. 2. (A) Square-wave modulated stimuli with 10%, 50% and 90% duty-cycles and 10-ms rise times. (B) Triangle-wave modulation with the peaks at 10%, 50% and 90% of the period. (C) A sine-wave-modulated stimulus. (D) A single square pulse with 50-ms cosine ramps. Data similar to this exemplar were observed in a total of three males and three females.
DISCUSSION
In several species of mosquitoes males and females respond to one another in precopulatory flight by matching their wing beats at harmonically related frequencies (Gibson and Russell, 2006; Cator et al., 2009; Warren et al., 2009). Each mosquito must thus be able to tell how fast its wings beat relative to those of a potential mate and direct its motor system to increase or decrease its rate accordingly. That this task is accomplished in the presence of acoustic interference from its own wings makes it all the more impressive. One computational strategy that might underlie this behavior is differentiation between self- and externally generated sounds through an efference copy of the flight motor output, as is done by the electrosensory system of mormyrid fish (Bell, 1981). The harmonics of flight tones in this case could be represented by sustained deflections in the responses of frequency-tuned afferents (Cator et al., 2009). Another strategy would be to judge the magnitude of the difference in wing beat frequency by periodic oscillations in the envelope of the interacting flight tones (Warren et al., 2009), a strategy similar to that used by another weakly electric fish, Eigenmannia, in their jamming avoidance response (Heiligenberg and Rose, 1985). The present study determined the response magnitudes, frequency ranges, and thresholds of sustained deflections and periodic oscillations in Johnston's organ of Aedes aegypti to compare their possible roles in these alternative hypotheses. The sustained deflection to a one-tone stimulus is approximately the same amplitude as that of the periodic oscillation at the beat frequency of a two-tone stimulus. The upper limits of the frequency ranges are also comparable, both extending to the fifth harmonic of the male flight tone. Although thresholds for one-tone sustained deflections are higher than those for two-tone periodic oscillations, both are within the behaviorally relevant range. These data leave open the question of whether sustained deflections or periodic oscillations mediate flight tone matching behavior.
Previously described behavioral data address some of these issues. Roth (Roth, 1948) reported that males resting on the side of a cage took off and chased females who made close flybys, leading him to conclude that they could hear them. Because the cages were lit, however, visual cues cannot be ruled out. Subsequently, Wishart and Riordan (Wishart and Riordan, 1959) showed that flying males were attracted to a synthesized tone mimicking a female's fundamental but not to two such tones of slightly different frequencies played from the same speaker, unless they were of different intensities. Single tones were ineffective when males were resting, contradicting Roth (Roth, 1948). It is tempting to conclude from these reports that males must hear exactly two tones, including their own, to recognize and be attracted to a female. Unfortunately Wishart and Riordan (Wishart and Riordan, 1959) did not report whether resting males responded to two tones, a result which would clearly discriminate between the use of an efference copy and a beating interference pattern. Initial phonotaxis to the fundamental of the flight tone might be served, however, by a separate neural mechanism than is used for matching of flight tones at the harmonics.
A simple model can reproduce sustained and oscillatory responses to one-tone stimuli and oscillations at the beat frequency of two-tone stimuli (Fig. 7A). An asymmetric non-linearity models the transfer function between flagellar displacement and electrical currents in sensory cells of Johnston's organ, and a low-pass filter simulates integration performed by membrane capacitance. The output (Fig. 7B) qualitatively matches physiological data shown in Figs 2 and 6. Since separate sensory cells transduce upward and downward movements of the basilar plate, the frequency of oscillation in the field potential is double the frequency of flagellar vibration. Moreover, the output of this model has power at the beat frequency of a two-tone stimulus, where none is present in the input sound (Fig. 7C,D). In the time-domain waveform, power at the beat frequency manifests itself as a periodic shift in the baseline. Thus the response to the beat frequency can be understood as following the stimulus envelope, which is precisely how the sustained deflection behaves.
Fig. 7.

A model of neural responses in the antennae. (A) Sound vibrates the flagellum (f), causing the basilar plate (p) to pivot about its rigid junction with the flagellum, thereby activating both the upper (red) and lower (blue) stretch-sensitive transducers (t) in alternation. Displacement (d) of the flagellum induces an asymmetric current (i) into the transducers through a variable conductance (g). The resulting voltage is then low-pass filtered by the membrane capacitance (c) before the inverted responses are summed across both transducers. (B) A numerical simulation showing the response to a pure tone stimulus. The top waveform is the sound particle velocity; the middle waveforms are transducer currents, the blue one being larger here because the simulated electrode is positioned in the lower right half of Johnston's organ; and the bottom waveform is the resulting low-passed, inverted and summed voltage. (C) Same as in B but for a two-tone stimulus. Only the stimulus (top panel) and voltage output (bottom panel) are shown. (D) A Fourier analysis of the two waveforms in C.
Field potentials recorded from the mammalian cochlea also exhibit sustained deflections and periodic oscillations. Termed the summating potential and cochlear microphonic, respectively, they arise from direct and alternating transduction currents in hair cells (reviewed by Pickles, 1988). Whereas at low frequencies the intracellular voltage follows the sound stimulus on a cycle-by-cycle basis, sustained deflections arise at frequencies beyond the membrane time constant due to an asymmetric non-linearity in the relationship between stereocilia deflection and current flow into the hair cell (e.g. Russell and Sellick, 1978; Corey and Hudspeth, 1983). Thus distortion is introduced into the transduction process, including power at the sum and difference frequencies of two-tone stimuli (Lukashkin and Russell, 1998). Although corresponding intracellular data do not yet exist in the mosquito, the data presented here, as well as that of Tischner (Tischner, 1953), show modulation of the envelope in response to two-tone stimuli that can be qualitatively reproduced using mammalian models. Moreover, Henson et al. (Henson et al., 1982) presented similar data in bats, Zhou and Baker (Zhou and Baker, 1993) showed sensitivity to the beats in the envelope of visually presented sinewave gratings in primates, and Single and Borst (Borst, 1998) showed both sustained deflections and periodic oscillations in the visual system of flies. It is plausible that similar underlying mechanisms exist throughout the animal kingdom, and that the mosquito auditory nerve encodes stimuli in ways similar to that of mammals. One must wonder then whether spiking afferents in the mosquito exhibit vector-strength thresholds lower than spike-rate thresholds, as is true of some mammalian auditory nerve fibers (Palmer and Russell, 1986). It is also curious that while mosquito sensory neurons are paired in scolopidial transduction units, mammalian hair cells come in two types, outer ones that add energy to the system and inner ones that convey information centrally. Active amplification is known in mosquitoes but its cellular basis has not yet been identified (Göpfert and Robert, 2001; Jackson et al., 2009).
Periodic oscillations observed in Johnston's organ are often at twice the stimulus frequency. Tischner (Tischner, 1953) reported that the doubling was predominant below 380 Hz, the frequency that elicited the largest response, and tapered off at higher frequencies, to the point where the response was largely at just the stimulus frequency. Wishart et al. (Wishart et al., 1962), subsequently reported that doubling also depends on the location and depth of electrode insertion. The data presented here show that the response to a pure tone is a harmonically related stack of oscillations with energy present up to at least the sixth harmonic. In general, the higher the harmonic, the smaller its amplitude and the higher its threshold. Higher stimulus frequencies also elicited fewer harmonics. A consistent exception to this pattern is that for low frequency stimuli the even harmonics (e.g. F1) had larger amplitudes than the next-lower odd harmonic (e.g. F0), a finding consistent with that of Tischner (Tischner, 1953) and the predominant notion of frequency doubling. One possible explanation for the frequency dependence of doubling is that out-of-phase signals from sensory cells distant to the recording site are low-pass filtered as they propagate through neural tissue, whereas nearby in-phase signals are not. Low-frequency stimuli could thereby generate alternating potentials of equal amplitude at the electrode, resulting in frequency doubling, whereas high frequencies would result in unequal amplitudes and a predominant fundamental. The fact that periodic oscillations at the fundamental frequency of the stimulus occur at much higher frequencies than the doubled response means that studies that consider only the latter may underestimate the upper frequency limit of hearing.
Further work is needed to clarify the role of sustained and oscillatory responses in the matching of flight tones during mosquito mating. Beats in the envelope of the interacting flight tones, for example, only provide the magnitude of the difference in flight tones, not its sign. It is not known whether mosquitoes hunt for the correct direction to modulate their wing beat frequency, but such behavior would suggest that they do not perceive the sign of the difference in flight tones. Electric fish are able to determine the sign of the difference between the self- and conspecific-generated electric organ discharges through the use of the phases of the beat and carrier (Heiligenberg and Rose, 1985). Contrary to previous reports, periodic oscillations in mosquitoes do occur at stimulus frequencies corresponding to harmonics of the flight tone, but it is unclear whether their phase could be reliably extracted because of their small amplitude. An alternative strategy of using an efference copy and frequency-tuned afferents to differentiate self from conspecific is appealing but equally unsubstantiated. Though both are present in vertebrates (e.g. Bell, 1981; Pickles, 1988), neither has yet been described in mosquitoes. Two additional hypotheses warrant consideration. In humans, distinguishing among multiple sound sources, at a party for example, is thought to be mediated through sound localization cues (Cherry, 1953; Takahashi and Keller, 1994). Mosquitoes could use a similar strategy to differentiate self from conspecific. It could also be that mismatched flight tones are sensed by mosquitoes in much the same way as humans perceive musical dissonance (Moore et al., 1985; Sinex et al., 2005), where the relative phase between the carrier frequency and the beats in a harmonic stack is used to judge inharmonicity. More physiological and behavioral studies on the neural mechanisms underlying mosquito audition could address these questions and lead to a better understanding of mosquito mating behavior.
ACKNOWLEDGEMENTS
We thank Lauren Cator for thoughtful discussion and maintenance of the mosquito colony, Bruce Land for help with the electronics and modeling, two anonymous reviewers for constructive feedback, and the National Institute of Deafness and Communication Disorders (2R01DC000103).
LIST OF ABBREVIATIONS
- B0
the spectral component of the response to two tones at the frequency of their difference
- B1-B5
same as B0, but at the harmonics of the difference in the stimulus frequencies
- F0
the spectral component of the response to a single tone at the frequency of the stimulus
- F1-F5
same as F0, but at the harmonics of the stimulus frequency
- SPVL
sound particle-velocity level, re. 49 nm s−1
REFERENCES
- Bagwell C. B. (2005). Hyperlog – a flexible log-like transform for negative, zero, and positive valued data. Cytometry Part A 64A, 34-42 [DOI] [PubMed] [Google Scholar]
- Bailey W. J. (2003). Insect duets: underlying mechanisms and their evolution. Physiol. Ent. 28, 157-174 [Google Scholar]
- Bell C. C. (1981). An efference copy which is modified by reafferent input. Science 214, 450-453 [DOI] [PubMed] [Google Scholar]
- Belton P. (1974). An analysis of direction finding in male mosquitoes. In Experimental Analysis of Insect Behavior (ed. Browne L. B.), pp. 139-148 Berlin: Springer-Verlag; [Google Scholar]
- Belton P. (1989). The structure and probable function of the internal cuticular parts of Johnston's organ in mosquitoes (Aedes aegypti). Can. J. Zool. 67, 2625-2632 [Google Scholar]
- Bennet-Clark H. C. (1971). Acoustics of insect song. Nature 234, 255-259 [Google Scholar]
- Cator L. J., Arthur B. J., Harrington L. C., Hoy R. R. (2009). Harmonic convergence in the love songs of the dengue vector mosquito. Science 323, 1077-1079 [DOI] [PMC free article] [PubMed] [Google Scholar]
- Cherry E. C. (1953). Some experiments on the recognition of speech, with one and with two ears. J. Acoust. Soc. Am. 25, 975-979 [Google Scholar]
- Clements A. N. (1992). The Biology of Mosquitoes: Sensory Reception and Behavior (Vol. 2). London: Chapman and Hall; [Google Scholar]
- Corey D. P., Hudspeth A. J. (1983). Kinetics of the receptor current in bullfrog saccular hair cells. J. Neurosci. 3, 962-976 [DOI] [PMC free article] [PubMed] [Google Scholar]
- Dixon W. J. (1960). Simplified estimation from censored normal samples. Ann. Math. Stats. 31, 385-391 [Google Scholar]
- Gibson G., Russell I. (2006). Flying in tune: Sexual recognition in mosquitoes. Curr. Biol. 16, 1311-1316 [DOI] [PubMed] [Google Scholar]
- Göpfert M. C., Robert D. (2000). Nanometre-range acoustic sensitivity in male and female mosquitoes. Proc. R. Soc. Lond. B 267, 453-457 [DOI] [PMC free article] [PubMed] [Google Scholar]
- Göpfert M. C., Robert D. (2001). Active auditory mechanics in mosquitoes. Proc. R. Soc. Lond. B 268, 333-339 [DOI] [PMC free article] [PubMed] [Google Scholar]
- Göpfert M. C., Briegel H., Robert D. (1999). Mosquito hearing: sound-induced antennal vibrations in male and female Aedes aegypti. J. Exp. Biol. 202, 2727-2738 [DOI] [PubMed] [Google Scholar]
- Heiligenberg W., Rose G. (1985). Neural correlates of the jamming avoidance response (JAR) in the weakly electric fish Eigenmannia. Trends Neurosci. 8, 442-449 [Google Scholar]
- Henson O. W., Jr, Pollak G. D., Kobler J. B., Henson M. M., Goldman L. J. (1982). Cochlear microphonic potentials elicited by biosonar signals in flying bats, Pteronotus p. parnellii. Hearing Res. 7, 127-147 [DOI] [PubMed] [Google Scholar]
- Hubel D. H. (1957). Tungsten microelectrode for recording from single units. Science 125, 549-550 [DOI] [PubMed] [Google Scholar]
- Jackson J. C., Windmill J. F. C., Pook V. G., Robert D. (2009). Synchrony through twice-frequency forcing for sensitive and selective auditory processing. Proc. Natl. Acad. Sci. USA 106, 10177-10182 [DOI] [PMC free article] [PubMed] [Google Scholar]
- Johnston C. (1855). Auditory apparatus of the Culex mosquito. Q. J. Microsc. Sci. 3, 97-102 [Google Scholar]
- Lukashkin A. N., Russell I. J. (1998). A descriptive model of the receptor potential nonlinearities generated by the hair cell mechanoelectrical transducer. J. Acoust. Soc. Am. 103, 973-980 [DOI] [PubMed] [Google Scholar]
- Moore B. C. J., Peters R. W., Glasberg B. R. (1985). Thresholds for the detection of inharmonicity in complex tones. J. Acoust. Soc. Am. 77, 1861-1867 [DOI] [PubMed] [Google Scholar]
- Narins P. M. (1995). Frog communication. Sci. Amer. 273, 78-83 8966537 [Google Scholar]
- Palmer A. R., Russell I. J. (1986). Phase-locking in the cochlear nerve of the guinea-pig and its relation to the receptor potential of inner hair cells. Hearing Res. 24, 1-15 [DOI] [PubMed] [Google Scholar]
- Pickles J. O. (1988). An Introduction to the Physiology of Hearing. London: Academic Press; [Google Scholar]
- Roth L. M. (1948). A study of mosquito behavior: an experimental laboratory study of the sexual behavior of Aedes aegypti (Linnaeus). Am. Midl. Nat. 40, 265-352 [Google Scholar]
- Russell I. J., Sellick P. M. (1978). Intracellular studies of hair cells in the mammalian cochlea. J. Physiol. 284, 261-290 [DOI] [PMC free article] [PubMed] [Google Scholar]
- Sinex D. G., Li H., Velenovsky D. S. (2005). Prevalence of stereotypical responses to mistuned complex tones in the inferior colliculus. J. Neurophys. 94, 3523-3537 [DOI] [PMC free article] [PubMed] [Google Scholar]
- Single S., Borst A. (1998). Dendritic integration and its role in computing image velocity. Science 281, 1848-1850 [DOI] [PubMed] [Google Scholar]
- Takahashi T. T., Keller C. H. (1994). Representation of multiple sound sources in the owl's auditory space map. J. Neurosci. 14, 4780-4793 [DOI] [PMC free article] [PubMed] [Google Scholar]
- Thorpe W. H. (1973). Duet-singing birds. Sci. Amer. 229, 70-79 [Google Scholar]
- Tischner H. (1953). Über den Gehörsinn von Stechmücken. Acustica 3, 335-343 [Google Scholar]
- Warren B., Gibson G., Russell I. J. (2009). Sex recognition through midflight mating duets in Culex mosquitoes is mediated by acoustic distortion. Curr. Biol. 19, 485-491 [DOI] [PubMed] [Google Scholar]
- Wishart G., Riordan D. F. (1959). Flight responses to various sounds by adult males of Aedes aegypti (L.) (Diptera: Culicidae). Can. Entom. 91, 181-191 [Google Scholar]
- Wishart G., van Sickle G. R., Riordan D. F. (1962). Orientation of the males of Aedes aegypti (L.) (Diptera: Culicidae) to sound. Can. Entom. 94, 613-626 [Google Scholar]
- Zhou Y.-X., Baker C. L., Jr (1993). A processing stream in mammalian visual cortex neurons for non-fourier responses. Science 261, 98-101 [DOI] [PubMed] [Google Scholar]