Abstract
AIMS:
There is an uncertainty about what constitutes an optimal level of blood glucose (BG) in critically ill patients. The objective of this study is to identify the optimal BG target for glycemic control in critically ill patients that is associated with survival benefit with the least hypoglycemia risk.
SETTING AND DESIGN:
This is a nested cohort study within a randomized control trial conducted in a tertiary care center in King Abdulaziz Medical City, Riyadh, Kingdom of Saudi Arabia.
METHODS:
The study was carried out in a single center to assess the effect of intensive insulin therapy [IIT; target BG 4.4-6.1 mmol/L (80-110 mg/dL)] versus conventional insulin therapy [CIT; target BG 10-11.1 mmol/L (180-200 mg/dL)] in a medical/surgical ICU. All patients were divided into six groups based on the mean daily BG levels. A logistic regression model was used to determine the association of BG and ICU mortality. We compared different outcomes below and above different BG thresholds of 0.1 mmol/L (2 mg/dL) increments using multivariate analyses.
STATISTICAL ANALYSIS:
Data are presented as mean ± SD or median with interquartile ranges, unless otherwise indicated. Differences between the six groups were assessed using the χ2 test. A P-value equal or less than 0.05 was considered to indicate statistical significance. The results were expressed as adjusted odds ratio (aOR) and 95% confidence intervals (CI). Statistical analyses were carried out using the Statistical Analysis Software (SAS, release 8, SAS Institute Inc., Cary, NC, USA).
RESULTS:
Among six groups, the ICU mortality was least in patients with BG <8.7 mmol/L (<157 mg/dL) compared with patients with BG ≥8.7 mmol/L (≥157 mg/dL) [11.5% vs. 21.5%, P = 0.002]. When analyzed using 0.1 mmol increments in average BG, we found that mortality remained unchanged by increasing thresholds of BG up to 8.0 mmol/L (144 mg/dL) and started to rise with thresholds of BG of 8.1 mmol/L (146 mg/dL) and above. The risk of hypoglycemia was the highest with a BG threshold of 6.1 mmol/L (110 mg/dL) and gradually decreased with increasing BG levels to plateau with a BG level of 7.2 mmol/L (130 mg/dL) and higher.
CONCLUSION:
Our study suggests that a BG level of 8.1 mmol/L (146 mg/dL) and below represents an optimal level in critically ill patients.
Keywords: Critically ill, hypoglycemia, insulin, intensive care, mortality, sepsis
Several observational studies showed a consistent relationship between elevated blood glucose (BG) levels and increased mortality.[1–8] In 2001, a randomized controlled trial of tight BG control in surgical ICU patients [targeting BG 4.4-6.1 mmol/L (80-110 mg/dL)] with intensive insulin therapy (IIT) reported a significant reduction in mortality compared with a conventional insulin therapy (CIT) [targeting BG levels 10-11.1 mmol/L (180-200 mg/dL)].[9] These findings lead to calls to use tight BG control as a standard of care for ICU patients. However, several subsequent randomized controlled trials targeting similar BG levels[10–14] showed no mortality benefit but a significant risk of hypoglycemia with IIT. The Normoglycemia in Intensive Care Evaluation-Survival Using Glucose Algorithm Regulation (NICE-SUGAR) study, the largest trial of IIT to date, compared IIT to keep BG 4.5-6.0 mmol/L (81-108 mg/dL) with CIT to keep BG levels 10 mmol/L or less (<180 mg/ dL).[14] The study found that a BG target of <10 mmol/L (<180 mg/dL) resulted in lower mortality than did a target of 4.5-6.0 mmol/L (81-108 mg/dL). More recently, the COIITSS study investigators found that IIT did not improve survival in patients with septic shock who were treated with hydrocortisone.[15] As a result, the pendulum of BG control in many ICUs swung back to less strict goals. With all the recent trials, it remains unclear what constitutes an optimal level of BG in critically ill patients. The purpose of this study was to identify the optimal BG target for glycemic control in critically ill patients that is associated with survival benefit with the least hypoglycemia risk.
Methods
Setting
This is a single-center study conducted in the 21-bed medical surgical ICU in a tertiary care academic center in King Abdulaziz Medical City (KAMC), Riyadh, Kingdom of Saudi Arabia. The ICU is run as a closed unit by critical care board-certified intensivists 24 h/7 days. The ICU admits more than 1000 patients per year. Our nurse/patient ratio is approximately 1:1.2.
Study design
We carried out a cohort study nested within a randomized controlled trial that compared IIT versus CIT in a mixed population of medical/surgical critically ill patients. Details of the original study are published elsewhere.[12] In brief, the clinical trial compared IIT to keep the BG level between 4.4-6.1 mmol/L (80-110 mg/dL) with CIT to keep the BG level 10-11.1 mmol/L (180-200 mg/dL). Patients received insulin infusion according to predesigned protocols to achieve these targets. BG measurements were done using either arterial or whole capillary blood via a bedside glucose analyzer. BG measurements were obtained every 1-4 h according to the protocol. If the patient developed hypoglycemia, then the BG was checked every 20 min. The mean BG for each patient was calculated by averaging the daily mean BG levels. That single value was assigned for each patient and was used for subsequent analysis. Hypoglycemia was defined as BG <2.2 mmol/L (40 mg/dL). The original study was approved by the institutional review board (ref. 7.0/RC 107-02, National Guard Health Affairs) and registered at the Current Controlled Trials registry (ISRCTN07413772) and found no mortality benefit of IIT compared to CIT.
For the current study, all patients from the original study (N = 523) were included in the analyses.
Data collection
We extracted the following data from the main database which was used for the original study: patient's demographics, body mass index (BMI), Acute Physiology and Chronic Health Evaluation (APACHE) II score,[16] admission category (postoperative vs. nonoperative), history of diabetes, history of sepsis, traumatic brain injury, admission BG level, vasopressor therapy (defined as the use of any vasopressor infusion except dopamine <5 mcg/kg/min), mechanical ventilation, serum creatinine, platelet count, bilirubin, International Normalization Ratio (INR), partial pressure of oxygen to fraction of inspired oxygen ratio (PaO2:FiO2 ratio), and Glasgow Coma Scale (GCS). Study endpoints were ICU mortality, hospital mortality, and rates of hypoglycemia.
Statistical analysis
Patients were divided into six groups of equal numbers based on average BG levels. Patients in group 1 had BG of <6 mmol/L while patients in groups 2, 3, 4, 5, and 6 had a BG level of 6.0-6.3, 6.4-7.1, 7.2-8.6, 8.7-10.3, and ≥10.4 mmol/L, respectively. Data are presented as mean ± SD or median with interquartile ranges, unless otherwise indicated. Differences between the six groups were assessed using the χ2 test. A P-value equal or less than 0.05 was considered to indicate statistical significance. Adjustment for differences in baseline characteristics was done for age, history of diabetes mellitus (DM), inclusion BG, randomization to IIT vs. CIT, sepsis, creatinine, APACHE II score, INR, and admission category (postoperative vs. non-post-operative). The results were expressed as adjusted odds ratio (aOR) and 95% confidence intervals (CI). The cohort of patients was also analyzed using 0.1 mmol increments in the mean BG. For each value of BG, the aOR of ICU mortality for all the patients with BG levels above that value was compared to that of all patients below that value, adjusting for differences in baseline characteristics as above. We then used the same methodology to identify a threshold below which the rate of hypoglycemia was increased. Statistical analyses were carried out using the Statistical Analysis Software (SAS, release 8; SAS Institute Inc., Cary, NC, USA).
Results
Patient characteristics
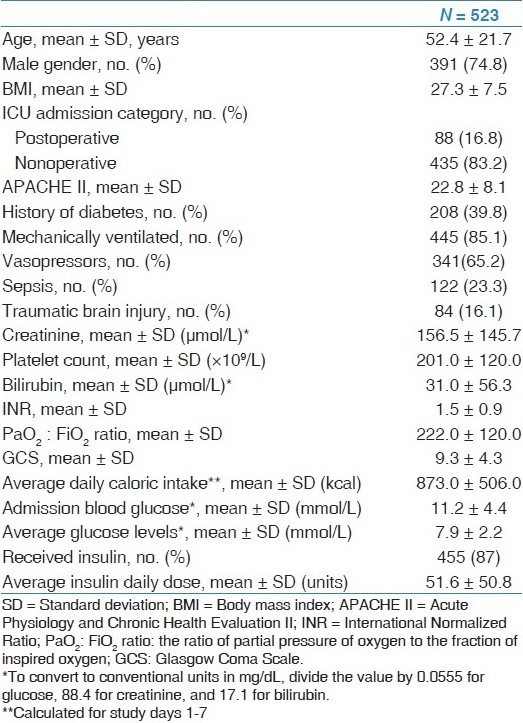
Table 1 shows the baseline characteristics of the patients included in this study. The mean age was 52.4 ± 21.7 years; 74.8% were males, 39.8% were diabetic, 85.1% were mechanically ventilated and 65.2% required inotropic support. The patients were a mix of medical (83.2%) and surgical category (16.8%). The average APACHE II score was 22.8 ± 8.1. The average admission BG in the whole cohort was 11.2 ± 4.4 mmol/L. The mean BG for all patients was 7.9 ± 2.2 mmol/L. Four hundred and fifty-five (87%) of patients received insulin infusion with an average daily insulin dose of 51.6 ± 50.8 units during the study period.
Table 1.
Baseline characteristics of all patients included in the study

Outcomes
Crude ICU and hospital mortality rates were similar in groups 1-4 [with BG <8.7 mmol/L (<157 mg/dL)] and increased in patients in groups 5-6 [with BG ≥8.7 mmol/L (≥157 mg/dL)] [Table 2]. The rates of hypoglycemia were lowest in groups 5 and 6 and increased as the threshold BG was reduced [Table 2]. When groups 1-4 were combined [BG < 8.7 mmol/L (<157 mg/dL)] and compared to groups 5-6 combined [BG ≥8.7 mmol/L (≥157 mg/dL)], the ICU mortality was 11.5% vs. 21.5%, respectively (P = 0.002) and the hospital mortality was 22.9% vs. 40.5%, respectively (P< 0.0001), while the rates of hypoglycemia were 23.8% vs. 3.5%, respectively (P > 0.0001).
Table 2.
Outcomes among six groups of patients according to mean blood glucose level

In a multivariate analysis adjusting for differences in baseline characteristics between the six groups [Table 3], patients in groups 5-6 had the highest ICU mortality and lowest incidence of hypoglycemia.
Table 3.
Multivariate analysis of the outcomes in the six groups of patients by using multivariate stepwise Cox proportional hazards regression analysis adjusted for age, history of diabetes mellitus, inclusion BG, randomization to IIT vs. CIT, sepsis, creatinine, APACHE II score, INR, and admission category (postoperative vs. non-post-operative)

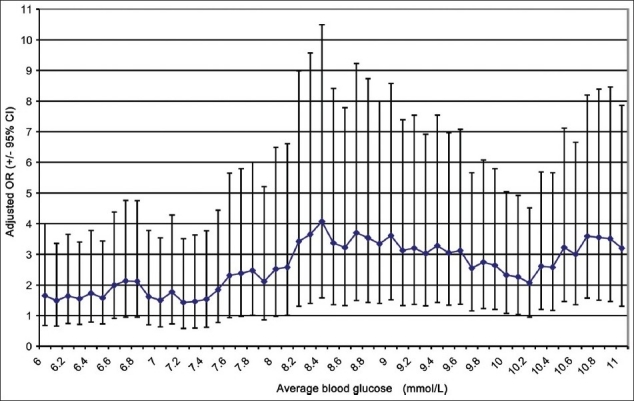
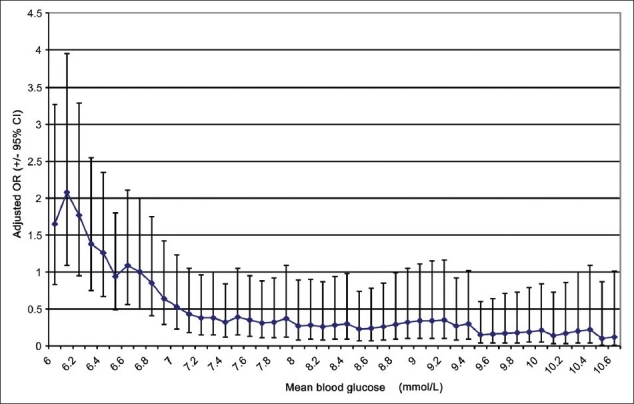
With increasing the BG threshold from 6.1 mmol/L (110 mg/dL), mortality remained unchanged until a threshold of <8.1 mmol/L (146 mg/dL) where mortality was noted to rise and remained at the same level thereafter [Figure 1]. The risk of hypoglycemia was the highest with a BG threshold of 6.1 mmol/L (110 mg/dL) and gradually decreased with increasing BG levels to plateau with a BG level of 7.2 mmol/L (130 mg/dL) and higher [Figure 2].
Figure 1.

The odds ratio of ICU mortality at 0.1 mmol increments of average blood glucose, comparing all patients above that value to all patients below that value
Figure 2.

The odds ratio of developing hypoglycemia at 0.1 mmol increments of mean blood glucose, comparing all patients above that value to all patients below that value
Discussion
Our study suggests that a BG level of 8.1 mmol/L (146 mg/dL) and below represents an optimal level in critically ill patients.
Several IIT studies in critically ill patients compared a target BG level of 4.4-6.1 mmol/L (80-110 mg/dL) to 10-11.1 mmol/L (180-200 mg/dL).[9–12,14] Our study shows that both levels are extremes and are probably not the optimal targets for BG control. The threshold of <6.1 mmol/L (<110 mg/dL) is associated with a significant hypoglycemia risk with no survival benefit over slightly less BG [<8.1 mmol/L (<110 mg/dL)]. Our data also shows that the threshold of 10-11.1 mmol/L (180-200 mg/dL) is associated with increased mortality.
In contrast, the Glucontrol[17] and NICE-SUGAR[14] studies used lower targets for the conventional insulin therapy group [<10 mmol/L (<180 mg/dL)]. The latter study showed that this target resulted in lower mortality than did a target of 4.5-6.0 mmol/L (81-108 mg/dL).
As per the nature of RCTs, the comparisons are held between two separate levels of BG and therefore it remained unclear whether intermediate levels of BG represent better targets. In our study, we were able to examine a continuum of BG levels, and as a result we were able to identify the association of mortality and hypoglycemia at different levels of BG. Our study shows that a target of 4.5-6.0 mmol/L may also not be the optimal BG target and calls for an intermediate target for BG control in critically ill patients [<8.1 mmol/L (<146 mg/dL)]. This level appears to represent a level that combines the least mortality and hypoglycemia risk. Unfortunately, none of the existing RCTs examined this level. Yet, several authors have called for a similar target to ensure the safety of BG control.[18] The Surviving Sepsis Campaign recommended this level of BG control.[19]
Our results are in agreement with the results of other observational studies that attempted to identify a BG threshold above which hyperglycemia is associated with increased mortality. Finney et al. found that patients who had most of their BG measurements above 10 mmol/L (180 mg/dL) had increased mortality. He suggested that the BG threshold for increased mortality lies between 8.0-10.0 mmol/L (144-180 mg/dL).[20]
Our study should be viewed in light of its strengths and limitations. One of the strengths of the study is the design, being a nested cohort study within a randomized controlled trial. As such, the data were collected prospectively, standardized IIT and CIT protocols were used, and in-services were given to the medical and nursing staff to ensure the safeguards against the development of hypoglycemia. In terms of limitations, the study is a post-hoc, monocenter study and of observational nature. In addition, the allocation to IIT versus CIT was randomized in the original RCT and as such the allocation in the current nested cohort study is not randomized.
In summary, our study showed that a target BG level of <8.1 mmol/L (<146 mg/dL) in critically ill patients may be adequate. This target would likely be associated with less risk of inadvertent hypoglycemia compared to other suggested targets. This finding needs to be validated in a prospective randomized controlled trial.
Footnotes
Source of Support: Nil,
Conflict of Interest: None declared.
References
- 1.Krinsley JS. Association between hyperglycemia and increased hospital mortality in a heterogeneous population of critically ill patients. Mayo Clin Proc. 2003;78:1471–8. doi: 10.4065/78.12.1471. [DOI] [PubMed] [Google Scholar]
- 2.Baird TA, Parsons MW, Phanh T, Butcher KS, Desmond PM, Tress BM, et al. Persistent poststroke hyperglycemia is independently associated with infarct expansion and worse clinical outcome. Stroke. 2003;34:2208–14. doi: 10.1161/01.STR.0000085087.41330.FF. [DOI] [PubMed] [Google Scholar]
- 3.Salim A, Hadjizacharia P, Dubose J, Brown C, InabaK , Chan LS, et al. Persistent hyperglycemia in severe traumatic brain injury: An independent predictor of outcome. Am Surg. 2009;75:25–9. [PubMed] [Google Scholar]
- 4.Bochicchio GV, Sung J, Joshi M, Bochicchio K, Johnson SB, Meyer W, et al. Persistent hyperglycemia is predictive of outcome in critically ill trauma patients. J Trauma. 2005;58:921–4. doi: 10.1097/01.ta.0000162141.26392.07. [DOI] [PubMed] [Google Scholar]
- 5.Gale SC, Sicoutris C, Reilly PM, Schwab CW, Gracias VH. Poor glycemic control is associated with increased mortality in critically ill trauma patients. Am Surg. 2007;73:454–60. doi: 10.1177/000313480707300507. [DOI] [PubMed] [Google Scholar]
- 6.Wahl WL, Taddonio M, Maggio PM, Arbabi S, Hemmila MR. Mean glucose values predict trauma patient mortality. J Trauma. 2008;65:42–7. doi: 10.1097/TA.0b013e318176c54e. [DOI] [PubMed] [Google Scholar]
- 7.Capes SE, Hunt D, Malmberg K, Gerstein HC. Stress hyperglycaemia and increased risk of death after myocardial infarction in patients with and without diabetes: A systematic overview. Lancet. 2000;355:773–8. doi: 10.1016/S0140-6736(99)08415-9. [DOI] [PubMed] [Google Scholar]
- 8.Malmberg K, Norhammar A, Wedel H, Ryden L. Glycometabolic state at admission: Important risk marker of mortality in conventionally treated patients with diabetes mellitus and acute myocardial infarction: Long-term results from the Diabetes and Insulin-Glucose Infusion in Acute Myocardial Infarction (DIGAMI) study. Circulation. 1999;99:2626–32. doi: 10.1161/01.cir.99.20.2626. [DOI] [PubMed] [Google Scholar]
- 9.van den Berghe G, Wouters P, Weekers F, Verwaest C, Bruyninckx F, Schetz M, et al. Intensive insulin therapy in the critically ill patients. N Engl J Med. 2001;345:1359–67. doi: 10.1056/NEJMoa011300. [DOI] [PubMed] [Google Scholar]
- 10.Van den Berghe G, Wilmer A, Hermans G, Meersseman W, Wouters PJ, Milants I, et al. Intensive insulin therapy in the medical ICU. N Engl J Med. 2006;354:449–61. doi: 10.1056/NEJMoa052521. [DOI] [PubMed] [Google Scholar]
- 11.Brunkhorst FM, Engel C, Bloos F, Meier-Hellmann A, Ragaller M, Weiler N, et al. Intensive insulin therapy and pentastarch resuscitation in severe sepsis. N Engl J Med. 2008;358:125–39. doi: 10.1056/NEJMoa070716. [DOI] [PubMed] [Google Scholar]
- 12.Arabi YM, Dabbagh OC, Tamim HM, Al-Shimemeri AA, Memish ZA, Haddad SH, et al. Intensive versus conventional insulin therapy: A randomized controlled trial in medical and surgical critically ill patients. Crit Care Med. 2008;36:3190–7. doi: 10.1097/CCM.0b013e31818f21aa. [DOI] [PubMed] [Google Scholar]
- 13.De La Rosa Gdel C, Donado JH, Restrepo AH, Quintero AM, Gonzalez LG, Saldarriaga NE, et al. Strict glycaemic control in patients hospitalised in a mixed medical and surgical intensive care unit: A randomised clinical trial. Crit Care. 2008;12:R120. doi: 10.1186/cc7017. [DOI] [PMC free article] [PubMed] [Google Scholar]
- 14.Finfer S, Chittock DR, Su SY, Blair D, Foster D, Dhingra V, et al. Intensive versus conventional glucose control in critically ill patients. N Engl J Med. 2009;360:1283–97. doi: 10.1056/NEJMoa0810625. [DOI] [PubMed] [Google Scholar]
- 15.Annane D, Cariou A, Maxime V, Azoulay E, D’Honneur G, Timsit JF, et al. Corticosteroid treatment and intensive insulin therapy for septic shock in adults: A randomized controlled trial. JAMA. 2010;303:341–8. doi: 10.1001/jama.2010.2. [DOI] [PubMed] [Google Scholar]
- 16.Knaus WA, Draper EA, Wagner DP, Zimmerman JE. Prognosis in acute organ-system failure. Ann Surg. 1985;202:685–93. doi: 10.1097/00000658-198512000-00004. [DOI] [PMC free article] [PubMed] [Google Scholar]
- 17.Preiser JC, Devos P, Ruiz-Santana S, Melot C, Annane D, Groeneveld J, et al. A prospective randomised multi-centre controlled trial on tight glucose control by intensive insulin therapy in adult intensive care units: The Glucontrol study. Intensive Care Med. 2009;35:1738–48. doi: 10.1007/s00134-009-1585-2. [DOI] [PubMed] [Google Scholar]
- 18.Krinsley JS, Preiser JC. Moving beyond tight glucose control to safe effective glucose control. Crit Care. 2008;12:149. doi: 10.1186/cc6889. [DOI] [PMC free article] [PubMed] [Google Scholar]
- 19.Dellinger RP, Levy MM, Carlet JM, Bion J, Parker MM, Jaeschke R, et al. Surviving Sepsis Campaign: international guidelines for management of severe sepsis and septic shock: 2008. Intensive Care Med. 2008;34:17–60. doi: 10.1007/s00134-007-0934-2. [DOI] [PMC free article] [PubMed] [Google Scholar]
- 20.Finney SJ, Zekveld C, Elia A, Evans TW. Glucose control and mortality in critically ill patients. JAMA. 2003;290:2041–7. doi: 10.1001/jama.290.15.2041. [DOI] [PubMed] [Google Scholar]


