Abstract
BACKGROUND AND OBJECTIVES:
Few studies have been conducted in Saudi Arabia to estimate the prevalence of visual impairment and its causes. The objective of this study was to estimate the prevalence of visual impairment, and identify its causes and associated factors among the adult population attending primary health care (PHC) centers in Aljouf province, in northern Saudi Arabia.
DESIGN AND SETTING:
A cross-sectional study during the year 2005 in PHC centers in Aljouf province in northern Saudi Arabia
PATIENTS AND METHODS:
A sample of 620 Saudi adults, of age 18 years and older, from the catchment area of the Aljouf PHC centers, were randomly selected through a multistage random sampling technique. Data were collected using a questionnaire about socioeconomic and related information and a visual acuity test was performed using the Snellen chart (E). Diagnosis was established according to World Health Organization (WHO) criteria. Visual impairment was categorized into blindness for a visual acuity of less than 3/60 (20/400, 0.05) in the better eye with the best correction and low vision for a best corrected visual acuity of less than 6/18 (20/60, 0.3) but not less than 3/60 (20/400, 0.05) in the better eye. Regression analysis was used to identify the predictors of visual impairment.
RESULTS:
Of 617 adult Saudis interviewed and examined, 269 (43.6%) were females. The mean (SD) age was 38.6 (16.2) years. The overall prevalence of visual impairment was 13.9% (95% CI: 11.4%-16.9%). The main medical causes of visual impairments were refractive errors (36.0%) followed by cataract (29.1%) and diabetic retinopathy (20.9%), and the least leading cause was glaucoma (5.8%). The most prominent determinants of visual impairment were age (P<.05), sex (P<.001), and a history of previous eye injury (P<.05).
CONCLUSION:
Prevalence of visual impairment in the study population from the Aljouf area is high. It is recommended that regular checks of visual acuity be conducted for all Saudis of age 50+ years, who attend the PHC centers.
Visual impairment is a major global health problem. The World Health Organization (WHO) estimated that there were 161 million persons worldwide with visual impairment, in the year 2002.1,2 The majority of them resided in developing countries, including Saudi Arabia.3 Visual impairment has remained a serious public health problem that has a huge and broad impact in the society, with serious socioeconomic loss.4 Moreover, visual impairment is usually associated with difficulties in physical function, emotional distress, and low socialization, as it affects all domains of the quality of life (personal, psychological, mobility, and social life).5 The WHO asserted that population-based data on the frequency of visual impairment are urgently needed as they are considered crucial for identifying the needs for treatment and rehabilitation services, planning, and implementing blindness prevention programs, and determining research priorities for different populations.6 Data about visual impairment in Saudi Arabia are scarce. A few studies were conducted two decades ago.7,8 However, the need for more recent data to help the decision-makers design, implement, and evaluate screening and intervention programs still exists. We conducted this study with the aim of measuring the magnitude of visual impairment in the adult population in the Aljouf province in northern Saudi Arabia near the Jordanian border. Our objective was to estimate the prevalence of visual impairment, and determine its causes and associated factors among Saudi adults attending PHC centers.
METHODS
Aljouf covers an area equal to 108 435 km2 , with a population of about 250 000. The Saudi tribes have different cultural habits, but most work on farms and raise sheep.9 Aljouf is an ideal area to study visual impairment because of its multi-tribal nature, and because the ophthalmic resources are still developing, and therefore, the natural history of the disease has not been altered. Health services in Aljouf are provided by the government, and include two general hospitals and 22 PHC centers. The PHC centers are the first health contact points for the population and they are required to be registered in the centers to be eligible to receive the services. These PHC centers are categorized, according to the density of the population, into three levels; A, B, and C. Level A centers serve more than 10 000 persons, level B serve 5000-10 000 persons, and level C serve less than 5000.10
All Saudi males and females who were 18 years old and older, and who were residents in Aljouf and attending the PHC centers were included in this cross-sectional study. They were estimated to be around 27 160 per month representing 52.3% of all people attending the centers per month.10 All those who were not residents of Aljouf, or who were younger than 18 years of age, or non-Saudi males and females were excluded.
The sample size was calculated using the Epi-Info program (CDC, Atlanta, Georgia, USA, 2002). Based on previous local studies,7,8 the prevalence of visual impairment was assumed to be 8% and the worst acceptable prevalence was chosen to be 11%. The sample size was calculated with 95% confidence levels and a power of 80%. Accordingly, the necessary sample size was calculated as 611, which was approximated to 620 individuals. A representative sample from each center required 291 individuals from level A centers, 198 individuals from level B centers, and 131 individuals from level C centers, with proportional allocation of adults to all individuals from each level. Through multistage sampling, two centers were selected by simple random sampling from each level, and then the number of individuals from each center was selected by systematic random sampling.
Data was collected from 1 March to 31 May 2005, using a questionnaire designed for collection of socioeconomic data: sex, age, level of education, occupation, marital status, and income. Other relevant information realted to visual impairment, such as general medical history, family history of eye problems, a history of eye trauma, and history of eye disease were recorded. In each health center the first author completed the questionnaire for each attendant, and measured the visual acuity for each eye using the Snellen chart at a distance of 6 meters. The Snellen chart had a capital letter ‘E’ facing in a different direction and the person being tested had to determine which direction the ‘E’ was pointing, (i.e., up, down, left, or right).
Visual acuity was recorded as the smallest line in which the patient could read the four letters correctly. If the person was unable to read the largest E letters in the chart at a distance of 3 meters, then finger counting was done at a distance of 1 meter. If the participant was able to see the examiners hand moving, ‘hand motion’ was recorded on the examination form. If the participant could not see the examiner's hand, a penlight was held in front of the participant's eye and he was asked if he could tell when the light was on. If the participant could correctly identify when the light was on, ‘light perception’ was recorded on the examination form. If the participant was unable to see the light, ‘no light perception’ was recorded. Care was taken to ensure that the unexamined eye was adequately covered. All patients with visual impairment were referred to the ophthalmic clinic in the general hospital. An ophthalmologist used his best judgment to identify the cause of visual impairment and the principal cause in each eye. When multiple disorders were present, the ophthalmologist identified the disorder causing the greatest limitation of vision.
A patient was considered to have visual impairment according to WHO criteria, which defined visual impairment as a visual acuity of less than 6/18 (20/70, 0.3) in the better eye with the best correction. Visual impairment was categorized into blindness and low vision. Blindness is a visual acuity of less than 3/60 (20/400, 0.05) in the better eye with the best correction. Low vision is defined as a best corrected visual acuity of less than 6/18 (20/70, 0.3) but not less than 3/60 (20/400, 0.05) in the better eye (WHO, 1992).11
Data were analyzed using the SPSS version 11 (SPSS for Windows, Released 11.0.1. 2001, SPSS Inc., Chicago, IL). Continuous variables were summarized as the means (SD) and categorical variables as frequencies and percentages. The chi-square test was used to determine the association of visual impairment with different variables. Multivariate analysis using stepwise logistic regression analysis was used to determine factors associated with visual impairment. The association of a particular variable was expressed as the odds ratio (OR) with a 95% confidence interval (95% CI). A two-tailed P value of <.05 was considered statistically significant.
The Research Committee at the Joint Programs of Family and Community Medicine approved the study. Permission from the General Directorate of Health Affairs in Aljouf was granted to conduct the study. Informed consent from the participants was considered a prerequisite for their inclusion in the study. Any patient found to have visual impairment was treated in the general hospital.
RESULTS
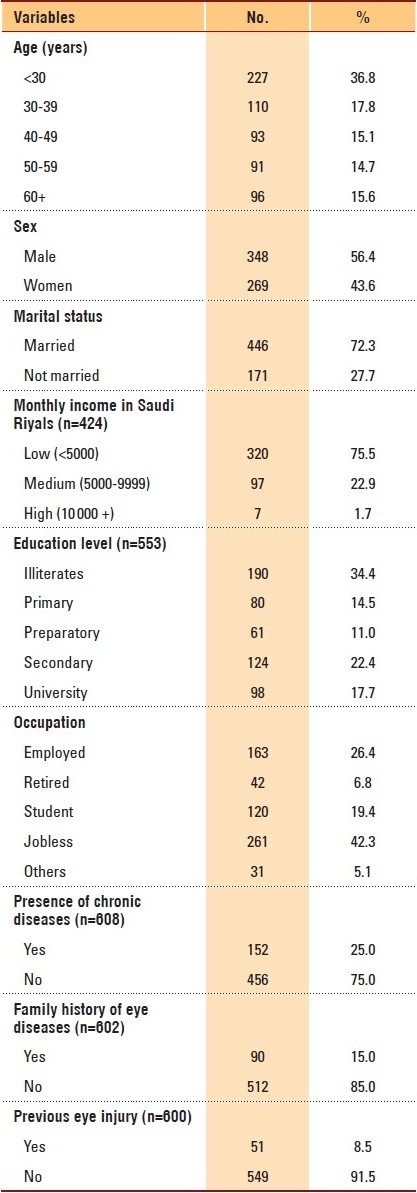
The 617 Saudi adults who participated in the study had a mean (SD) age of 38.6 (16.2) years. There was a slight preponderance of males (56.4%) and low income participants (75.5%). Of all the participants, illiterates formed about half (48.9%), the jobless constituted 42.3%, 25.0% had chronic diseases, 15% had a family history of eye diseases, and a minority (8.5%) had a history of previous eye injury (Table 1).
Table 1.
Characteristics of the participants in the visual acuity survey, Aljouf province, Saudi Arabia (n=617 unless otherwise noted).
The majority of participants (86.1%) had visual acuity within normal limits according to the WHO definition, and those who had visual impairment constituted 13.1% in addition to only five participants (0.8%) who were blind. As the number of blind participants was very minimal, and because it was considered as a subset of visual impairment, the overall prevalence of visual impairment was considered to be 13.9% (95% CI: 11.4%-16.9%). Significantly (P<.05), the prevalence of visual impairment increased with age. Among the less than 30-year-old participants, only 15 (6.6%) had visual impairment, while 30.2% of the over 60-year-old participants had visual impairment. Visual impairment was higher among the illiterate (21.6%), females (18.2%), married (16.4%), retired (21.4%), and jobless participants (21.8%), and among those with a history of eye disease (20%), previous eye injury (33.3%), and chronic diseases (30.3%) (Table 2).
Table 2.
Prevalence of visual impairment by some characteristics of the participants in the visual acuity survey, Aljouf, Saudi Arabia (n=617 unless otherwise noted).
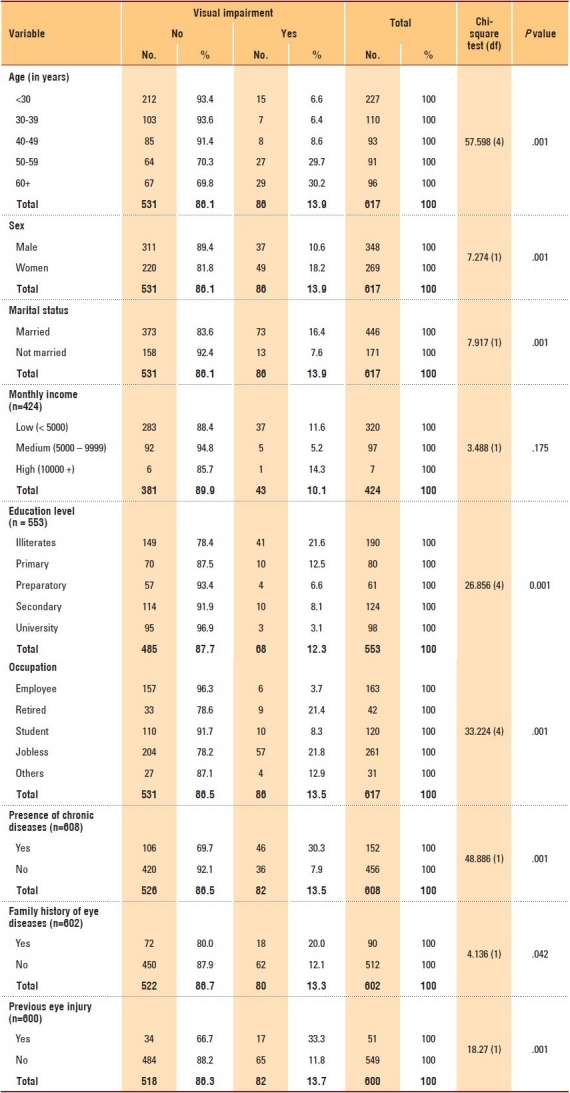
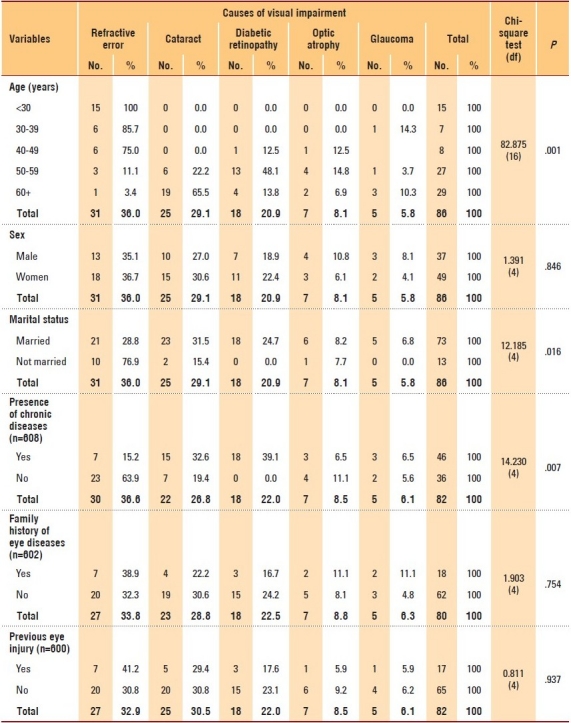
Figure 1 illustrates that refractive error was the most common cause of visual impairment (36%), followed by cataract (29.1%), then diabetic retinopathy (20.9%), and finally glaucoma (5.8%). Refractive error was the sole cause of visual impairment in the age group of <30 years (93.6%) (P<.05), while the main cause among patients aged 50 to 59 years was diabetic retinopathy (48.1%), and the main cause among the elderly patients aged over 60 years was cataract (65.5%) (Table 3). The main cause among patients who had chronic disease was diabetic retinopathy (39.1%) followed by cataract (32.6%). On the other hand, the main cause among those who had no chronic disease was refractive error (63.9%). These associations were statistically significant (P<.05) (Table 3).
Figure 1.
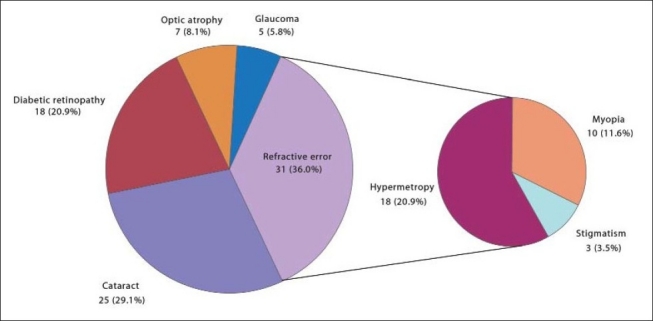
Causes of visual impairment among the participants in the visual acuity survey, Aljouf, Saudi Arabia.
Table 3.
Causes of visual impairment according to some characteristics of the participants in the visual acuity survey (n=617 unless otherwise noted).
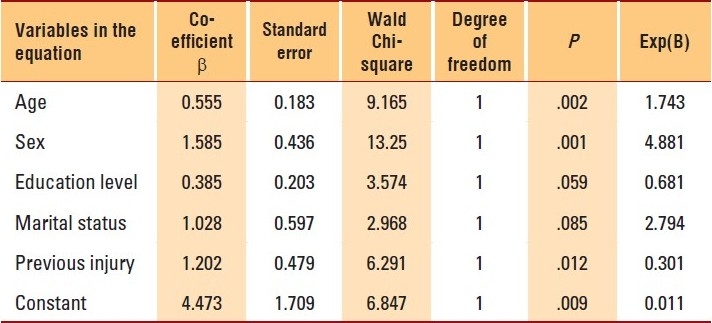
The predictors of visual impairment were age (P<.05) and sex (P<.001) (Table 4). The probability of developing visual impairment was more in females than males and it increased with increase in age. Also, any previous injury to the eye was a significant predictor for visual impairment (P<.05).
Table 4.
Stepwise logistic regression analysis showing predictors of visual impairment among the participants in the visual acuity survey.
DISCUSSION
To our knowledge this is the first study on the prevalence of visual impairment in Saudi Arabia in about two decades. The study showed that the prevalence of blindness according to the WHO criteria was 0.8%. This figure was within the range of the estimated global prevalence of blindness.1,2 The Middle Eastern crescent (as defined by the World Bank) has an overall prevalence of blindness of 0.7%.3 A survey conducted in the eastern province of Saudi Arabia revealed the prevalence of blindness to be 1.5%.7 Another survey conducted in the south western province of Saudi Arabia showed the prevalence of blindness to be 0.7%.8 In the Republic of Yemen, a limited survey in 1989, estimated the prevalence of blindness to be 0.7%.12 A population-based study conducted in Lebanon estimated the prevalence of blindness to be 0.6%.13 In Oman, the prevalence of blindness was found to be 1.1%.14 The Tehran Eye Study, a population-based survey, estimated the prevalence of blindness to be 0.28%.15 The Pakistan National Blindness and Visual Impairment Survey estimated the prevalence of blindness to be 3.4%.16
Overall, 86 (13.9%) of the participants had visual impairments in our study. This was higher than what was estimated in the two surveys conducted in Saudi Arabia about two decades ago. Tabara et al,7 in a community-based survey found that 7.8% of the Saudi population had visual impairments in addition to 1.5% who were blind. Furthermore, Al Faran et al.,8 in a PHC center-based survey found that the prevalence of visual impairment among Saudis was 10.9%. However, the comparison between this study and the previous ones should be treated with caution, as the results are very sensitive to the difference in methodologies. Generally, there was an increasing trend of the prevalence of visual impairment in older individuals. This finding was consistent with several studies, as stated by Abo-Gareeb et al., in their meta-analysis.17
The prevalence of visual impairment was significantly higher among females (18.2%) compared to males (10.6%) (P<.01). This finding was in agreement with several studies.18,19 The Melbourne study (2003) showed that females were more susceptible than males to the diseases that caused visual impairment.18 This sex imbalance could be attributed to differences in mortality rate, because females are known to have higher life expectancies than males, so they were more prone to get diseases associated with aging, which would be reflected either directly or indirectly on the occurrence of ocular diseases. This had been supported by McCarthy et al.19 However, further studies are needed to determine sex differences in visual impairment, which could have implications for effective health service delivery.
The current study showed that refractive error is the leading cause of visual impairment and that it steadily declines with age. This finding was consistent with other cross-sectional studies that showed that older persons tended to have lower rates of myopia than younger persons.20–23 This remarkable decline could be explained by the fact that the estimated occurrences for causes of visual impairments in our study were based on the proportion of each cause in relation to all other causes, so the proportions of refractive errors were relatively decreasing in older ages due to the concomitant causes (e.g., cataract and glaucoma). In addition, Katz et al21 suggested that the prevalence of myopia increased during the middle decades of the twentieth century. Those born in the earlier decades were not as heavily exposed to putative myopiagenic factors, such as near work, and therefore, had a lower prevalence compared to the younger, more myopic generations, with greater near-work demands.
The current study showed that cataract (29.1%) was the second main cause of visual impairment; this figure was comparable to that found in several studies.15,24–27 In England, a study conducted to evaluate the causes of visual impairment found that almost one-third of all visually impaired cases were attributed to cataract.24 Our figure was also consistent with the findings of the Tehran study, where they found that cataract accounted for 25.4% of all cases of visual impairment.15 In Canada, cataract accounted for 15% of all cases of blindness.26 In the Baltimore eye survey, blindness was caused by cataracts among 13% of the elderly white subjects and among 39% of the elderly black subjects.27 The factor thought to be strongly associated with increased risk of cataract in Saudi Arabia was exposure to UV-B light.8
The study showed that diabetic retinopathy (20.9%) was the third main common cause of visual impairment, and it was obvious that its prevalence reached its peak among patients of age 50 to 59 years. This finding was in agreement with Klein et al., (1994) that among diabetics, the prevalence of retinopathy may range from 22% to 49%.28
The mean (SD) age of the study group of 38.6 (16.2) years is considered relatively young. The study showed that the least recorded cause of visual impairment was glaucoma (5.8%). This finding was consistent with what was found in the Tehran study where they found that only 4.3% of the visually impaired patients had glaucoma as the main cause of impairment.15 The figures in the current study reflect the prevalence among the attendants of the PHC centers. Being an attendant of the PHC center increases the likelihood of having health problems that might be associated with visual impairments, leading to selection bias. Furthermore, one physician measured visual acuity and one ophthalmologist determined the cause of visual impairment and this might limit the accuracy of the diagnosis.29 Based on the findings of the current study it is recommended that all Saudis aged 50 plus years, who attend PHC centers be screened for visual acuity. However, more studies are needed in other regions of Saudi Arabia before such a recommendation can be adopted nationally.
Acknowledgments
We would like to thank the participants for giving some of their valuable time in responding to our questions and examinations and the Directors of PHC centers and the Hospital for their cooperation. We are grateful to the reviewers for their help in improving our work through their constructive comments.
REFERENCES
- 1.Resnikoff S, Pascolini D, Etyáale D, Kocur I, Pararajasegaram R, Pokharel GP, et al. Global data on visual impairment in the year 2002. Bull World Health Organ. 2004;82:844–5. [PMC free article] [PubMed] [Google Scholar]
- 2.Pascolini D, Mariotti SP, Pokharel GP, Pararajasegaram R, Etyáale D, Negrel AD, et al. 2002 global update of available data on visual impairment: A compilation of population-based prevalence studies. Ophthalmic Epidemiol. 2004;11:67–115. doi: 10.1076/opep.11.2.67.28158. [DOI] [PubMed] [Google Scholar]
- 3.Tabbara KF. Blindness in the eastern Mediterranean countries. Br J Ophthalmol. 2001;85:771–7. doi: 10.1136/bjo.85.7.771. [DOI] [PMC free article] [PubMed] [Google Scholar]
- 4.Taylor HR, Pezzullo ML, Nesbitt SJ, Keeffe JE. Costs of Interventions for Visual Impairment. Am J Ophthalmol. 2007;143:561–5. doi: 10.1016/j.ajo.2006.10.055. [DOI] [PubMed] [Google Scholar]
- 5.Broman AT, Munoz B, Rodriguez J, Sanchez R, Quigley HA, Klein R, et al. The impact of visual impairment and eye disease on vision-related quality of life in a Mexican-American population: Proyecto VER. Invest Ophthalmol Vis Sci. 2002;43:3393–8. [PubMed] [Google Scholar]
- 6.The World Health report: Life in the 21st century a vision for all. Geneva: WHO; 1998. World Health Organization; p. 47. [Google Scholar]
- 7.Tabara KF, Ross-Degnan D. Blindness in Saudi Arabia. JAMA. 1986;255:337–84. [PubMed] [Google Scholar]
- 8.Al Faran MF, Al-Rajhi AA, Al-Omanr OM, Al-Ghamdi SA, Jabak M. Prevalence and causes of visual impairment and blindness in the south western region of Saudi Arabia. Int Ophthalmol. 1993;17:161–5. doi: 10.1007/BF00942931. [DOI] [PubMed] [Google Scholar]
- 9.Al Falah M. Aljouf At the end of 20th century. Isreal: Bisan publisher; 2000. Skaka. [Google Scholar]
- 10.Statistical Year Book of 2004. Riyadh, Saudi Arabia: Ministry of Health Publication; 2006. Ministry of Health. [Google Scholar]
- 11.The 10th revision (ICD 10) Vol. 1. Geneva: WHO; 1992. World Health Organization. International statistical classification of diseases and related health problems. [Google Scholar]
- 12.Thylefors B, Negrel AD, Pararajasegaram R, Dadzie KY. Global data on blindness. Bull World Health Organ. 1995;73:115–21. [PMC free article] [PubMed] [Google Scholar]
- 13.Mansour AM, Kassak K, Chaya M, Hourani T, Sibai A, Alameddine MN. National survey of blindness and low vision in Lebanon. Br J Ophthalmol. 1987;81:905–7. doi: 10.1136/bjo.81.10.905. [DOI] [PMC free article] [PubMed] [Google Scholar]
- 14.Khandekar R, Mohammed AJ, Negrel AD, Al Riyami A. The prevalence and causes of blindness in the Sultanate of Oman: The Oman Eye Study (OES) Br J of Ophthalmol. 2002;86:957–62. doi: 10.1136/bjo.86.9.957. [DOI] [PMC free article] [PubMed] [Google Scholar]
- 15.Fotouhi A, Hashemi H, Mohammad K, Jalali KH. The prevalence and causes of visual impairment in Tehran: The Tehran Eye Study. Br J Ophthalmol. 2004;88:7405. doi: 10.1136/bjo.2003.031153. [DOI] [PMC free article] [PubMed] [Google Scholar]
- 16.Jadoon MZ, Dineen B, Bourne RR, Shah SP, Khan MA, Johnson GJ, et al. Prevalence of blindness and visual impairment in Pakistan: The Pakistan national blindness and Visual impairment survey. Invest Ophthalm Vis Sci. 2006;47:4749–55. doi: 10.1167/iovs.06-0374. [DOI] [PubMed] [Google Scholar]
- 17.Abou-Gareeb I, Lewallen S, Bassett K, Courtright P. Sex and blindness: A meta-analysis of population-based prevalence surveys. Ophthalmic Epidemiol. 2001;8:39–56. doi: 10.1076/opep.8.1.39.1540. [DOI] [PubMed] [Google Scholar]
- 18.Dimitrov PN, Mukesh BN, McCarty CA, Taylor HR. Five-Year incidence of bilateral cause-specific visual impairment in the melbourne visual impairment project. Invest Ophthalmol Vis Sci. 2003;44:5075–81. doi: 10.1167/iovs.02-0457. [DOI] [PubMed] [Google Scholar]
- 19.McCarty CA, Mukesh BN, Dimitrov PN, Taylor HR. The incidence and progression of cataract in the Melbourne Visual Impairment Project. Am J Ophthalmol. 2003;136:10–7. doi: 10.1016/s0002-9394(02)01844-5. [DOI] [PubMed] [Google Scholar]
- 20.Wong TY, Foster PJ, Hee J. Prevalence and risk factors for refractive errors in adult Chinese in Singapore Invest Ophthalmol Vis Sci. 2000;41:2486–94. [PubMed] [Google Scholar]
- 21.Katz J, Tielsch JM, Sommer A. Prevalence and risk factors for refractive errors in an adult inner city population. Invest Ophthalmol Vis Sci. 1997;38:334–40. [PubMed] [Google Scholar]
- 22.Wensor M, McCarty CA, Taylor HR. Prevalence and risk factors of myopia in Victoria, Australia. Arch Ophthalmol. 1999;117:658–63. doi: 10.1001/archopht.117.5.658. [DOI] [PubMed] [Google Scholar]
- 23.Schellini SA, Durkin SR, Hoyama E, Hirai F, Cordeiro R, Casson RJ, et al. Prevalence and causes of visual impairment in a Brazilian population: The Botucatu Eye Study. BMC Ophthalmol. 2009;9:8. doi: 10.1186/1471-2415-9-8. [DOI] [PMC free article] [PubMed] [Google Scholar]
- 24.McCarty CA, Nanjan MB, Taylor HR. Attributable risk estimates for cataract to prioritize medical and public health action. Invest Ophthalmol Vis Sci. 2000;41:3720–5. [PubMed] [Google Scholar]
- 25.West SK, Mutoz B, Istre J, Rubin GS, Friedman SM, Fried LP, et al. Mixed lens opacities and subsequent mortality. Arch Ophthalmol. 2000;118:393–7. doi: 10.1001/archopht.118.3.393. [DOI] [PubMed] [Google Scholar]
- 26.Maberley DA, Hollands H, Chuo J, Tam G, Konkal J, Roesch M, et al. The prevalence of low vision and blindness in Canada. Eye. 2006;20:341–6. doi: 10.1038/sj.eye.6701879. [DOI] [PubMed] [Google Scholar]
- 27.Sommer A, Tielsch JM, Katz J. Racial differences in the cause-specific prevalence of blindness in East Baltimore. N Engl J Med. 1991;325:1412–7. doi: 10.1056/NEJM199111143252004. [DOI] [PubMed] [Google Scholar]
- 28.Klein R, Klein BE, Moss SE, Cruickshanks KJ. Relationship of hyperglycemia to the long-term incidence and progression of diabetic retinopathy. Arch Intern Med. 1994;154:2169–78. [PubMed] [Google Scholar]
- 29.Taylor HR, Livingston PM, Stanislavsky YL, McCarty CA. Visual impairment in Australia: Distance visual acuity, near vision, and visual field findings of the Melbourne Visual Impairment Project. Am J Ophthalmol. 1997;123:328–37. doi: 10.1016/s0002-9394(14)70128-x. [DOI] [PubMed] [Google Scholar]


