

Abstract
The extracellular matrix contains components with remarkable mechanical properties, including fibronectin (Fn) fibers with extensibilities of >700% strain. We utilized what we consider a novel technique to quantify the extent of molecular unfolding that contributes to Fn fiber extension, and we compared this behavior with stochastic models of Fn fibers with different molecular arrangements. In vitro unfolding as a function of strain was measured by fluorescently labeling cysteines in modules FnIII7 and III15 in artificial Fn fibers. A calibration technique we also consider novel made it possible to demonstrate that 44% of cysteines in these modules were exposed in Fn fibers strained to 421% extension, up from 8% exposure without strain. In silico unfolding was measured by applying a constant strain rate to a fiber represented by a network of wormlike chain springs, each representing an individual Fn molecule. Unfolding rates were calculated with a tension-dependent stochastic model applied to FnIII modules in each molecule. A comparison of these approaches revealed that only a molecular arrangement permitting unequal mechanical loading of Fn molecules recapitulates in vitro unfolding. These data have implications for Fn-dependent mechanotransduction and give insight into how the molecular architecture of natural materials permits such remarkable extensibility.
Introduction
Cells are very sensitive to their mechanical environment, which is defined by properties such as stiffness and the density and spacing of adhesive molecules (1). In vivo, these properties are often defined by the supermolecular fibrous structures that constitute the extracellular matrix (ECM). Based on its requirement in development and potential role in processes such as cancer metastasis (2,3), fibronectin (Fn) is one such ECM structure that may be critical in defining the local microenvironmental properties of cells in vivo. Using an artificial Fn fiber platform as a model of native Fn matrix, it was shown that Fn fibers can be reversibly extended beyond 700% strain and have a nonlinear rigidity that increases from ∼50 kPa in the fully relaxed state to >1 MPa at breakage (4). These data support speculation that strain-dependent alterations in molecular architecture could impact cell behavior through a number of mechanisms (5), including alterations in integrin binding (6), changes in the density or topography of cell adhesion domains, and direct cellular sensation of fiber rigidity. Indeed, the strain-dependent bioactivity of Fn fibers was recently demonstrated by the disruption of the binding of a bacterial adhesin to Fn fibers (7), and binding of both albumin and the L8 monoclonal antibody to Fn fibers is strain-dependent (8,9).
Fn fiber properties could potentially be altered by strain through a number of mechanisms. Fn is a large, dimeric glycoprotein that has the form of a linear chain of modules that have folded structures of type FnI, FnII, or FnIII. Note that 1), Fn fibers could extend through molecular chain extension into a reduced entropy state (10–12), and 2), FnIII modules are not stabilized by disulfide bonds and may be mechanically unfolded (13–15). It has been shown in single-molecule force spectroscopy experiments that the globular FnIII domains will unfold when given sufficient applied load or time (10,16). The most direct evidence that Fn extension is concomitant with module unfolding utilized an adaptation of a published cysteine shotgun approach (17) to fluorescently-label-exposed cysteines in FnIII7 and III15 modules using maleimide chemistry (4). With this approach, stretched Fn fibers became progressively labeled with maleimide-conjugated Alexa fluorophores with strain, indicating labeling of the fluorophores to free cysteines within FnIII7 and III15 (4). However, a major limitation of this approach was that it was not calibrated against the total amount of available cysteines within the fiber. Thus, the increase in fluorescent labeling resulting from cysteine exposure could have been attributed to only a small fraction of the total cysteines.
Although it is ultimately necessary to determine how the properties of single molecules affect the collective mechanical behavior of supermolecular structures, it is also necessary to understand how individual molecules associate with adjacent partners in the fiber to form structures that are many micrometers long. In addition to controlling its mechanical properties, this molecular arrangement would determine the topographical spacing of integrin ligands and growth factor binding sites on the surface of the Fn matrix—both properties that fundamentally influence cell behavior (18,19). Much of our understanding of Fn/Fn binding sites was derived from studies of Fn matrix assembly (recently reviewed in Singh et al. (20)).
Here, a general model suggests that the 70-kDa amino-terminal domains of separate dimeric molecules interact in an antiparallel orientation, as has been suggested by labeling Fn fibrils with colloidal gold (21). Fn/Fn binding sites in modules FnIII1-2, III4-5, and III12-14 may also permit association of Fn fibrils with one another (20). A single molecule of Fn in solution is stabilized into a compact conformation through interaction of FnIII12-14 on one subunit with FnIII2-3 of the other subunit (11), and it is thus logical to speculate that these sites may also interact with one another on adjacent molecules within an Fn fiber. However, the relative contribution of each of these Fn/Fn binding interactions has not been determined within the context of Fn fibers.
The two objectives of this research were to quantify the extent of FnIII7 and III15 module unfolding in stretched Fn fibers both in vitro and in silico and use these data to infer the molecular architecture of Fn molecules within the fiber. Unfolding of Fn modules was investigated with what we consider a novel calibration technique to convert FnIII7 and III15 fluorescence into a quantification of the total percentage of these modules that have been disrupted to permit fluorophore binding. This approach was then compared to a computational model of Fn fiber extension. The computational model considers each Fn molecule as an entropic spring composed of individual modules that may unfold according to a Monte Carlo simulation. A comparison of these approaches revealed that only a molecular arrangement permitting unequal mechanical loading of Fn molecules recapitulates the in vitro mechanical and biochemical properties measured using stretched, artificial Fn fibers.
Methods
Fn labeling
Fn was isolated from human serum using a previously published two-step chromatography process (13). The ratiometric imaging used in this experiment required two preparations of fluorescently-labeled Fn. One preparation was labeled on amines with Alexa 488 succinimidyl ester (Alexa 488-SE; Invitrogen, Carlsbad, CA) by incubating the Fn solution with a 70-fold molar excess of Alexa 488-SE for 1 h and then separating the labeled Fn from free dye using a size exclusion chromatography column (PD-10 column; GE Healthcare, Waukesha, WI). The second Fn preparation was labeled on the cryptic cysteines in modules FnIII7 and III15 with Alexa 633 maleimide (Invitrogen) by incubating Fn for 1 h with a 30-fold molar excess of Alexa 633 maleimide in a 4 M GdmHCl solution to denature the folded modules, followed by separation of free dye and denaturant from Fn with a PD-10 column (GE Healthcare). Fn labeling in the presence of Alexa 633 maleimide but without denaturant led to binding of <0.5 fluorophores per Fn molecule (data not shown), indicating that the cysteines are not exposed in solution in the absence of a denaturant. Fn concentrations and labeling ratios were characterized with a spectrometer (NanoDrop 2000; Thermo Fisher Scientific, Waltham, MA) using published methods (13).
A third Fn preparation was then generated for calibrating our ratiometric technique by incubating Fn with 0.2 M iodoacetamide (Acros Organics, Geel, Belgium) in 4 M GdmHCl for 2.5 h, followed by separation of iodoacetamide and denaturant from Fn with a PD-10 column. Iodoacetamide treatment has been shown to block cysteines in Fn from reacting with maleimide-conjugated fluorophores (4).
Substrate preparation and Fn fiber deposition
Thin films of textured polydimethylsiloxane (PDMS) substrates with 20-μm-tall ridges were prepared using soft lithography molding as described in Klotzsch et al. (4). A master mold was prepared by photolithography using SU-8 20 resist (MicroChem, Newton, MA) on a silicon wafer. PDMS (Sylgard 184; Dow Corning, Midland, MI) was cast over the master mold to make a negative stamp of the desired 20-μm ridge features. This stamp was then made inert by plasma treatment (PDC-001; Harrick Plasma, Ithaca, NY) at 30 W for 30 s immediately followed by exposure to tetrafluorosilane vapor (Alpha Aesar, Haverhill, MA) in a vacuum chamber for 30 min. A drop of PDMS was placed between this stamp and a thin (0.005″) PDMS sheet (Specialty Manufacturing, http://www.specmfg.com) to produce a thin film of ridges on a deformable substrate. Next, the substrate was exposed to plasma at 30 W for 30 s, aminosilane vapor (Acros Organics) in a vacuum chamber for 30 min, and finally 0.125% glutaraldehyde (Acros Organics) solution for 30 min before being washed three times with distilled water and dried. The result of this preparation is a PDMS surface that is reactive with amines, thus forming covalent bonds with Fn fibers deposited on the surface as described in Klotzsch et al. (4).
The PDMS sheet with the thin film of microfabricated trenches was placed in a previously described, custom one-dimensional strain device (9,13) for deposition of artificial Fn fibers (9,22,23). A drop of Fn in phosphate-buffered saline (PBS) at a concentration of ∼1 mg/ml was placed next to the features. A needle was used to draw the Fn from the air/water interface of the drop, and fibers ranging from 1 μm to 5 μm in diameter and up to 1 cm in length were then deposited and attached to the substrate on contact. The Fn fibers and PDMS surface were then blocked with 0.5% bovine serum albumin (BSA) in PBS for 15 min. Finally, fibers submerged under a drop of PBS were stretched or relaxed before imaging. Because it has been shown that deposited artificial Fn fibers are prestretched by 140% strain (4), substrate stretch could be used to generate Fn fibers with 140–550% strain. Alternatively, fibers were deposited on prestretched PDMS sheets and then relaxed down to 0% strain.
Image acquisition and analysis
First, Fn fibers on ridge substrates were used to calibrate a ratio of fluorescence to the average cysteine exposure per Fn molecule within Fn fibers. To do this, Fn fibers were pulled from drops of Fn solution that contained 0.02 mg/ml of Fn labeled with 16 Alexa-488 fluorophores per Fn molecule, 0–0.8 mg/ml unlabeled Fn, and 0–0.6 mg/ml iodoacetamide-treated Fn. The amounts of unlabeled Fn and iodoacetamide-treated Fn were adjusted so that the total ratio of Alexa-488 labeled amines per Fn molecule was constant at 0.5 in all fibers. The fluorescence intensity of Alexa 488 in each image could therefore be used as an indication of the total Fn mass in each pixel, independent of fiber diameter or strain. These fibers were then labeled with a solution of 4 M GdmHCl and 0.06 mg/ml Alexa 633 maleimide for 1 h. Control experiments using a wide range of incubation times and labeling concentrations showed that this incubation time and Alexa 633 maleimide concentration were sufficient to saturate any available binding sites (data not shown). The fibers were then thoroughly rinsed and incubated in a solution of 4 M GdmHCl for 4 h to wash away nonspecifically bound dye.
Next, two fluorescent images were acquired of each fiber with 608–648 nm excitation and 672–712 nm emission (for Alexa 633) and 457–487 nm excitation and 510–540 nm emission (for Alexa 488) on a model No. IX81 microscope (Olympus America, Melville, NY) with an ORCA R2 camera (Hamamatsu, Hamamatsu City, Japan). The optical system was characterized by creating a calibration curve relating the ratio of pixel intensities of cysteine-bound Alexa 633 (ICys) to pixel intensities of lysine-bound Alexa 488 (ILys) using fibers of known Alexa 633 to Alexa 488 labeling ratios (MCys/MLys) where MCys and MLys are the average number of fluorophores per Fn molecule bound to cysteines or lysines, respectively. MCys was derived based on the assumption that all free cysteines were labeled by Alexa 633 maleimide in the presence of denaturant. Note that these values were averages for the entire fiber (i.e., MLys was constant at 0.5 for all fibers and MCys ranged from 0.12 to 4.0). A least-squares fit of the calibration curve to Eq. 1 was used to find the calibration parameters α and β according to
| (1) |
After generating the calibration curve, Fn fibers were deposited from drops that contained 0.02 mg/ml of Fn labeled with 16 Alexa-488 fluorophores per Fn molecule and 0.8 mg/ml unlabeled Fn. After blocking the fibers with BSA, the fibers were incubated with 0.06 mg/ml Alexa 633 maleimide for 10 min. Excess dye was washed away and the fibers were imaged as described above. This labeling procedure was then repeated for fibers over a wide range of strains. The illumination intensity was fixed for all fibers while exposure time was varied from 12.5 to 2000 ms to maximize the intensity of fibers. Control experiments showed that fiber intensity is a linear function of exposure time within this range (data not shown).
The resulting images were normalized by exposure time and analyzed using custom software written in MATLAB (The MathWorks, Natick, MA) to subtract the image background, threshold the image to pixels brighter than the background plus 10 SDs, and divide the pixel intensities of the cysteine-labeled images by the corresponding pixel intensities of the lysine-labeled images in a region of interest drawn around each fiber. In this way the cysteine intensity is normalized by the number of Fn molecules in the pixel giving a quantitative measure of cysteines labeled per Fn molecule, using Eq. 2 where MLys is the labeling ratio of Alexa 488 on lysines to Fn that was determined when making the drop:
| (2) |
Computational model of Fn fiber extension
A one-dimensional model of Fn fibers was written in MATLAB to relate published single-molecule force spectroscopy data to the bulk properties of Fn fibers. Individual molecules, connected to one another at nodes, were modeled as wormlike chains (24,25). The force, f, being exerted on each molecule was modeled using the equation
| (3) |
where kB is the Boltzmann constant, T is temperature, A is the persistence length of the molecule, L is the contour length, and z is the end-to-end length. The potential energy, U, of each individual molecule as a function of node positions was found by integrating Eq. 3 and then summing the potential energy for all molecules i to generate
| (4) |
At each strain position the equilibrium positions of the nodes connecting Fn molecules were found by minimizing the potential energy of the system with respect to node position using a built-in minimization function in MATLAB (fmincon) with an interior point algorithm. Stopping tolerances were determined empirically by verifying convergence (described below). The initial condition for the minimizer was the solution of the node positions from the previous time step. After finding the equilibrium position of the nodes, the tension of each molecule was found and the probability of unfolding, Pu, as a function of force (26) was calculated according to
| (5) |
where k0u is the unfolding rate in the absence of force, and Δxu is the projected bond displacement at rupture. These values were obtained or estimated from published single-molecule experiments (16). Next, a random number was generated to test each module for unfolding. Each molecule was given a starting contour length of 120 nm (27); however, each unfolding event increased the contour length by 28.5 nm, in accordance with the difference in length of a 32-nm-long unfolded module (28) and the 3.5 nm end-to-end length of the folded domain (29). The persistence length of this newly unfolded domain was adjusted to 0.42 nm, in accordance with published persistence length values of unfolded amino-acid chains (16).
The values for parameters k0u and Δxu were obtained from dynamic force spectroscopy studies of FnIII1, 2, 10, and 13 (16). When the only available data were the most likely unfolding force, the parameters were estimated to maintain the hierarchy of FnIII module strength (modules III12 (16); T-FnIII3 (30)). Parameters for FnIII7, 8, 9, and 14 were estimated from steered molecular dynamics simulations that were scaled so the module strength hierarchy is consistent with published dynamic force spectroscopy data (31). FnIII modules for which no data exist on unfolding rate were not allowed to unfold in the simulation. The fiber stretch was simulated with a constant extension rate of 12 μm/s in 20,000 steps of 0.582 nm/step (48.5 μs/step) on a PC with Dual 2.8 GHz Quad Core Intel Xeon processors (Intel, Santa Clara, CA).
Results
Fn fiber stretch in vitro
To provide a quantitative description of the extent of molecular unfolding in FnIII domains as a function of fiber stretch, we compared the unfolding behavior of these modules during fiber stretch both in vitro and in silico. To quantify the extent of unfolding in modules FnIII7 and III15 in vitro, we utilized a previously described system for depositing artificial Fn fibers on stretchable surfaces that can be used to tune fiber strain from 0 to >500% strain (9). Artificial Fn fibers were used because their axial strain can be controlled precisely and the sample does not contain other ECM or cell surface proteins that may contain free cysteines that would complicate the analysis of Alexa 633 maleimide binding (as in Sahaf et al. (32)). Furthermore, artificial Fn fibers can be freely suspended across trenches that eliminate the complications of fiber contact with a surface and surface background fluorescence.
To quantify the percentage of FnIII7 and III15 modules that become exposed within stretched Fn fibers, we developed a calibration technique to relate the ratio of fluorescence of cysteine-bound fluorophores versus amine-bound fluorophores to the number of cysteines that were labeled per Fn molecule. Fn fibers were drawn from drops of solution that contained a constant ratio of 0.5 mol Alexa 488 per mole of Fn so that the Alexa 488 fluorescence was indicative of the mass of Fn in each image pixel. Fn containing cysteines that were blocked with iodoacetamide in denaturant solution, and hence inaccessible to labeling with Alexa 633 maleimide, was also added to the drops, and hence to the fibers, over a range of 0–97% iodoacetamide-treated Fn. The remaining Fn in the solutions used to produce the Fn fibers was unlabeled. These fibers were then labeled with a solution of 4 M GdmHCl and 0.06 mg/ml Alexa 633 maleimide for 1 h.
GdmHCl was included to denature Fn within the fiber and thus expose and make available the free cysteines within the Alexa-488 labeled Fn and unlabeled Fn for labeling with Alexa 633 maleimide. By doping the fibers with the different concentrations of iodoacetamide-treated Fn, we were able to tune the amount of labeled cysteines per Fn molecule over a wide range. Next, images of Alexa 488 (Fig. 1, A and C) and Alexa 633 fluorescence (Fig. 1, B and D) were acquired for each fiber, and the mean ratio of Alexa 633 to Alexa 488 fluorescence (ICys/ILys) was determined for all pixels in each fiber. ICys/ILys was plotted versus the number of Alexa 633-labeled cysteines per Fn dimer (Fig. 1 E). A linear fit to the data provides a calibration factor that relates the total number of labeled cysteines per Fn dimer to ICys/ILys. Control experiments measuring ICys/ILys for the same fiber over a wide range of strains showed that this ratio was independent of strain (data not shown).
Figure 1.
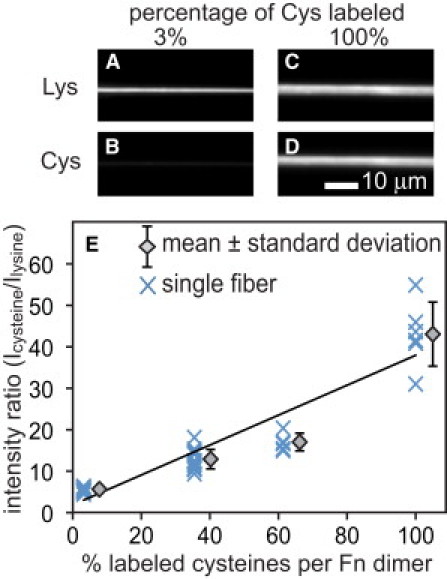
Artificial Fn fibers were pulled from the air/water interface of Fn solutions containing 0.5 mol Alexa 488 per mole Fn and a range from 97% (A and B) to 0% iodoacetamide-treated Fn and deposited across microfabricated trenches. Fibers were next treated with Alexa 633 maleimide in 4 M GdmHCl to label all free cysteines that became exposed in the presence of denaturant. Fluorescent images of Alexa 488 bound to lysines (A and C) and cysteine-bound Alexa 633 emission (B and D) were used to generate a mean ratio of Alexa 633 to Alexa 488 pixel intensities (ICys/ILys) for each fiber and plotted versus the total number of labeled cysteines per Fn molecule (E). (Data points) Individual fibers (X) at each of four different percentages of iodoacetamide treated preparations. (Diamonds) Mean ± SD for each fiber cysteine labeling ratio. (Line) Least-squares linear regression to the data.
Next, Fn fibers were drawn from drops of Fn solution that contained only Alexa 488-Fn and unlabeled Fn and deposited across the textured strain device surface. After blocking fibers with BSA and stretching the fibers to the desired strain level, the samples were incubated with Alexa 633 maleimide in PBS solution to label any exposed cysteines. After rinsing the sample, the fibers were imaged and ICys/ILys was averaged over all pixels in each of 124 fibers. Fig. 2, A–D, shows images of Alexa 488 (Fig. 2, A and C) and Alexa 633 (Fig. 2, B and D) intensities of two fibers at 0 and 515% strain. ICys/ILys was converted into the number of labeled cysteines per Fn dimer and plotted versus Fn fiber strain (Fig. 2 E), revealing an approximately linear increase in cysteine exposure from 8 ± 6% at 50% strain to 44 ± 17% at 421% strain, based on averages of the 20 fibers with lowest and highest strains, respectively.
Figure 2.
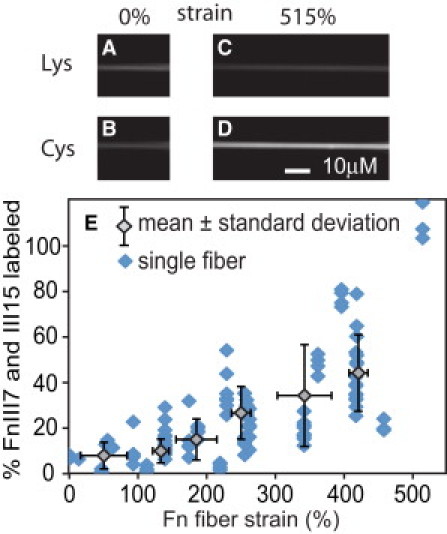
Artificial Fn fibers were pulled from the air/water interface of Fn solutions containing 0.5 mol Alexa 488 per mole Fn and either stretched or relaxed to different strain levels using the textured PDMS substrate. Portions of two fibers that are freely suspended above microfabricated trenches are shown at 0% (A and B) and 515% strain (C and D). After incubating with Alexa 633 maleimide to label cysteines in unfolded III7 and III15 modules and rinsing to remove free dye, fluorescent images of Alexa 488 (A and C) and Alexa 633 emission (B and D) were used to generate a mean ratio of Alexa 633 to Alexa 488 pixel intensities (ICys/ILys) for each fiber and plotted versus Fn fiber strain (E). (Data points, shaded diamonds) Individual fibers. (Open diamonds) Mean ± SD for each consecutive group of 20 fibers.
Fn fiber stretch in silico
We next developed a computational model of Fn fiber extension that links the statistical mechanical properties of single molecules to the mechanical properties of supermolecular fibers. Model fibers were created that consist of molecules modeled as wormlike chains with starting contour lengths of 120 nm. Each molecule attaches to adjacent molecules through freely-jointed nodes that can be arranged into arbitrary configurations. Limited data are available on the persistence length of Fn molecules in the absence of unfolding, so lengths of 7 and 14 nm were used. The ability of modules constituting the molecules to unfold was accounted for with the probability to unfold determined by single-molecule force spectroscopy experiments and Eq. 5. If an unfolding event occurred, a segment with a contour length of 32 nm and persistence length of 0.42 nm, in accordance with the persistence length of unfolded amino-acid chains, is inserted in series with the original molecule in which the contour length has been reduced by 3.5 nm (Fig. 3). Fn type I and II modules and all FnIII modules for which no unfolding data are available contributed to the contour length of the molecule, because it was assigned a value of 120 nm, but they were not allowed to unfold.
Figure 3.
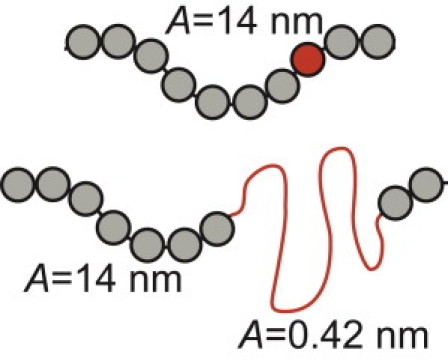
Individual molecules were modeled as wormlike chains with a persistence length, A, of 14 nm and a contour length of 120 nm. If the stochastic model resulted in unfolding of one of the FnIII modules constituting the molecule (red sphere), a segment with a contour length of 32 nm and persistence length of 0.42 nm was added in series to the original molecule. The contour length of the original molecule was reduced by 3.5 nm.
We first simulated the extension of a fiber composed of 20 molecules in series, which was in parallel with another 20 molecules in series (40 molecules total). A full simulation took <1 computer hour. Convergence of the simulation was checked in two ways (Fig. 4). The minimization of the potential energy was verified by plotting the potential energy versus minimizer iteration (Fig. 4 A) showing the minimizer had converged. In addition, the variation in tension along the simulated fiber was analyzed for every iteration of the simulation. Because all the segments are placed in series, the tension should be uniform along the fiber and any variation in the tension represents solver error. Fig. 4 B shows the difference between the maximum tension for any one fiber segment (fseg) and the mean tension for all segments (favg) at each point in the simulation of the disparate loading condition (from Fig. 5 D, below). Error in the tension did not exceed 8 × 10⁻⁴ pN. Because the model is built upon the stochastic properties of single molecules, the simulation was run multiple times. However, results were not different between simulations, owing to the large number of molecules that are considered in the model.
Figure 4.
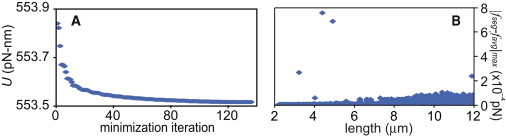
Convergence of the minimization was checked by plotting the potential energy, U, versus minimization iteration (A) showing the function had reached a minimum before the routine ended. (B) Convergence was also checked by plotting the magnitude of the difference between the maximum tension for any one fiber segment (fseg) and the mean tension for all segments (favg). Because all the segments of the fiber are in series, this number would be zero for a perfect solution and represents error in the calculated forces on the molecules. Panel B is shown for the disparate loading configuration (see Fig. 5D, below).
Figure 5.
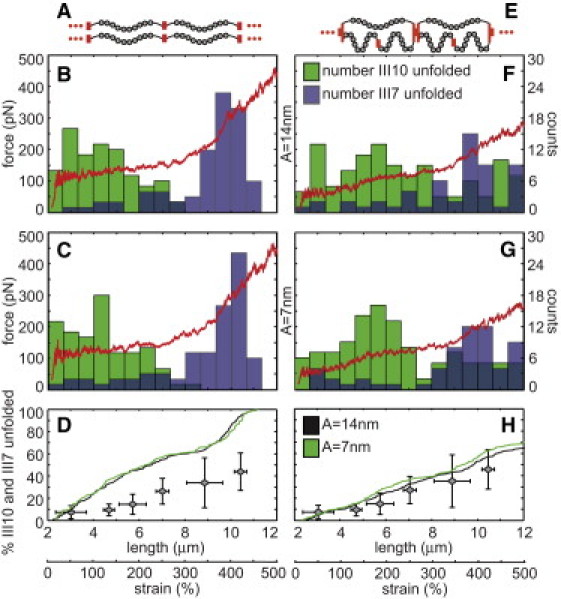
Two computational models of Fn fibers were generated that consisted of either a linear series of 20 molecules in parallel with another linear series of 20 molecules (A–D) or 20 units of three molecules per unit, each with a molecule in parallel with a linear series of two molecules (E–H). Fibers were stretched from a resting end-to-end length of 2.4 μm to a final length of 12 μm. At each of 20,000 discrete steps during the strain cycle, the node positions between each of the molecules were determined by minimizing the potential energy of the system (Eq. 4). A random number was used to determine whether modules unfolded. Force was plotted versus fiber length (red curves) assuming the folded Fn molecule had a persistence length of 14 (B and F) or 7 nm (C and G), and the total number of unfolded FnIII7 (blue boxes) and III10 modules (green boxes) was tracked and plotted within 0.667 μm bins (B, C, F, and G). Cumulative histograms of the total percentage of all FnIII7 and III10 modules in each fiber were plotted versus fiber length (D and H). The in vitro cysteine exposure averages (gray diamonds from Fig. 2E) were plotted on top of the in silico unfolding curves for comparative purposes.
The model fiber with 20 molecules in parallel with another 20 molecules (Fig. 5 A) was stretched from a starting end-to-end length of 90% of the contour length. No unfolding was seen until end-to-end lengths >∼90% of the contour length were achieved, regardless of starting point, and thus this starting point was established to match the unfolding behavior found with in vitro fiber stretch. Two approximately linear regions of force versus displacement were achieved with shallow and then steep slopes corresponding to unfolding of weak and then stronger modules, respectively, regardless of whether the folded Fn molecule was given a persistence length of 14 (Fig. 5 B) or 7 nm (Fig. 5 C).
Because the mechanical properties of FnIII15 are not known, we plotted the unfolding histograms of FnIII7 and III10 (green and blue bar plots in Fig. 5, B and C, respectively). Although FnIII10 is not a cysteine-containing module, it is one of the weakest known FnIII modules and serves as a good reference point for initial module unfolding. Because the Fn modules unfold with a hierarchy of force (16,31), the histogram of unfolding demonstrates sequential unfolding of FnIII10 followed by III7 at fiber lengths >7 μm. For comparison with the in vitro unfolding data, the total percentage of FnIII7 and III10 unfolding was also plotted versus length (Fig. 5 D). The in vitro cysteine exposure averages (shaded diamonds from Fig. 2 E) were plotted on top of the in silico unfolding curves for comparative purposes.
We next stretched a fiber that was intentionally organized to result in disparate mechanical loading of molecules constituting the fiber. With this organization, a single molecule has double the end-to-end length of its two molecular partners in each segment (Fig. 5 E). The fiber consisted of 20 such three-molecule segments connected in series (60 molecules total; 2.4 μm end-to-end starting length). Due to the more complicated molecular arrangement in this fiber, ∼240 h of computer time were required for each simulation. Again, results were similar between different simulations due to the large number of molecules in each fiber. The molecules were stretched from a starting end-to-end length of 90% of the contour length of the single molecule (45% of the contour length of the two molecules in the parallel section of each unit). This resulted in a more gradual unfolding of FnIII10 modules, and greatly reduced the unfolding of FnIII7, again regardless of whether the folded Fn molecules were given a persistence length of 14 (Fig. 5 F) or 7 nm (Fig. 5 G).
In the case of this configuration, the distinct hierarchy of module unfolding as a function of force was retained, but this unfolding behavior was distributed across a larger range of strains because molecules had different levels of molecular tension at each strain value depending upon their position within the fiber. This is due to the redistribution of tension as the fiber extends. In the arrangement presented in Fig. 5 E, the lone molecules in each three-molecule segment have higher tension as the fiber begins to be stretched. As modules unfold in the lone molecules, they increase in contour length, leading to a progressive increase in the force on the parallel segments composed of two molecules in series. This causes unfolding of weak modules (e.g., FnIII10) at low strains within the single molecules, but FnIII10 unfolding is delayed until higher strain values in molecules in the parallel two-molecule strands of each segment. The result is that the unfolding hierarchy of the total population still occurs at similar molecular forces, but not at similar fiber strain values as in the case of all molecules being loaded equally.
Furthermore, the force-versus-length plot had a more gradual increase in slope, similar to published force-versus-length plots of artificial Fn fibers. Finally, a plot of the percentage of FnIII7 and FnIII10 that are unfolded revealed that only 65% of these modules were unfolded at 500% strain (Fig. 5 H) after a linear increase from 0% unfolding at the 2.4-μm (0% strain) starting point. The in vitro cysteine exposure averages (shaded diamonds from Fig. 2 E) were plotted on top of the in silico unfolding curves for comparative purposes.
See Table 1 for the set of probability values used in the stretching experiments.
Table 1.
Values used to describe the probability of FnIII module unfolding are listed for those modules that were included in the in silico fiber-stretching experiment
Discussion
A major goal in biomaterials research is to link the probabilistic properties of single molecules to the bulk mechanical properties of the material. Of the numerous fibrous structures that make up the ECM, Fn fibers have been particularly challenging to fully characterize because they can be extended up to 700% strain (4). Here, we utilized a combined in vitro and in silico approach to characterize the contribution of FnIII unfolding to fiber extension and make an initial estimate of the molecular organization of Fn within the fiber. The major findings are that molecular unfolding increases progressively from a minimal value at low strains up to a value of 44% exposure of cysteines in modules FnIII7 and III15 at 421% strain and that this unfolding profile was best matched by a model of Fn fiber extension that loaded individual Fn molecules in the fiber in an unequal manner. From these findings, we conclude that 1), the mechanical hierarchy of unfolding is less important if molecular tension is unequal in the fiber and 2), the persistence length of the folded Fn molecule is less relevant than the unfolding profile of FnIII modules in determining the force-versus-extension profile of the fiber, despite the fact that extension of the folded Fn molecules contributes greatly to fiber extension. Whether unfolding of FnIII modules is responsible for the extensibility of Fn fibers remains a contentious issue in ECM biology (10,11,13,33,34). We have shown in a direct way, through a what we consider a novel calibration of fluorescent labeling of cysteines that become exposed after unfolding, that a fraction of FnIII modules unfold as Fn fibers are strained. A recent report demonstrated that labeling of cysteines in FnIII7 and III15 was low in cell-derived fibers (33). One limitation of using cell-derived fibers is that fiber strain is unknown, and indeed cysteine exposure in artificial fibers with low strain is minimal (Fig. 2, B and E). These cell-derived fibers may indeed have had low strain. Although artificial Fn fibers were used here because of the ability to tune the fibers to desired strain states and the lack of background material on the cell surface or from other ECM components that may present free cysteine residues, future work must elucidate the mechanical stabilities of FnIII modules in cell-derived fibers as a function of strain. Cell-derived matrix is dynamically stretched to a variety of strain levels (13), even to the point of mechanical failure (12,35,36), and it seems likely that the force to break fibers exceeds the force to unfold FnIII modules.
Furthermore, the variable diameters of cell-derived Fn fibers (as in Ohashi et al. (12)) would lead to disparate strains along the length of the matrix, thus concentrating strain and unfolding in the narrowest parts of each fiber. One limitation of the artificial fiber system is the variability of cysteine exposure at high strains, which may result from the assumption that each fiber is deposited with 140% of prestrain. This value of 140% was derived from an average over many fibers (4); however, relaxation of fibers in this previous study led to fiber buckling over a range of reduced relative strains.
An assessment of the total percentage of all FnIII domains that are unfolded would require a thorough understanding of the mechanical stabilities of all FnIII modules in the fiber because FnIII modules have a hierarchy of mechanical stability (16,30,31,37). Of the two cysteine-containing modules per monomer, the strength of FnIII7 was estimated with steered molecular dynamics (31), whereas the other, FnIII15, is unknown. Because FnIII7 is known to be more resistant to unfolding than seven other modules that have been measured with either steered molecular dynamics or single-molecule dynamic force spectroscopy (16,31), it is highly likely that the measured 44% exposure in artificial fibers results predominantly from unfolding of FnIII15. Unfortunately, our lack of knowledge of FnIII15 mechanical properties makes it difficult to estimate the impact of extension on other modules in the Fn molecule. Nevertheless, these data strongly support that both extension of the Fn protein without unfolding and unfolding of FnIII modules contribute to fiber extension, as has been suggested in previous studies (13,33).
The computational model of Fn fibers supports the hypothesis that Fn fibers are arranged so that molecules are unequally loaded during strain. The profile of cysteine exposure in artificial fibers (Fig. 2 E) could not be replicated with a computational model of a fiber assembled from Fn molecules that were organized in series (Fig. 5, A–D). With a linear arrangement of molecules that resulted in equal loading, FnIII modules unfolded progressively according to their mechanical hierarchy. Considering that FnIII7 is mechanically strong, an arrangement that permits equal loading of Fn molecules in artificial fibers would be hypothesized to lead to bulk unfolding of FnIII15 over a much narrower strain range than was seen in vitro, but that was seen in the simulation with equal loading (histograms in Fig. 5, B and C). This suggests that Fn matrix fibers are assembled with an organization that leads to disparate loading of Fn molecules within the material. Indeed, the exposure of the weakest FnIII module in our simulation, FnIII10, was spread over a wide range of strains using our disparate loading model (Fig. 5, F and G).
Although a variety of architectural schemes could be conceived that result in disparate loading of the molecules, each of these would nevertheless suggest that unfolding of a particular module in Fn occurs throughout the fiber strain range. This has important implications for mechanobiology because at least some modules with important biological functions are mechanically weak—for example, FnIII10 due to its integrin-binding RGD motif—and would not be completely unfolded in highly strained fibers.
One goal in this study was to make a comparison between molecules that are loaded equally and unequally. Virtually every published study makes an implicit assumption that Fn molecules are equally loaded during stretch. However, a vast number of Fn-Fn binding sites have been identified from biochemical studies, and it is conceivable that Fn molecules are arranged in such a way that molecules are not equally loaded. Our model considers the fiber as a one-dimensional structure, and it is thus not possible to account for steric interactions between molecules that would prohibit complete molecular collapse. Nevertheless, the ability to generate quantitative estimates of unfolding behavior and force-versus-extension plots makes the model highly useful in its ability to compare with available data on artificial Fn fibers in vitro. In addition, the extension rate was chosen to match as closely as possible the extension rate of the single-molecule data on which our model relied (k0u, the unfolding rate in the absence of force, and Δxu, the projected bond displacement at rupture). Thus, although this extension rate is most appropriate given the model parameters provided from single-molecule experiments, the hierarchy of unfolding was unchanged over several orders-of-magnitude difference in extension rate (16).
This suggests that changes in extension rate over several orders of magnitude would not dramatically change the results of the model. In addition, we had to estimate the persistence length of the folded Fn molecule. Two persistence length values for the folded portions of the Fn molecules in the computational model were used in this study. A persistence length of 7 nm was chosen because it is approximately equal to the length of two FnIII modules in series (29) and thus represents a reasonable estimation of the lower bound for this value. We chose an upper bound of 14 nm, or four FnIII modules. Surprisingly, the force-versus-strain and cysteine-exposure-versus-strain curves were similar for both persistence length values (Fig. 5, D and H). We conclude that the unfolding behavior of FnIII modules is more important than the persistence length of the folded Fn molecule in determining the bulk properties of the Fn matrix.
In conclusion, we have presented a unique model to study the importance of molecular arrangement in defining the properties of Fn fibers. Future work estimating the number of molecules present per unit volume within artificial and cell-derived Fn matrix fibers as a function of strain would allow us to convert the model parameters into stress-versus-strain plots, thus permitting careful analysis of the relationship between molecular organization and fiber stiffness. Furthermore, the calibration technique that was developed for quantifying the percentage of FnIII7 and III15 that unfolds could be used to estimate the refolding rate of these modules after stretch and relaxation, which would be useful to determine how molecular properties derived from single-molecule studies translates to the behavior of Fn in its native, fibrous context. Computational models that link molecular properties to fiber properties could also be linked into networks, thus translating molecular mechanical properties into much larger length scales.
Acknowledgments
We gratefully acknowledge Benny Yin, Victor Angel, and Molly Ford Dacus with their assistance setting up the microscope for ratiometric imaging of Fn fibers.
This study was funded by National Science Foundation grant No. CMMI 1031139 and an Innovation Career Development Professorship from Boston University (to M.L.S.).
References
- 1.Vogel V., Sheetz M. Local force and geometry sensing regulate cell functions. Nat. Rev. Mol. Cell Biol. 2006;7:265–275. doi: 10.1038/nrm1890. [DOI] [PubMed] [Google Scholar]
- 2.Georges-Labouesse E.N., George E.L., Hynes R.O. Mesodermal development in mouse embryos mutant for fibronectin. Dev. Dyn. 1996;207:145–156. doi: 10.1002/(SICI)1097-0177(199610)207:2<145::AID-AJA3>3.0.CO;2-H. [DOI] [PubMed] [Google Scholar]
- 3.Huang L., Cheng H.C., Pauli B.U. Protein kinase Cɛ mediates polymeric fibronectin assembly on the surface of blood-borne rat breast cancer cells to promote pulmonary metastasis. J. Biol. Chem. 2008;283:7616–7627. doi: 10.1074/jbc.M705839200. [DOI] [PubMed] [Google Scholar]
- 4.Klotzsch E., Smith M.L., Vogel V. Fibronectin forms the most extensible biological fibers displaying switchable force-exposed cryptic binding sites. Proc. Natl. Acad. Sci. USA. 2009;106:18267–18272. doi: 10.1073/pnas.0907518106. [DOI] [PMC free article] [PubMed] [Google Scholar]
- 5.Vogel V., Thomas W.E., Baneyx G. Structural insights into the mechanical regulation of molecular recognition sites. Trends Biotechnol. 2001;19:416–423. doi: 10.1016/S0167-7799(01)01737-1. [DOI] [PubMed] [Google Scholar]
- 6.Krammer A., Craig D., Vogel V. A structural model for force regulated integrin binding to fibronectin's RGD-synergy site. Matrix Biol. 2002;21:139–147. doi: 10.1016/s0945-053x(01)00197-4. [DOI] [PubMed] [Google Scholar]
- 7.Chabria M., Hertig S., Vogel V. Stretching fibronectin fibers disrupts binding of bacterial adhesins by physically destroying an epitope. Nat. Commun. 2010;1:135. doi: 10.1038/ncomms1135. [DOI] [PMC free article] [PubMed] [Google Scholar]
- 8.Little W.C., Schwartlander R., Vogel V. Stretched extracellular matrix proteins turn fouling and are functionally rescued by the chaperones albumin and casein. Nano Lett. 2009;9:4158–4167. doi: 10.1021/nl902365z. [DOI] [PMC free article] [PubMed] [Google Scholar]
- 9.Little W.C., Smith M.L., Vogel V. Assay to mechanically tune and optically probe fibrillar fibronectin conformations from fully relaxed to breakage. Matrix Biol. 2008;27:451–461. doi: 10.1016/j.matbio.2008.02.003. [DOI] [PMC free article] [PubMed] [Google Scholar]
- 10.Abu-Lail N.I., Ohashi T., Zauscher S. Understanding the elasticity of fibronectin fibrils: unfolding strengths of Fn-III and GFP domains measured by single molecule force spectroscopy. Matrix Biol. 2006;25:175–184. doi: 10.1016/j.matbio.2005.10.007. [DOI] [PubMed] [Google Scholar]
- 11.Johnson K.J., Sage H., Erickson H.P. The compact conformation of fibronectin is determined by intramolecular ionic interactions. J. Biol. Chem. 1999;274:15473–15479. doi: 10.1074/jbc.274.22.15473. [DOI] [PubMed] [Google Scholar]
- 12.Ohashi T., Kiehart D.P., Erickson H.P. Dynamics and elasticity of the fibronectin matrix in living cell culture visualized by fibronectin-green fluorescent protein. Proc. Natl. Acad. Sci. USA. 1999;96:2153–2158. doi: 10.1073/pnas.96.5.2153. [DOI] [PMC free article] [PubMed] [Google Scholar]
- 13.Smith M.L., Gourdon D., Vogel V. Force-induced unfolding of fibronectin in the extracellular matrix of living cells. PLoS Biol. 2007;5:e268. doi: 10.1371/journal.pbio.0050268. [DOI] [PMC free article] [PubMed] [Google Scholar]
- 14.Gao M., Craig D., Schulten K. Identifying unfolding intermediates of Fn-III(10) by steered molecular dynamics. J. Mol. Biol. 2002;323:939–950. doi: 10.1016/s0022-2836(02)01001-x. [DOI] [PubMed] [Google Scholar]
- 15.Gee E.P., Ingber D.E., Stultz C.M. Fibronectin unfolding revisited: modeling cell traction-mediated unfolding of the tenth type-III repeat. PLoS ONE. 2008;3:e2373. doi: 10.1371/journal.pone.0002373. [DOI] [PMC free article] [PubMed] [Google Scholar]
- 16.Oberhauser A.F., Badilla-Fernandez C., Fernandez J.M. The mechanical hierarchies of fibronectin observed with single-molecule AFM. J. Mol. Biol. 2002;319:433–447. doi: 10.1016/S0022-2836(02)00306-6. [DOI] [PubMed] [Google Scholar]
- 17.Johnson C.P., Tang H.Y., Discher D.E. Forced unfolding of proteins within cells. Science. 2007;317:663–666. doi: 10.1126/science.1139857. [DOI] [PMC free article] [PubMed] [Google Scholar]
- 18.Cavalcanti-Adam E.A., Micoulet A., Spatz J.P. Lateral spacing of integrin ligands influences cell spreading and focal adhesion assembly. Eur. J. Cell Biol. 2006;85:219–224. doi: 10.1016/j.ejcb.2005.09.011. [DOI] [PubMed] [Google Scholar]
- 19.Mitsi M., Hong Z., Nugent M.A. Heparin-mediated conformational changes in fibronectin expose vascular endothelial growth factor binding sites. Biochemistry. 2006;45:10319–10328. doi: 10.1021/bi060974p. [DOI] [PubMed] [Google Scholar]
- 20.Singh P., Carraher C., Schwarzbauer J.E. Assembly of fibronectin extracellular matrix. Annu. Rev. Cell Dev. Biol. 2010;26:397–419. doi: 10.1146/annurev-cellbio-100109-104020. [DOI] [PMC free article] [PubMed] [Google Scholar]
- 21.Dzamba B.J., Peters D.M. Arrangement of cellular fibronectin in noncollagenous fibrils in human fibroblast cultures. J. Cell Sci. 1991;100:605–612. doi: 10.1242/jcs.100.3.605. [DOI] [PubMed] [Google Scholar]
- 22.Brown R.A., Blunn G.W., Ejim O.S. Preparation of orientated fibrous mats from fibronectin: composition and stability. Biomaterials. 1994;15:457–464. doi: 10.1016/0142-9612(94)90225-9. [DOI] [PubMed] [Google Scholar]
- 23.Ejim O.S., Blunn G.W., Brown R.A. Production of artificial-orientated mats and strands from plasma fibronectin: a morphological study. Biomaterials. 1993;14:743–748. doi: 10.1016/0142-9612(93)90038-4. [DOI] [PubMed] [Google Scholar]
- 24.Rief M., Gautel M., Gaub H.E. Reversible unfolding of individual titin immunoglobulin domains by AFM. Science. 1997;276:1109–1112. doi: 10.1126/science.276.5315.1109. [DOI] [PubMed] [Google Scholar]
- 25.Bustamante C., Marko J.F., Smith S. Entropic elasticity of λ-phage DNA. Science. 1994;265:1599–1600. doi: 10.1126/science.8079175. [DOI] [PubMed] [Google Scholar]
- 26.Evans E. Probing the relation between force—lifetime—and chemistry in single molecular bonds. Annu. Rev. Biophys. Biomol. Struct. 2001;30:105–128. doi: 10.1146/annurev.biophys.30.1.105. [DOI] [PubMed] [Google Scholar]
- 27.Erickson H.P., Carrell N., McDonagh J. Fibronectin molecule visualized in electron microscopy: a long, thin, flexible strand. J. Cell Biol. 1981;91:673–678. doi: 10.1083/jcb.91.3.673. [DOI] [PMC free article] [PubMed] [Google Scholar]
- 28.Li L., Huang H.H., Fernandez J.M. Mechanical unfolding intermediates observed by single-molecule force spectroscopy in a fibronectin type III module. J. Mol. Biol. 2005;345:817–826. doi: 10.1016/j.jmb.2004.11.021. [DOI] [PubMed] [Google Scholar]
- 29.Leahy D.J., Aukhil I., Erickson H.P. 2.0 Å crystal structure of a four-domain segment of human fibronectin encompassing the RGD loop and synergy region. Cell. 1996;84:155–164. doi: 10.1016/s0092-8674(00)81002-8. [DOI] [PubMed] [Google Scholar]
- 30.Ng S.P., Rounsevell R.W., Clarke J. Mechanical unfolding of TNfn3: the unfolding pathway of a FnIII domain probed by protein engineering, AFM and MD simulation. J. Mol. Biol. 2005;350:776–789. doi: 10.1016/j.jmb.2005.04.070. [DOI] [PubMed] [Google Scholar]
- 31.Craig D., Gao M., Vogel V. Tuning the mechanical stability of fibronectin type III modules through sequence variations. Structure. 2004;12:21–30. doi: 10.1016/j.str.2003.11.024. [DOI] [PubMed] [Google Scholar]
- 32.Sahaf B., Heydari K., Herzenberg L.A. Lymphocyte surface thiol levels. Proc. Natl. Acad. Sci. USA. 2003;100:4001–4005. doi: 10.1073/pnas.2628032100. [DOI] [PMC free article] [PubMed] [Google Scholar]
- 33.Lemmon C.A., Ohashi T., Erickson H.P. Probing the folded state of fibronectin type-III domains in stretched fibrils by measuring buried cysteine accessibility. J. Biol. Chem. 2011;286:26375–26382. doi: 10.1074/jbc.M111.240028. [DOI] [PMC free article] [PubMed] [Google Scholar]
- 34.Antia M., Baneyx G., Vogel V. Fibronectin in aging extracellular matrix fibrils is progressively unfolded by cells and elicits an enhanced rigidity response. Faraday Discuss. 2008;139:229–249. doi: 10.1039/b718714a. discussion 309–325., 419–420. [DOI] [PMC free article] [PubMed] [Google Scholar]
- 35.Davidson L.A., Dzamba B.D., Desimone D.W. Live imaging of cell protrusive activity, and extracellular matrix assembly and remodeling during morphogenesis in the frog, Xenopus laevis. Dev. Dyn. 2008;237:2684–2692. doi: 10.1002/dvdy.21600. [DOI] [PMC free article] [PubMed] [Google Scholar]
- 36.Sivakumar P., Czirok A., Dallas S.L. New insights into extracellular matrix assembly and reorganization from dynamic imaging of extracellular matrix proteins in living osteoblasts. J. Cell Sci. 2006;119:1350–1360. doi: 10.1242/jcs.02830. [DOI] [PubMed] [Google Scholar]
- 37.Ng S.P., Billings K.S., Clarke J. Designing an extracellular matrix protein with enhanced mechanical stability. Proc. Natl. Acad. Sci. USA. 2007;104:9633–9637. doi: 10.1073/pnas.0609901104. [DOI] [PMC free article] [PubMed] [Google Scholar]