

Abstract
Details about molecular membrane dynamics in living cells, such as lipid-protein interactions, are often hidden from the observer because of the limited spatial resolution of conventional far-field optical microscopy. The superior spatial resolution of stimulated emission depletion (STED) nanoscopy can provide new insights into this process. The application of fluorescence correlation spectroscopy (FCS) in focal spots continuously tuned down to 30 nm in diameter distinguishes between free and anomalous molecular diffusion due to, for example, transient binding of lipids to other membrane constituents, such as lipids and proteins. We compared STED-FCS data recorded on various fluorescent lipid analogs in the plasma membrane of living mammalian cells. Our results demonstrate details about the observed transient formation of molecular complexes. The diffusion characteristics of phosphoglycerolipids without hydroxyl-containing headgroups revealed weak interactions. The strongest interactions were observed with sphingolipid analogs, which showed cholesterol-assisted and cytoskeleton-dependent binding. The hydroxyl-containing headgroup of gangliosides, galactosylceramide, and phosphoinositol assisted binding, but in a much less cholesterol- and cytoskeleton-dependent manner. The observed anomalous diffusion indicates lipid-specific transient hydrogen bonding to other membrane molecules, such as proteins, and points to a distinct connectivity of the various lipids to other membrane constituents. This strong interaction is different from that responsible for forming cholesterol-dependent, liquid-ordered domains in model membranes.
Introduction
Cellular signaling is known to be linked to the organization of lipids and proteins in the plasma membrane, where lipid-lipid or lipid-protein interactions are believed to play a crucial role, for example (1–6). However, access to many details about the molecular and spatiotemporal characteristics of these interactions is usually hindered by the limited spatial resolution of conventional optical microscopy. Although noninvasive far-field optical microscopy allows a direct study of living cells, similar features must be >200 nm apart to be distinguishable. Lipid-protein complexing takes place at much smaller scales (7). Applied in the far field, fluorescence correlation spectroscopy (FCS) has been successfully used for live-cell studies of membrane dynamics and organization (8–12). These experiments have demonstrated how information about nanoscopic movement can be indirectly inferred when using model-based approaches (9), e.g., by extrapolating measurement results to the nanoscopic range (10,13,14). However, these strategies rely heavily on correct quantitative modeling of the investigated system because such experiments cannot deliver a clear signature of the dynamics at length scales below the diffraction limit of far-field optics.
Recently, the combination of FCS with far-field stimulated emission depletion (STED) nanoscopy (15–17) allowed direct measurements at the length scale of interest and delivered more model-independent results about nanoscopic details. STED nanoscopy offers diffraction-unlimited spatial resolution in the far field by using stimulated emission to inhibit fluorescence signaling of molecules everywhere outside small confined regions (18,19). STED-FCS directly revealed that in contrast to a fluorescent glycerophospholipid analog, sphingolipid analogs were trapped in transient, cholesterol-assisted molecular complexes (16). These STED-FCS data complemented previous diffraction-limited FCS data (10,20) and were recently confirmed by fast single-molecule tracking experiments (21) and FCS measurements obtained with a tip-based near-field optical microscope (22). However, some molecular details about the observed lipid trapping, such as the dependence on the molecular structure of the lipids and the influence of cholesterol and the cytoskeleton, remain to be clarified.
Using STED-FCS, we studied in more detail the molecular characteristics of nanoscale lipid trapping in the plasma membrane of living cells. The trapping characteristics of various fluorescent lipid analogs were disclosed, differing in the number of chains, the position of the fluorescent marker, and the headgroup structure. Further, we investigated the dependency of the lipid dynamics on other structural parameters, such as cholesterol depletion of the plasma membrane and depolymerization of the underlying cytoskeleton. We discuss potential connections to the formation of more-ordered lipid nanodomains. Our results show that STED-FCS is a very sensitive tool for studying membrane organization and the underlying membrane dynamics. It can provide novel details about structure-specific nanoscale interactions of lipids with other membrane components, such as proteins, which cannot be directly observed by conventional optical methods.
Materials and Methods
Lipids
We used the lipophilic organic dye Atto647N (fluorescence excitation and emission maxima at 645 nm and 670 nm, respectively, in aqueous solution; Atto-Tec, Siegen, Germany) as the fluorescence marker. The dye was tagged to the lipid via a C4 linker. We synthesized different fluorescent phosphoglycerolipid and sphingolipid analogs (for details about the synthesis and structures, see Fig. S1 in the Supporting Material).
Measurements
The preparation of the mammalian PtK2 cells on standard glass coverslips; incorporation of the fluorescent lipid analogs into the plasma membrane of the living cells via bovine serum albumin (BSA) complexes; the procedures for cholesterol depletion and cytoskeleton modification by cholesterol oxidase (COase), β-cyclodextrin (β-CD), Latrunculin B, or other additives; the exact measurement conditions and procedures; the STED microscope; and the FCS analysis are described in the Supporting Material.
Results
STED-FCS nanoscopy of lipid membrane dynamics: revealing anomalous subdiffusion
STED nanoscopy allows one to create fluorescence interrogation spots at nanometric scales (18,19). STED nanoscopy is based on the reversible inhibition of fluorescence emission of a marker by stimulated emission. The stimulated emission is induced by the STED light at a wavelength that is typically at the red edge of the emission spectrum. Irradiation with STED light featuring a focal intensity distribution with one or several zeros in space inhibits the fluorescence of the marker molecules everywhere except within the subdiffraction-sized regions around the zeros. In our case, we overlaid the diffraction-limited fluorescence excitation spot with a doughnut-shaped intensity distribution of the STED light, rendering an effective fluorescence spot of subdiffraction size along the lateral directions. We were able to dynamically tune the size of the effective fluorescence spot by adjusting the STED beam intensity as shown in Fig. 1 A, which plots the diameter d of the effective focal spots against the STED beam power PSTED.
Figure 1.
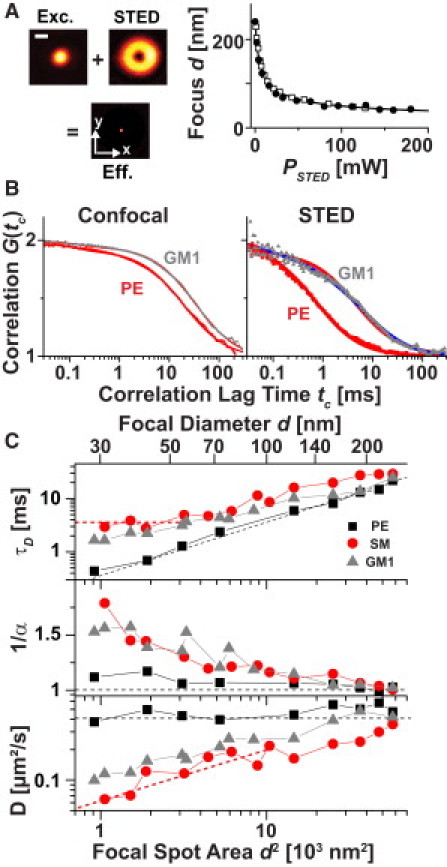
STED-FCS reveals anomalous lipid diffusion in the plasma membrane of live mammalian cells. (A) The effective focal detection spots of the STED nanoscope (Eff.) were created by overlaying the diffraction-limited excitation spot (Exc.) with a doughnut-shaped focal intensity distribution of the STED laser (STED), turning fluorophores non-emissive everywhere but at the focal center: lateral scanning images of 80-nm gold beads (Exc. and STED) and 20-nm fluorescent beads (Eff.), scale bar 200 nm The focal diameter d (full width at half-maximum) was tuned by the power PSTED of the STED laser as calibrated by scanning 20-nm large fluorescent beads (black circles) or by measuring the focal transit time of fluorescent lipid analogs in supported lipid bilayers using FCS (open squares). (B) Confocal (d = 240 nm) and STED (d = 40 nm) FCS data of PE (red) and GM1 (gray) diffusion with fits using 1/α ≈ 1 (red lines) and >1.4 (blue line). All curves were normalized to amplitude 2. (C) Dependence of the focal transit time τD, the anomaly 1/α, and the apparent diffusion coefficient D of PE (black squares), SM (red circles), and GM1 (gray triangles) on the focal diameter d and area d2 determined from FCS data recorded for increasing STED power. Black and red dotted lines indicate the dependence expected for free and trapped diffusion, respectively. Standard deviation of the mean was ∼10%.
We used FCS to study the diffusion of different membrane molecules through these nanoscopic spots created by STED. We incorporated different lipid analogs labeled with the lipophilic organic dye Atto647N into the plasma membrane of living mammalian PtK2 cells by incubation with the following lipid-BSA complexes: saturated phosphoglycerolipids phosphatidylethanolamine (DPPE, denoted by PE), phosphatidylcholine (DSPC, denoted by PC) and phosphatidylinositol (PI), unsaturated phosphatidylethanolamine (DOPE), saturated sphingolipids sphingomyelin (SM), ceramide (Cer), galactosylceramide (GalCer), and ceramide phosphorylinositol (CPI), and the gangliosides GM1, GM2, and GM3 (Fig. S1). The lipid analogs differed in headgroup structure, the length and saturation degree of the acyl chains, and the labeling position of the dye. For example, we labeled the lipids at either the headgroup (headgroup labeling) or the water-lipid interface by replacing the native long acyl chain with a short acyl chain carrying the dye (acyl chain replacement). The abbreviation “-h” denotes headgroup labeling, “-c” denotes acyl chain replacement, and “L-” denotes the lyso derivative with only the single alkyl chain and a headgroup label. Throughout the text, PE, SM, and GM1 denote the lipid analogs PE-h, SM-c, and GM1-c, respectively.
Fig. 1 B depicts representative FCS data for the confocal recordings of the PE and GM1 analog in the plasma membrane of living PtK2 cells. FCS averages over thousands of focal transits of the fluorescent lipid analogs and determines an average focal transit time τD and the anomaly (1/α), which for (1/α) > 1 quantifies the deviation from normal free diffusion (Eq. S2). The inflection point of the correlation curves gives an estimate of τD, which was slightly larger for the GM1 than for the PE lipid. A fit of the anomalous subdiffusion model (Eq. S2) to the data resulted in transit times, τD, of ≈20 ms for PE and ≈30 ms for GM1. However, for both PE and GM1, the anomaly (1/α) was close to one, providing no indication of heterogeneous diffusion. The diffraction-limited confocal recordings with a >200 nm large detection spot could not clearly explore the cause of the decreased mobility of GM1. These recordings could not distinguish between a slower free diffusion and an anomalous subdiffusion due to, for example, nanoscopic obstacles, because they averaged over such nanoscopic details of the molecular diffusion (16). In contrast, nanoscale spots created by STED directly provided the desired details. Correlation data recorded for PSTED = 160 mW (d ≈ 40 nm) showed a clear difference between PE and GM1 diffusion. Although the PE curve could still be described with (1/α) ≈ 1 (i.e., normal free diffusion), the GM1 data rendered (1/α) ≈ 1.5 and a significantly slower τD compared with PE.
STED-FCS nanoscopy of lipid membrane dynamics: reasons for anomalous subdiffusion
The dynamical tuning of the detection spot by STED allowed a more detailed view of the anomaly in lipid diffusion, as outlined in Fig. 1 C. The transit times, τD, and anomalies, (1/α), determined from the correlation data of PE, SM, and GM1 for increasing STED power, PSTED, showed an increasing difference between PE and SM or GM1 diffusion for smaller focal diameters, d. Values of (1/α) close to one for PE indicated normal, whereas increasing values of (1/α) > 1.5 for small d highlighted anomalous diffusion at the nanoscale for SM and GM1.
The reason for the anomaly in SM and GM1 diffusion is revealed by the dependence of τD on the focal detection area, d2. Based on the FCS diffusion law, i.e., the τD(d2) relation predicted for different diffusion modalities (10), we expect a linear relationship for free diffusion similar to that observed for PE, and a nonlinear characteristic for diffusion that is transiently slowed down by, e.g., a transient incorporation into molecular complexes as observed for SM and GM1. The observed minimal change of τD with the focal spot size for small focal areas (d < 70 nm in the case of SM) can, for example, only be explained by transient arrests during the diffusion pathway (i.e., transient trapping events). Similarly, the relation τD(d2) allowed us to calculate the apparent diffusion coefficient D = d2 / (8 ln2 τD) (Eq. S2) for every d. Following the above arguments given by the diffusion law, a constant value D(d) is expected for normal free diffusion, as for PE, whereas a decrease in D for small foci d reveals transient slowing down or arrests, as for SM and GM1.
In our initial STED-FCS data for PE and SM, we estimated the spatial scale at which the lipids roamed during the transient arrests to be <20 nm (16,21). Our current STED-FCS experiments yielded similar estimations, indicating that the heterogeneous diffusion of SM and GM1 originated from the formation of transient complexes, where the binding partner was either immobilized or moving comparatively slowly. Consequently, we will refer to molecular trapping throughout this work. In this respect, we could analyze the correlation data with a model introducing transient binding of the diffusing lipid to a fixed or comparatively slow-moving particle with effective on- and off-rates kon and koff, respectively (Eq. S3) (17,23). The model fitted our data accurately and resulted in values of kon and koff in the range of 30–100 s−1 for SM and GM1, i.e., trapping times τtrap = 1/koff = 10–20 ms.
Fig. 1 clearly reveals that only the reduction of d far below the diffraction limit realized an accurate disclosure of hindered diffusion, i.e., the distinction of diffusion heterogeneity due to nanoscopic obstacles improved with spatial resolution. In the case of small d, the molecular transit was dominated by the resting event, which took much longer than the time periods of free diffusion. Obviously, only ensuring a significantly reduced transient time of free diffusion as for the STED recordings (< 1 ms for d < 50 nm) allowed us to distinguish between normal and trapped diffusion. Note that the analysis of Eq. S3 for the determination of kon and koff is only valid for reaction-dominated diffusion, i.e., for the case in which the transit time of free diffusion, τfree, is much shorter than the trapping time, 1/koff (17,23). In our measurements, this was only the case for strong trapping as for SM and GM1, and for focal areas with d < 60–70 nm (i.e., PSTED > 60–70 mW), where τfree < 1–1.5 ms and thus τfree/τtrap < 0.1 (14,17).
Structural dependence of lipid dynamics
We determined the values of the apparent diffusion coefficient D and the anomaly (1/α) from FCS data of the various lipids for confocal (d = 240 nm) and STED (d = 40 nm) recordings. The differences should highlight how the lipid structure influenced the nanoscopic trapping (Fig. 2). As outlined above, anomalous subdiffusion due to transient molecular trapping resulted in decreased values of DSTED and increased values of (1/α)STED for the STED recordings as compared with the confocal values Dconf and (1/α)conf, and consequently in a ratio DSTED/Dconf << 1, i.e., this ratio quantified the trapping strength. For example, values of DSTED/Dconf ≈ 0.3 and (1/α)STED > 1.4 implied the strong trapping of SM, whereas values of DSTED/Dconf ≈ 1 and (1/α)STED < 1.2 of PE indicated almost normal free diffusion.
Figure 2.
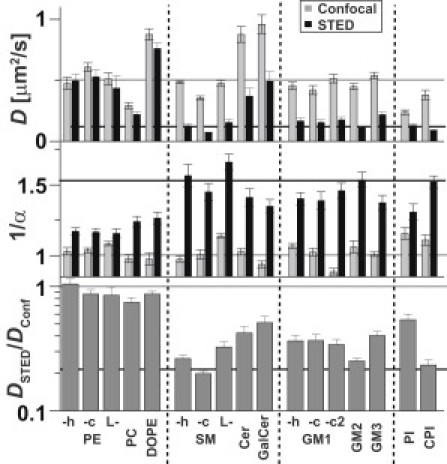
Structural dependence of the nanoscale trapping. Apparent diffusion coefficient D (upper panel) and anomaly 1/α (middle panel) determined from confocal (d = 240 nm, gray bars) and STED FCS recordings (d = 40 nm, black bars), and ratio DSTED/Dconf (lower panel) for the various fluorescent lipid analogs. DSTED/Dconf = 1 for normal free diffusion and <1 for nanoscale trapping (the smaller the DSTED/Dconf, the stronger the trapping).
Using the different lipid analogs, we were able to highlight various molecular characteristics of nanoscale trapping, as follows: 1) We confirmed that the observed diffusion characteristics of our fluorescent lipid analogs were not influenced by the dye (16) (Supporting Material). The difference in the dynamics of PE, SM, and GM1 remained the same when we changed the labeling position of the Atto647N marker, either by labeling at the headgroup (-h) or by replacing the acyl chain (-c). 2) The Lyso derivatives of PE, SM, and GM1 (L-), as well as the labeling at one of the long acyl chains of GM1 (-c2, i.e., GM1-c2 carried the dye anchor in addition to the two native chains), showed diffusion behavior similar to that of their double-chained derivatives, respectively; that is, even without the long acyl chain or with an additional dye anchor, trapping of SM and GM1 remained unchanged. 3) Both the unsaturated phosphatidylethanolamine DOPE and the saturated phosphoglycerolipid phosphatidylcholine (PC) showed nearly normal diffusion, similarly to saturated PE. 4) Other sphingolipids, such as Cer, GalCer, GM2, and GM3, behaved similarly to SM and GM1. 5) Trapping of the phosphatidylinositol analogs (PI and CPI) was only as pronounced as that of SM in the case of CPI (CPI compared with PI; in PI diacylglycerol is the lipophilic backbone, whereas in CPI ceramide is the lipophilic anchor). 6) For most of the trapped lipids, we determined effective encounter rates kon ≈ 30–70 s−1 and off-rates koff in the range of 40–80 s−1, i.e., on average a single lipid experienced a trapping event every 1/kon ≈ 15–35 ms with an average trapping duration τtrap = 1/koff ≈ 10–25 ms. 7) From the confocal data, we estimated diffusion coefficients of free diffusion of D ≈ 0.4–0.6 μm2/s for most of the lipids.
As a consequence of the above observations, trapping was only dominant for sphingolipids, i.e., for those lipids with a ceramide (or sphingosine) backbone and its hydroxyl and amino group as hydrogen-bond donors close to the water-lipid interface (Fig. S1). This structural ceramide element may have facilitated hydrogen bonds to (endogenous) membrane components, such as proteins (24).
However, further differences between the various phosphoglycero- and sphingolipids arose, as described below.
-
1.
Diffusion of unsaturated DOPE was faster (Dconf = 0.9 μm2/s) and that of saturated PC (DSPC) was slower (Dconf = 0.3 μm2/s) than that of the shorter-chained PE (DPPE, Dconf = 0.5 μm2/s). When a C11 instead of a C4 linker was used to tag Atto647N to PC, diffusion was further slowed down (Dconf = 0.2 μm2/s; data not shown). This supports the general notion that unsaturated and shorter-chained lipids usually diffuse more rapidly because they have less preference for more-ordered regions, where diffusion may be slowed down.
-
2.
Diffusion of the phosphoglycerolipids PE, DOPE, and PC was also slightly hindered, as revealed by values of DSTED/Dconf < 1 and (1/α)STED > 1.1. These slight deviations from free diffusional behavior could not be ascribed to an analysis artifact (c.f. Eq. S2). In accordance with the above discussion, DSTED/Dconf < 1 indicated transient trapping on the nanoscale, and in a previous analysis of trapping of PE, we determined on- and off-rates kon ≈ 200 s−1 and koff > 800 s−1, respectively (17).
-
3.
Trapping of the headgroup-labeled SM lipids SM-h and L-SM was slightly less pronounced than that for SM-c tagged via acyl-chain replacement. The labeled Cer analog showed even weaker trapping. In contrast, we observed no differences in trapping between the differently labeled GM1 analogs.
-
4.
Trapping of GM1, with its large sugar headgroup, was less pronounced than that of SM. Compared with SM (koff ≈ kon ≈ 70 s−1), we determined slightly lowered off-rates (koff ≈ 50 s−1) and more significantly lowered effective on-rates (kon ≈ 30 s−1) of transient trapping.
-
5.
The influence of the size and structure of the sugar headgroup became more pronounced when we studied the differences among GM1, GM2, GM3, and GalCer. Trapping of GM2 (which lacks one galactose residue) was more pronounced than that of GM1, with slightly longer trapping times (koff ≈ 30 s−1). However, the size of the sugar headgroup could not be the only measure. The observed dynamics of GM3 (lacking one galactose and one N-acetylgalactosamine residue) was again almost indistinguishable from that of GM1. The diffusion of GalCer (carrying only one galactose group) was observed to be twice as fast as that of GM1–3 (Dconf = 1 μm2/s and 0.5 μm2/s, respectively), and, due to a larger off-rate koff ≈ 80 s−1, GalCer was slightly less trapped than GM1–3.
-
6.
The phosphatidylinositol PI (without a ceramide backbone) revealed more pronounced trapping than the other phosphoglycerolipids (PE, DOPE, and PC), indicating headgroup-mediated interactions.
Cholesterol dependence
The differences in the dynamical characteristics of the various lipid analogs became more pronounced when we compared diffusion after treatment for cholesterol depletion. Cholesterol is known to play a crucial role in the formation of membrane heterogeneity, for example (1–3,5,10,11,20). The transient complexes observed in our experiments were also highly dependent on cholesterol, as shown for SM in Fig. 3, A and B (16). The depletion of cholesterol by cholesterol-oxidase (COase) or β-cyclo-dextrin (β-CD) treatment resulted in the vanishing of the anomalous diffusion of SM, rendering almost normal diffusion as for PE, i.e., cholesterol seemed to significantly stabilize the transient complexes of SM.
Figure 3.
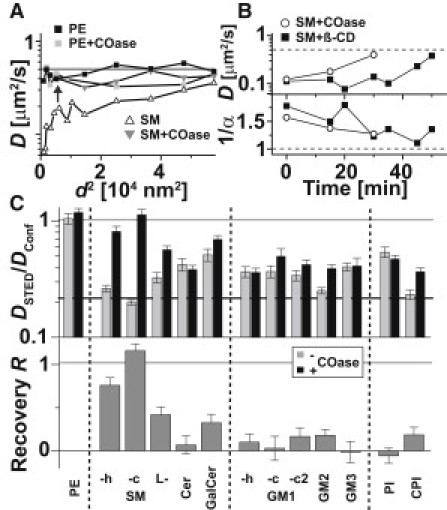
Lipid dynamics after cholesterol depletion. (A) Dependence of the apparent diffusion coefficient D of PE (squares) and SM (triangles) on the focal area d2 before (black) and after (gray) cholesterol depletion by COase treatment. (B) Time evolution of D (upper panel) and the anomaly 1/α (lower panel) of SM determined from STED (d = 40 nm) FCS data after starting treatment with the cholesterol-depleting drugs COase (open circles) and β-CD (black squares). (C) Ratio DSTED/Dconf and recovery R for various fluorescent lipid analogs upon COase treatment. R = 1 for complete abolishment of the trapping, R = 0 for no effect, and R < 0 for an increase of trapping after treatment.
Fig. 3 C demonstrates the cholesterol dependence of the nanoscopic trapping for the various fluorescent lipid analogs by presenting a comparison of STED-FCS data obtained before and after COase treatment for 30 min. We plotted the ratio DSTED/Dconf of the apparent diffusion coefficients determined from the confocal (d = 240 nm) and STED (d = 40 nm) recordings on untreated and cholesterol-depleted cells, and calculated the recovery parameter R = (DSTED∗ − DSTED)/(Dconf∗ − DSTED) with the apparent diffusion coefficients DSTED∗ and DSTED determined from the STED recordings for treated and untreated cells, respectively, and Dconf∗ determined from the confocal recordings for treated cells. When the treatment abolished trapping, diffusion became almost free and DSTED∗ ≈ Dconf∗ (i.e., R = 1); otherwise, DSTED∗ ≈ DSTED or DSTED∗ << Dconf∗ (i.e., R << 1). The values of R became negative when trapping was enhanced after treatment (i.e., DSTED∗ < DSTED). Consequently, R quantified the change in binding strength due to cholesterol depletion.
COase treatment did not show an effect on phosphoglycerolipids, such as PE. On the one hand, this indicates that the almost free diffusion of the lipids was hardly affected by the treatment. On the other hand, the slight trapping of the phosphoglycerolipids (if at all observable) did not seem to be facilitated by cholesterol. The almost free diffusion of SM after COase treatment resulted from an increased off-rate of SM binding (koff >150 s−1 compared with ≈70 s−1 without treatment), whereas the on-rate kon was hardly affected, i.e., COase weakened the complexes. In contrast, in the case of β-CD, the on-rate kon decreased from 70 s−1 to <10 s−1, whereas the off-rate koff stayed similar. This difference between COase and β-CD could stem from the different molecular interactions with cholesterol: COase catalyzes cholesterol oxidation, leaving the oxidized product within the bilayer, whereas β-CD removes cholesterol from the bilayer. Also, both drugs affected other cellular parameters differently. For example, β-CD seemed to influence the PtK2 cells more strongly than did COase (Fig. S4).
It is known that an intensive β-CD-treatment may induce solid-like regions in the plasma membrane (25). Therefore, we compared the dependence on cholesterol based on COase treatment. Compared with SM-c tagged via acyl-chain replacement, the recovery values were slightly lower for the headgroup labeled SM-h and L-SM. Diffusion of the labeled Cer analog hardly changed with COase treatment. Recovery of free diffusion after COase treatment was much less pronounced for all sphingolipids with large hydroxyl-containing headgroups, such as GalCer, CPI, and the gangliosides GM1–3. For example, GM1 diffusion was influenced only a little, with R ≈ 0.1 and no observable changes in kon and koff. Trapping of the Cer phosphorylinositol (CPI) was more affected by COase treatment compared with PI, which showed no abolishment of trapping at all.
Actin dependence
Several reports have shown that plasma membrane heterogeneity is strongly linked to the underlying cytoskeleton, such as the actin network, for example (4,6). We used the drug Latrunculin B, which inhibits polymerization of the actin network (Fig. S4), to investigate the dependence of the nanoscopic lipid interactions on actin (20). For example, Fig. 4, A and B, show that trapping of SM was abolished to a certain extent after a 30-min treatment with Latrunculin B, whereas the free diffusion of the lipids (e.g., PE) was not affected. In Fig. 4 C we plot the ratio DSTED/Dconf of various lipids determined from the confocal (d = 240 nm) and STED (d = 40 nm) recordings for untreated and Latrunculin B-treated (15 min) cells and the recovery parameter R = (DSTED∗ − DSTED)/(Dconf∗ − DSTED) as defined above.
Figure 4.
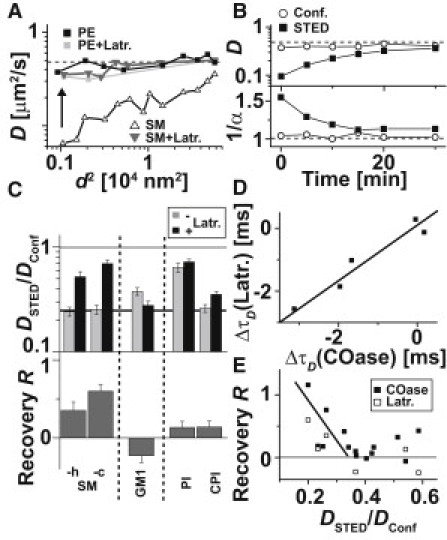
Lipid dynamics after actin depolymerization and correlation with cholesterol dependence and trapping strength. (A) Dependence of the apparent diffusion coefficient D of PE (squares) and SM (triangles) on the focal area d2 before (black) and after (gray) actin depolymerization by Latrunculin B (Latr.) treatment. (B) Time evolution of D (upper panel) and the anomaly 1/α (lower panel) of SM determined from the confocal (open circles) and STED (black squares, d = 40 nm) FCS data after starting treatment with Latrunculin B. (C) Ratio DSTED/Dconf and recovery R for various fluorescent lipid analogs upon Latrunculin B treatment. (D) Correlation of the cholesterol and actin dependence: value pairs of the changes in focal transit time ΔτD of the STED recordings (d = 40 nm) following COase and Latrunculin B treatment for different fluorescent lipid analogs. Negative values of ΔτD indicate abolishment of trapping. (E) Correlation of the trapping strength and the cholesterol and actin dependence: value pairs of the trapping strength DSTED/Dconf before treatment and the recovery R after treatment with COase (black) and Latrunculin B (white) for different fluorescent lipid analogs.
As with the cholesterol-depletion experiments, abolishment of trapping after Latrunculin B treatment was largest for SM-c and lower for headgroup-labeled SM-h (note that compared with Latrunculin B, abolishment is larger for COase treatment). We determined both a decrease in on-rate kon and an increase in off-rate koff after Latrunculin B treatment. The trapping of GM1 was even further enhanced, whereas the extent of PI and CPI trapping was hardly affected.
For the lipids tested, the dependence on COase and Latrunculin B treatment was correlated, i.e., it seems that the nanoscopic trapping of the lipids that were assisted by cholesterol was also linked to the actin cytoskeleton (Fig. 4 D). To go a step further, strong trapping from the very beginning (with DSTED/Dconf < 0.3) resulted in a correlative dependence on both COase and Latrunculin B treatment, whereas more weakly interacting lipids (DSTED/Dconf > 0.3) were hardly influenced by these treatments (Fig. 4 E).
The above observations were confirmed by measurements on other cells and by other treatments for cholesterol depletion (zaragozic acid (26) and cytoskeleton disruption (cytochalasin (26), jasplakinolide (27), and nocodazole) as outlined in the Supporting Material and Fig. S5).
Discussion
Molecular trapping of lipids
The constrained diffusion of the fluorescent lipid analogs revealed by our STED-FCS data was due to a transient slowdown of diffusion caused by short-lived, often cholesterol-assisted molecular complexes in which the binding partner was either immobilized or moving comparatively slowly. The presence of the ceramide (or sphingosine) moiety close to the water-lipid interface, with its NH and OH groups, and of a large polar headgroup with numerous hydroxyl-groups was mainly responsible for the observed nanoscopic trapping interactions, likely by providing a basis for the formation of molecular complexes via hydrogen bonding. We could determine on- and off-rates of the transient binding, which were in the range of 1/(10 ms). With diffusion coefficients of D ≈ 0.4–0.6 μm2/s of free diffusion for most of the lipids, we could estimate that an interacting lipid (such as SM) on average experienced a trapping event approximately every 200–300 nm. We observed differences between the trapping strengths of the lipids, which became very pronounced after treatment for depleting cholesterol from the plasma membrane or depolymerizing the underlying cytoskeleton.
However, we did not observe a hopping-like diffusion due to compartmentalization of the plasma membrane by the underlying cytoskeleton (6). Such hopping-like diffusion was previously reported for an unsaturated lipid analog labeled by a large gold bead with compartment sizes of ≥230 nm (28). In line with our diffusion-law data in Fig. 1, a meshwork-based or hopping-like diffusion would have resulted in an exponential-like increase of τD with d2 (10,14), which was not observed for any of the investigated lipids. There is a possibility that our measurements did not detect such hopping events because our FCS analysis probed areas of <240 nm in diameter. However, previous FCS studies on diffraction-limited and larger focal spots also ruled out hopping-like diffusion (10,20). On the other hand, FCS may miss single, isolated hopping events because it averages over a multitude of focal transits.
Headgroup dependence of molecular trapping
Depending on the headgroup's size and the number of hydroxyl groups in the headgroup, small differences between similar lipids were observed. A comparison of the data for GM1, GM2, GM3, and GalCer revealed no clear correlation between the size of the polar sugar headgroups and the trapping strength. The relatively large size of the headgroup may destabilize the complexes, but its numerous hydroxyl groups may facilitate molecular interactions via hydrogen bonding. In any case, lipid diffusion was dependent on the composition of the headgroup, which points to different interaction partners for the various lipid types. We also observed differences between the different SM analogs: SM-c (carrying a large phosphocholine headgroup) showed stronger trapping and a stronger dependence on cholesterol depletion and depolymerization of the cytoskeleton than did SM-h and L-SM (with a smaller phosphorylethanolamine headgroup). This may indicate a slight influence from the position of the dye label (which was at the headgroup for SM-h and L-SM and at the acyl-chain for SM-c); however, we did not observe any influence on the dye position for PE and for trapping of GM1 (c.f. Supporting Material). Furthermore, our results are in line with previous work. Experiments on model membranes and atom-scale simulations showed an influence on the size of the headgroup of SM on the lipid's membrane interaction, and the SM with the largest headgroup (e.g., SM-c) was reported to have the largest affinity to cholesterol (29). Accordingly, in our experiments, the Cer analog with only one OH headgroup showed even less trapping and no dependence on cholesterol depletion. This may also point to the quite distinct biophysical characteristics of Cer. For example, previous experiments on model membranes indicated that Cer may significantly rearrange lateral organization of lipids and induce Cer-enriched domains excluding cholesterol (30,31).
Molecular trapping: binding partners
So far, we can only speculate about possible binding partners. The binding partners have to be immobile or comparatively slow-moving. For example, they should hardly move (<20 nm in distance) within the trapping duration of ∼10 ms, i.e., they should have diffusion coefficients ≤ 0.01 μm2/s. Cholesterol is inherent in the membrane bilayer and could thus assist binding via the ceramide moiety, but not via the polar headgroup. On the other hand, the cytoskeleton dependence of the sphingolipids (e.g., SM) most probably was not evoked by the lipids being directly arrested to the actin or other network. More likely, the diffusion of a binding partner was hindered by the cytoskeleton and released upon depolymerization. The observed molecular specificities of the various lipids may highlight a nanoscopic molecular connectivity between lipids and proteins, which may play an important role in cellular signaling (32). For example, cell growth is modulated by the binding of GM3 to the epidermal growth factor receptor (33–35).
Molecular trapping: comparison with lipid rafts
Our STED-FCS measurements indicate that the lipids did not explore an area > 20 nm in diameter during trapping; rather, they interacted on nanoscopic spatial scales and formed a transient molecular-sized complex. However, because we observed the dynamics of single molecules only, we cannot rule out the possibility that additional lipid or protein molecules were (temporarily) included in this complex. Therefore, a question arises as to how the observed nanoscopic interactions relate to the most common picture of membrane heterogeneity: lipid nanodomains or rafts (1–3,5). In 1997, Simons and Ikonen (1) introduced the lipid raft concept and postulated that tightly packed sphingolipid-cholesterol-protein assemblies serve a function in membrane trafficking and signaling. Cholesterol-dependent, liquid-ordered phases in model membranes are often taken as model systems for the tight molecular packing in lipid rafts (1–3,5), even though the order parameter of the phases in model membranes is expected to differ substantially from those observed in cell membranes (36). Altogether, the raft picture is still unclear, partly because of the lack of spatial resolution in conventional optical microscopy.
Using the superior resolution of STED nanoscopy, we did not detect stable and immobile complexes as previously observed for lipid-anchored proteins by other methods (4). Our previous STED images of fluorescent SM revealed a homogeneous distribution of these heterogeneously diffusing lipids. This homogeneous distribution followed from the fact that the complexes were highly dynamic, and that at a certain time point, about half of the labeled lipids moved freely and the other half were trapped (16).
We observed a decrease in the trapping of SM with a decrease in the levels of cholesterol and endogenous SM (Supporting Material and Fig. S5), indicating the involvement of not only cholesterol but also other SM lipids in the molecular complexes of SM. However, the interactions of GM1 (often referred to as a lipid raft marker) showed much less dependence on levels of endogenous SM or cholesterol than SM, i.e., the observed molecular complexes built up by GM1 differed from those assisted by SM and cholesterol. In contrast to general observations made for the phase partitioning in model membranes, for example (37–40), our STED-FCS experiments demonstrated hardly any influence by the dye label (Supporting Material). However, the fluorescent analogs of the lipids used in our experiments did not enter the liquid-ordered phase in model membranes (Fig. S6) (41), probably due to the presence of the rather bulky dye label. Consequently, we assume that the observed transient trapping, with its rather strong binding to other membrane constituents, follows a different molecular mechanism than that of the weak interactions responsible for the formation of ordered phases in model membranes. Because of the low order partitioning of the applied fluorescent lipid analogs, the observation of ordered nanodomains in living cell membranes was not feasible, and we do not rule out their existence.
If we consider our STED-FCS observations in the context of lipid rafts, we may support a current view that (sphingo)lipid rafts may establish “fluctuating nanoscale assemblies of sphingolipid, cholesterol, and proteins that can be stabilized to coalesce, forming platforms that function in membrane signaling and trafficking” (5). Our experiments may highlight the fluctuating nanoscale assemblies, which then seem to be highly diverse and strongly dependent on the lipid structure. It remains to be seen whether these fluctuating nanoscale assemblies can be stabilized to coalesce into more tightly packed domains (5,42). A fluorescent lipid analog that partitions into the liquid-ordered phase of model membranes (like its natural counterpart) may be able to report on this coalescence. However, currently available liquid-order markers such as Laurdan (43), fluorescent cholesterol analogs (40), Nile Red derivatives (44), and phosphoglycero- and asialo GM1 analogs labeled with NBD (45) or Alexa 488 (46), respectively, are not compatible with the present STED-FCS setup.
Conclusions
STED-FCS is an exceptional tool that can be used to highlight the diversity of lipid interactions in the plasma membrane of living cells. Conventional diffraction-limited optics cannot directly report on these differences, because these interactions occur on nanoscopic length scales. Techniques that extrapolate results from diffraction-limited measurements may not deliver the required accuracy. Only the analysis of data recorded by STED-FCS at the desired spatial scales (<50 nm) revealed transient (∼10 ms) formations of lipid complexes with other membrane constituents, such as proteins, and highlighted even subtle differences for different fluorescent lipid analogs. These differences were dependent on the lipid structure (especially on the structural ceramide element close to the water-lipid interface) and the headgroup, and included 1), weak interactions on timescales of ∼1 ms of phosphoglycerolipids without hydroxyl-containing headgroups, such as PE and PC; 2), hydroxyl-containing headgroup-assisted but almost cholesterol- and cytoskeleton-independent binding for lipids such as gangliosides, GalCer, and phosphoinositol; and 3), most strongly, cholesterol-assisted and cytoskeleton-dependent binding mediated by the ceramide moiety of sphingolipids, such as SM. The strong interactions are different from those responsible for phase separation in model membranes and may be precursors for the (transient) coalescence of several lipids and proteins, forming signaling platforms (or lipid rafts). The diversity in the observed lipid dynamics once again highlights the strong heterogeneity of the plasma membrane and points to a nanoscopic molecular connectivity between lipids and proteins, which may play an important role in cellular functionalities.
More details about the spatial heterogeneity of the nanoscopic lipid trapping and the respective binding partners may be revealed by introducing a second color and using methods such as scanning FCS (47,48). STED-FCS measurements in the different phases of model membranes may give more information on similarities or dissimilarities between live-cell interactions and liquid-order partitioning. Comparative measurements in largely separated phases reported for cellular plasma membranes treated by swelling procedures (e.g., giant plasma membrane vesicles and plasma membrane spheres (32,49)) or of giant unilamellar vesicles composed of native membranes (50) may provide further information, because these procedures separate the plasma membrane from cytoskeletal, endocytic, or exocytic influences while leaving the membrane's molecular versatility unmitigated. Most importantly, a fluorescent probe that does not alter phase partitioning and is compatible with STED-FCS will reveal additional details on the existence of liquid-ordered nanodomains (or rafts).
Our results show that STED-FCS is a sensitive and unique tool for studying nanoscale membrane organization, and determining the cellular functions and molecular interdependencies of membrane components.
Acknowledgments
We thank Andreas Schönle (MPI-BPC Göttingen), Steffen Sahl (MPI-BPC Göttingen, now Stanford University), Birka Lalkens (MPI-BPC Göttingen, now TU Braunschweig), and the Simons group (MPI-CBG Dresden) for fruitful discussions, Tanja Gilat and Ellen Rothermel (MPI-BPC Göttingen) for helpful assistance, Jens Ehrig (Biotec Dresden) for help on the SLB, and Jay Jethwa (MPI-BPC Göttingen) for critical reading of the manuscript.
Footnotes
C. Ringemann's present address is Roche Diagnostics GmbH, Mannheim, Germany.
R. Medda's present address is Department Biophysical Chemistry, University Heidelberg, Heidelberg, Germany.
M. Leutenegger's present address is Laboratoire d'Optique Biomédicale, Ecole Polytechnique Fédérale de Lausanne, Lausanne, Switzerland.
S. Polyakova's present address is Institute of Organic Chemistry and Biochemistry Academy of Sciences of the Czech Republic, Prague, Czech Republic.
Supporting Material
References
- 1.Simons K., Ikonen E. Functional rafts in cell membranes. Nature. 1997;387:569–572. doi: 10.1038/42408. [DOI] [PubMed] [Google Scholar]
- 2.Jacobson K., Mouritsen O.G., Anderson R.G. Lipid rafts: at a crossroad between cell biology and physics. Nat. Cell Biol. 2007;9:7–14. doi: 10.1038/ncb0107-7. [DOI] [PubMed] [Google Scholar]
- 3.Hanzal-Bayer M.F., Hancock J.F. Lipid rafts and membrane traffic. FEBS Lett. 2007;581:2098–2104. doi: 10.1016/j.febslet.2007.03.019. [DOI] [PubMed] [Google Scholar]
- 4.Goswami D., Gowrishankar K., Mayor S. Nanoclusters of GPI-anchored proteins are formed by cortical actin-driven activity. Cell. 2008;135:1085–1097. doi: 10.1016/j.cell.2008.11.032. [DOI] [PMC free article] [PubMed] [Google Scholar]
- 5.Lingwood D., Simons K. Lipid rafts as a membrane-organizing principle. Science. 2010;327:46–50. doi: 10.1126/science.1174621. [DOI] [PubMed] [Google Scholar]
- 6.Kusumi A., Shirai Y.M., Fujiwara T.K. Hierarchical organization of the plasma membrane: investigations by single-molecule tracking vs. fluorescence correlation spectroscopy. FEBS Lett. 2010;584:1814–1823. doi: 10.1016/j.febslet.2010.02.047. [DOI] [PubMed] [Google Scholar]
- 7.Pike L.J. Rafts defined: a report on the Keystone Symposium on lipid rafts and cell function. J. Lipid Res. 2006;47:1597–1598. doi: 10.1194/jlr.E600002-JLR200. [DOI] [PubMed] [Google Scholar]
- 8.Fahey P.F., Koppel D.E., Webb W.W. Lateral diffusion in planar lipid bilayers. Science. 1977;195:305–306. doi: 10.1126/science.831279. [DOI] [PubMed] [Google Scholar]
- 9.Schwille P., Korlach J., Webb W.W. Fluorescence correlation spectroscopy with single-molecule sensitivity on cell and model membranes. Cytometry. 1999;36:176–182. doi: 10.1002/(sici)1097-0320(19990701)36:3<176::aid-cyto5>3.0.co;2-f. [DOI] [PubMed] [Google Scholar]
- 10.Wawrezinieck L., Rigneault H., Lenne P.F. Fluorescence correlation spectroscopy diffusion laws to probe the submicron cell membrane organization. Biophys. J. 2005;89:4029–4042. doi: 10.1529/biophysj.105.067959. [DOI] [PMC free article] [PubMed] [Google Scholar]
- 11.Sankaran J., Manna M., Wohland T. Diffusion, transport, and cell membrane organization investigated by imaging fluorescence cross-correlation spectroscopy. Biophys. J. 2009;97:2630–2639. doi: 10.1016/j.bpj.2009.08.025. [DOI] [PMC free article] [PubMed] [Google Scholar]
- 12.He H.T., Marguet D. Detecting nanodomains in living cell membrane by fluorescence correlation spectroscopy. Annu. Rev. Phys. Chem. 2011;62:417–436. doi: 10.1146/annurev-physchem-032210-103402. [DOI] [PubMed] [Google Scholar]
- 13.Humpolícková J., Gielen E., Engelborghs Y. Probing diffusion laws within cellular membranes by Z-scan fluorescence correlation spectroscopy. Biophys. J. 2006;91:L23–L25. doi: 10.1529/biophysj.106.089474. [DOI] [PMC free article] [PubMed] [Google Scholar]
- 14.Ruprecht V., Wieser S., Schütz G.J. Spot variation fluorescence correlation spectroscopy allows for superresolution chronoscopy of confinement times in membranes. Biophys. J. 2011;100:2839–2845. doi: 10.1016/j.bpj.2011.04.035. [DOI] [PMC free article] [PubMed] [Google Scholar]
- 15.Kastrup L., Blom H., Hell S.W. Fluorescence fluctuation spectroscopy in subdiffraction focal volumes. Phys. Rev. Lett. 2005;94:178104. doi: 10.1103/PhysRevLett.94.178104. [DOI] [PubMed] [Google Scholar]
- 16.Eggeling C., Ringemann C., Hell S.W. Direct observation of the nanoscale dynamics of membrane lipids in a living cell. Nature. 2009;457:1159–1162. doi: 10.1038/nature07596. [DOI] [PubMed] [Google Scholar]
- 17.Ringemann C., Harke B., Eggeling C. Exploring single-molecule dynamics with fluorescence nanoscopy. New J. Phys. 2009;11:103054. [Google Scholar]
- 18.Hell S.W., Wichmann J. Breaking the diffraction resolution limit by stimulated emission: stimulated-emission-depletion fluorescence microscopy. Opt. Lett. 1994;19:780–782. doi: 10.1364/ol.19.000780. [DOI] [PubMed] [Google Scholar]
- 19.Hell S.W. Microscopy and its focal switch. Nat. Methods. 2009;6:24–32. doi: 10.1038/nmeth.1291. [DOI] [PubMed] [Google Scholar]
- 20.Lenne P.F., Wawrezinieck L., Marguet D. Dynamic molecular confinement in the plasma membrane by microdomains and the cytoskeleton meshwork. EMBO J. 2006;25:3245–3256. doi: 10.1038/sj.emboj.7601214. [DOI] [PMC free article] [PubMed] [Google Scholar]
- 21.Sahl S.J., Leutenegger M., Eggeling C. Fast molecular tracking maps nanoscale dynamics of plasma membrane lipids. Proc. Natl. Acad. Sci. USA. 2010;107:6829–6834. doi: 10.1073/pnas.0912894107. [DOI] [PMC free article] [PubMed] [Google Scholar]
- 22.Manzo C., van Zanten T.S., Garcia-Parajo M.F. Nanoscale fluorescence correlation spectroscopy on intact living cell membranes with NSOM probes. Biophys. J. 2011;100:L08–L10. doi: 10.1016/j.bpj.2010.12.3690. [DOI] [PMC free article] [PubMed] [Google Scholar]
- 23.Michelman-Ribeiro A., Mazza D., McNally J.G. Direct measurement of association and dissociation rates of DNA binding in live cells by fluorescence correlation spectroscopy. Biophys. J. 2009;97:337–346. doi: 10.1016/j.bpj.2009.04.027. [DOI] [PMC free article] [PubMed] [Google Scholar]
- 24.Pascher I. Molecular arrangements in sphingolipids. Conformation and hydrogen bonding of ceramide and their implication on membrane stability and permeability. Biochim. Biophys. Acta. 1976;455:433–451. doi: 10.1016/0005-2736(76)90316-3. [DOI] [PubMed] [Google Scholar]
- 25.Nishimura S.Y., Vrljic M., Moerner W.E. Cholesterol depletion induces solid-like regions in the plasma membrane. Biophys. J. 2006;90:927–938. doi: 10.1529/biophysj.105.070524. [DOI] [PMC free article] [PubMed] [Google Scholar]
- 26.Lasserre R., Guo X.J., He H.T. Raft nanodomains contribute to Akt/PKB plasma membrane recruitment and activation. Nat. Chem. Biol. 2008;4:538–547. doi: 10.1038/nchembio.103. [DOI] [PubMed] [Google Scholar]
- 27.Bubb M.R., Spector I., Fosen K.M. Effects of jasplakinolide on the kinetics of actin polymerization. An explanation for certain in vivo observations. J. Biol. Chem. 2000;275:5163–5170. doi: 10.1074/jbc.275.7.5163. [DOI] [PubMed] [Google Scholar]
- 28.Fujiwara T., Ritchie K., Kusumi A. Phospholipids undergo hop diffusion in compartmentalized cell membrane. J. Cell Biol. 2002;157:1071–1081. doi: 10.1083/jcb.200202050. [DOI] [PMC free article] [PubMed] [Google Scholar]
- 29.Björkbom A., Róg T., Slotte J.P. Effect of sphingomyelin headgroup size on molecular properties and interactions with cholesterol. Biophys. J. 2010;99:3300–3308. doi: 10.1016/j.bpj.2010.09.049. [DOI] [PMC free article] [PubMed] [Google Scholar]
- 30.Megha, and E., London Ceramide selectively displaces cholesterol from ordered lipid domains (rafts): implications for lipid raft structure and function. J. Biol. Chem. 2004;279:9997–10004. doi: 10.1074/jbc.M309992200. [DOI] [PubMed] [Google Scholar]
- 31.Chiantia S., Kahya N., Schwille P. Effects of ceramide on liquid-ordered domains investigated by simultaneous AFM and FCS. Biophys. J. 2006;90:4500–4508. doi: 10.1529/biophysj.106.081026. [DOI] [PMC free article] [PubMed] [Google Scholar]
- 32.Lingwood D., Ries J., Simons K. Plasma membranes are poised for activation of raft phase coalescence at physiological temperature. Proc. Natl. Acad. Sci. USA. 2008;105:10005–10010. doi: 10.1073/pnas.0804374105. [DOI] [PMC free article] [PubMed] [Google Scholar]
- 33.Bremer E.G., Schlessinger J., Hakomori S. Ganglioside-mediated modulation of cell growth. Specific effects of GM3 on tyrosine phosphorylation of the epidermal growth factor receptor. J. Biol. Chem. 1986;261:2434–2440. [PubMed] [Google Scholar]
- 34.Kawashima N., Yoon S.-J., Nakayama K. Tyrosine kinase activity of epidermal growth factor receptor is regulated by GM3 binding through carbohydrate to carbohydrate interactions. J. Biol. Chem. 2009;284:6147–6155. doi: 10.1074/jbc.M808171200. [DOI] [PubMed] [Google Scholar]
- 35.Coskun Ü., Grzybek M., Simons K. Regulation of human EGF receptor by lipids. Proc. Natl. Acad. Sci. USA. 2011;108:9044–9048. doi: 10.1073/pnas.1105666108. [DOI] [PMC free article] [PubMed] [Google Scholar]
- 36.Kaiser H.-J., Lingwood D., Simons K. Order of lipid phases in model and plasma membranes. Proc. Natl. Acad. Sci. USA. 2009;106:16645–16650. doi: 10.1073/pnas.0908987106. [DOI] [PMC free article] [PubMed] [Google Scholar]
- 37.Wang T.Y., Silvius J.R. Different sphingolipids show differential partitioning into sphingolipid/cholesterol-rich domains in lipid bilayers. Biophys. J. 2000;79:1478–1489. doi: 10.1016/S0006-3495(00)76399-5. [DOI] [PMC free article] [PubMed] [Google Scholar]
- 38.Shaw J.E., Epand R.F., Yip C.M. Correlated fluorescence-atomic force microscopy of membrane domains: structure of fluorescence probes determines lipid localization. Biophys. J. 2006;90:2170–2178. doi: 10.1529/biophysj.105.073510. [DOI] [PMC free article] [PubMed] [Google Scholar]
- 39.Bacia K., Scherfeld D., Schwille P. Fluorescence correlation spectroscopy relates rafts in model and native membranes. Biophys. J. 2004;87:1034–1043. doi: 10.1529/biophysj.104.040519. [DOI] [PMC free article] [PubMed] [Google Scholar]
- 40.Baumgart T., Hunt G., Feigenson G.W. Fluorescence probe partitioning between Lo/Ld phases in lipid membranes. Biochim. Biophys. Acta. 2007;1768:2182–2194. doi: 10.1016/j.bbamem.2007.05.012. [DOI] [PMC free article] [PubMed] [Google Scholar]
- 41.Honigmann A., Walter C., Wagner R. Characterization of horizontal lipid bilayers as a model system to study lipid phase separation. Biophys. J. 2010;98:2886–2894. doi: 10.1016/j.bpj.2010.03.033. [DOI] [PMC free article] [PubMed] [Google Scholar]
- 42.Joly E. Hypothesis: could the signalling function of membrane microdomains involve a localized transition of lipids from liquid to solid state? BMC Cell Biol. 2004;5:3. doi: 10.1186/1471-2121-5-3. [DOI] [PMC free article] [PubMed] [Google Scholar]
- 43.Parasassi T., Krasnowska E.K., Gratton E. Laurdan and Prodan as polarity-sensitive fluorescent membrane probes. J. Fluoresc. 1998;8:365–373. [Google Scholar]
- 44.Kucherak O.A., Oncul S., Klymchenko A.S. Switchable Nile red-based probe for cholesterol and lipid order at the outer leaflet of biomembranes. J. Am. Chem. Soc. 2010;132:4907–4916. doi: 10.1021/ja100351w. [DOI] [PubMed] [Google Scholar]
- 45.Wan C., Kiessling V., Tamm L.K. Coupling of cholesterol-rich lipid phases in asymmetric bilayers. Biochemistry. 2008;47:2190–2198. doi: 10.1021/bi7021552. [DOI] [PubMed] [Google Scholar]
- 46.Burns A.R., Frankel D.J., Buranda T. Local mobility in lipid domains of supported bilayers characterized by atomic force microscopy and fluorescence correlation spectroscopy. Biophys. J. 2005;89:1081–1093. doi: 10.1529/biophysj.105.060327. [DOI] [PMC free article] [PubMed] [Google Scholar]
- 47.Ruan Q.Q., Cheng M.A., Mantulin W.W. Spatial-temporal studies of membrane dynamics: scanning fluorescence correlation spectroscopy (SFCS) Biophys. J. 2004;87:1260–1267. doi: 10.1529/biophysj.103.036483. [DOI] [PMC free article] [PubMed] [Google Scholar]
- 48.Ries J., Schwille P. Studying slow membrane dynamics with continuous wave scanning fluorescence correlation spectroscopy. Biophys. J. 2006;91:1915–1924. doi: 10.1529/biophysj.106.082297. [DOI] [PMC free article] [PubMed] [Google Scholar]
- 49.Baumgart T., Hammond A.T., Webb W.W. Large-scale fluid/fluid phase separation of proteins and lipids in giant plasma membrane vesicles. Proc. Natl. Acad. Sci. USA. 2007;104:3165–3170. doi: 10.1073/pnas.0611357104. [DOI] [PMC free article] [PubMed] [Google Scholar]
- 50.Montes L.R., Alonso A., Bagatolli L.A. Giant unilamellar vesicles electroformed from native membranes and organic lipid mixtures under physiological conditions. Biophys. J. 2007;93:3548–3554. doi: 10.1529/biophysj.107.116228. [DOI] [PMC free article] [PubMed] [Google Scholar]
- 51.Schwarzmann G., Sandhoff K. Lysogangliosides: synthesis and use in preparing labeled gangliosides. Methods Enzymol. 1987;138:319–341. doi: 10.1016/0076-6879(87)38028-0. [DOI] [PubMed] [Google Scholar]
- 52.Sarmientos F., Schwarzmann G., Sandhoff K. Direct evidence by carbon-13 NMR spectroscopy for the erythro configuration of the sphingoid moiety in Gaucher cerebroside and other natural sphingolipids. Eur. J. Biochem. 1985;146:59–64. doi: 10.1111/j.1432-1033.1985.tb08619.x. [DOI] [PubMed] [Google Scholar]
- 53.von Nicolai H., Müller H.E., Zilliken F. Substrate specificity of neuraminidase from Erysipelothrix rhusiopathiae. Hoppe Seylers Z. Physiol. Chem. 1978;359:393–398. doi: 10.1515/bchm.1978.359.1.393. [DOI] [PubMed] [Google Scholar]
- 54.Albrecht B., Pütz U., Schwarzmann G. Synthesis of fluorescent and radioactive analogues of two lactosylceramides and glucosylceramide containing β-thioglycosidic bonds that are resistant to enzymatic degradation. Carbohydr. Res. 1995;276:289–308. doi: 10.1016/0008-6215(95)00189-z. [DOI] [PubMed] [Google Scholar]
- 55.Schwarzmann G., Hofmann P., Pütz U. Synthesis of ganglioside GM1 containing a thioglycosidic bond to its labeled ceramide(s). A facile synthesis starting from natural gangliosides. Carbohydr. Res. 1997;304:43–52. doi: 10.1016/s0008-6215(97)00202-4. [DOI] [PubMed] [Google Scholar]
- 56.Kolmakov K., Belov V.N., Hell S.W. Red-emitting rhodamine dyes for fluorescence microscopy and nanoscopy. Chemistry. 2010;16:158–166. doi: 10.1002/chem.200902309. [DOI] [PubMed] [Google Scholar]
Associated Data
This section collects any data citations, data availability statements, or supplementary materials included in this article.