

Abstract
The NaK channel is a cation selective channel with similar permeability for K+ and Na+. The available crystallographic structure of wild-type (WT) NaK is usually associated with a conductive state of the channel. Here, potential of mean force for complete conduction events of Na+ and K+ ions through NaK show that: i), large energy barriers prevent the passage of ions through the WT NaK structure, ii), the barriers are correlated to the presence of a hydrogen bond between Asp-66 and Asn-68, and iii), the structure of NaK mutated to mimic cyclic nucleotide-gated channels conducts Na+ and K+. These results support the hypothesis that the filter of cation selective channels can adopt at least two different structures: a conductive one, represented by the x-ray structures of the NaK-CNG chimeras, and a closed one, represented by the x-ray structures of the WT NaK.
Introduction
Since the seminal x-ray crystallographic studies resulting in the structure of KcsA (1), various other structures of ion channels have been determined (2–5), more recently the NaK channel (6). The hallmark of K+ channels is their high selectivity for K+ ions over Na+ ions, usually in the ratio of 1 Na+ ion every 104 K+ ions (7). The origin of this extremely high selectivity has been the subject of numerous experimental (8–11) and computational (12–16) studies. In this context, the structure of the NaK channel offers a new opportunity for progress in our understanding of ion selectivity. In contrast to K+ channels, NaK is as selective for K+ as for Na+. Therefore, characterization and comparison of the free energy landscapes governing the multiion translocation in NaK and K+-channels could shed new light into the atomic details of ion selectivity. The NaK channel shares the same general architecture of K+ channels, with four subunits symmetrically arranged around the central axis of the pore (1,6). Each subunit is composed of three α-helices: the outer and the inner helices, which extend across the entire lipid membrane, and a short pore helix, oblique to the channel axis. As perhaps expected, the main differences with K+-channels are localized at the selectivity filter. In K+-channels the filter is defined by a highly conserved amino acid sequence TVGYG, which becomes T63VGDG67 in NaK. This single amino acid substitution seems to have a deep impact on the structure of the selectivity filter (Fig. 1). Four identical binding sites, S1–S4, characterize the pore of K+ channels (1). In each of these sites, a K+ ion is coordinated by eight oxygen atoms from the protein. In the selectivity filter of NaK, binding sites S4 and S3 are conserved, whereas binding sites corresponding to S2 and S1 become a vestibule where K+ and Na+ ions can diffuse (17).
Figure 1.
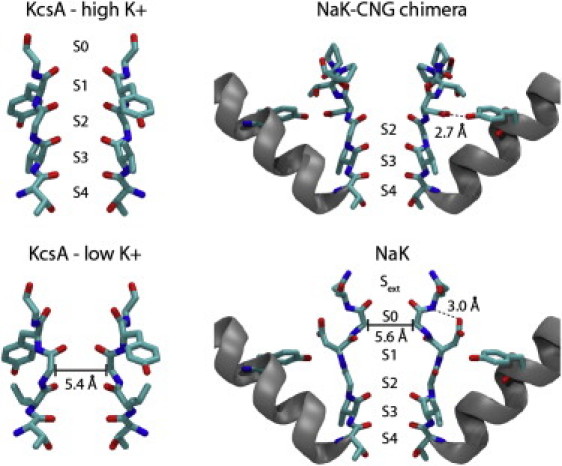
Structure of the selectivity filter of KcsA, NaK, and NaK-CNG chimera. (Left) Selectivity filter of KcsA at high-K+ or low-K+ concentration, residues 75–79 of two opposite subunits are shown in licorice representation. S0–S4 indicates K+ binding sites in the high-K+ structure. Site S2 disappears in the low-K+ structure, where the distance between the Cα of Gly-76 decreases to 5.4 Å. (Right) Selectivity filter and pore helix of two opposite subunits in NaK and NaK-CNG chimera. Cartoon representation is used for the pore helices, whereas residues 63–68 and 55 are in licorice representation. The hydrogen bond between the side chain of Asp-66 and Tyr-55 is highlighted in the NaK-CNG structure. In WT NaK, Asp-66 makes a hydrogen bond with the backbone nitrogen of Asn-68, and the filter reaches a minimum radius of 5.6 Å at the level of the Cα of Gly-67.
In a subgroup of K+ channels, like KcsA, the presence of K+ ions is necessary to stabilize the conductive state of the selectivity filter (Fig. 1, KcsA high-K+), otherwise, in low-K+/high-Na+ concentration (Fig. 1, KcsA low-K+), the selectivity filter collapses at the level of binding site S2 (18). This structure is closed and prevents ion conduction (19,20). In contrast, other K+ channels, like MthK, preserve the same architecture of the selectivity filter at either high- or low-K+ concentrations (21). Subtle structural differences in the vicinity of the selectivity filter may explain this diversity in K+ channels. On close inspection of the available K+-channel structures, a hydrogen bond between a residue at the C-terminal of the selectivity filter (Asp-80 in KcsA) and a residue at the C-terminal of the pore helix (Glu-71 in KcsA) is observed. This interaction stabilizes the collapsed structure of the pore (22,23). In contrast, hydrogen bonds and van der Waals interactions between the tyrosine in the middle of the selectivity filter and two aromatic residues in the pore helix (Trp-67 and Trp-68 in KcsA) stabilize the conductive state (1). The balance between these interactions will favor one over the other, providing an explanation for the different properties of KcsA and MthK.
The situation is apparently simpler in the case of the NaK channel, whose selectivity filter adopts the same conformation in low-K+/high-Na+ and high-K+/low-Na+ concentrations (17). In NaK, residue Asp-66 corresponds to the Tyr residue in the selectivity filter sequence of K+-channels. In K+-channels, the side chain of this Tyr residue points laterally and participates in a hydrogen bond network with residues of the pore helix. In contrast in NaK, the side chain of Asp-66 points toward the extracellular solution, and forms a hydrogen bond with the backbone of Asn-68, which is thought to be important for the structural stability of the NaK selectivity filter (24). Interestingly, Asn-68 in NaK corresponds to Asp-80 in KcsA, and it has been shown that in KcsA, the rate and extent of C-type inactivation is governed by interactions involving residues Trp-67, Glu-71, and Asp-80 behind the selectivity filter (22,25).
The pore of the NaK channel has been engineered with mutations in residues 66–70 to mimic the selectivity filter of cyclic nucleotide-gated (CNG) channels (11). A conserved feature of CNG channels is the presence of three consecutive proline residues at the extracellular side of the filter. When these modifications are introduced in the NaK channel, the side chain of residue 66 does not point toward the extracellular side anymore, but it is instead directed toward the pore helix, where it forms a hydrogen bond with the side chain of Tyr-55. This interaction stabilizes a new structure of the filter, characterized by three binding sites analogous to sites S4, S3, and S2 of K+-channels (Fig. 1, NaK-CNG chimera). The NaK-CNG chimeras remain nonselective for K+ over Na+ (26).
Computational studies to characterize the energetic of ion conduction at the atomic level in the wild-type (WT) NaK channel have been already described in the literature (27–29). Conduction through WT NaK was first analyzed by molecular dynamics (MD) simulations with an applied transmembrane electric field (27). To observe conduction events in the timescale of these simulations, application of an extremely high electric field equivalent to a potential difference across the filter of ∼2 V was required. Under these circumstances, it should not be surprising that the channel may behave differently than under physiological conditions when transmembrane potentials are in the range of ±100 mV. Moreover, the calculated conductance values of NaK (27) increased more than linearly with the applied electric field, which indicates the presence of high energetic barriers that prevent ion permeation. The potential of mean force (PMF) presented in (28) for the permeation of K+ and Na+ ions through the selectivity filter of NaK suggested that the energy barriers are correlated with the exchange of water molecules between the water-filled cavity and the back of the selectivity filter. High barriers were detected when no exchange of water was allowed. However, even in optimal conditions, the energy barriers for Na+ permeation were higher than 8 kcal/mol, and the simulation of a complete conduction event of Na+ ions was only monitored when a transmembrane potential of 2 V was applied. These observations suggest that the crystallographic structure of WT NaK is representative of a nonconductive state of the channel.
In light of the new crystal structures of NaK-CNG chimeras, we carried out a comparison between the potentials of mean force governing the translocation of Na+ and K+ ions in the WT and the mutant NaK channels. Because the NaK-CNG chimeras are not selective for K+ over Na+, analyses of the multiion potential energy surface of the NaK-CNG chimeras cannot only provide new insights into the mechanisms of ion selectivity, but also about the gating mechanisms in cation selective channels. Here, the PMF for ion conduction through four different channel models, referred as NaK-Xray, NaK-D66A, NaK-CNG, and NaK-3S were calculated. The crystallographic structure of the WT channel was one of the models in the computations, NaK-Xray (17). Because the hydrogen bond between Asp-66 and Asn-68 is potentially important for the integrity of the selectivity filter, a model with the Asp-66-Ala mutation was also considered (NaK-D66A model). The third model, NaK-CNG, was defined according to the crystallographic structure of the NaK channel mutated to mimic the filter of CNG channels (11), and finally a model of the WT channel with the selectivity filter modified to adopt the structure seen in the chimera was considered. This model is designated NaK-3S, to highlight the presence of three binding sites in the selectivity filter.
Materials and Methods
MD simulations
MD trajectories were simulated with the version 2.7 of NAMD (30), using the CHARMM27 force field with CMAP corrections (31), and the TIP3P model for water molecules (32). Parameters for K+ and Na+ ions inside the channel were defined according to (33). All the simulations were performed in the NpT ensemble. The pressure was maintained at 1 atm using a Nose-Hoover Langevin piston control (34), with a period of 100 fs and damping time constant of 50 fs. Temperature was maintained at 300 K by coupling to a Langevin thermostat, with damping coefficient of 5 ps−1. Electrostatic interactions were treated by the particle mesh Ewald algorithm (35), with grid spacing lower than 1 Å. Smoothed cutoff (10–12 Å) was used for the van der Waals interactions. Equations of motion were integrated with a time step of 2 fs. The SETTLE algorithm was used to restraint hydrogen atoms (36).
The PMF for K+ and Na+ ions inside the filter was calculated considering the motion of four ions, using the umbrella sampling technique (37,38). The choice to simulate a 4-ion process was subsequently justified by the fact that the energies of the states with four ions inside the filter were lower (or comparable) to the energies with fewer ions. Harmonic potentials restrained the positions along the z axis of ions 1 and 4 (force constant 10 kcal·mol-1·Å−2), and of the center of mass of ions 2 and 3 (force constant 20 kcal·mol-1·Å–2). As initial guess, the center of the harmonic potential acting on ion 1 moved from 7 Å below the position of the carbonyl oxygen atoms of residues Thr-63 to 1 Å above, in steps of 1 Å. For each position of the harmonic potential acting on ion 1, the center of the harmonic potential acting on ions 2–3 moved from 6 Å to 13 Å above, in steps of 0.5 Å. The center of the harmonic potential on ion 4 moved from 6 Å to 13 Å above the center of the harmonic potential on ions 2–3, in steps of 1 Å. This initial set of umbrella sampling simulation covers all the possible configurations of ions in the filter, with two adjacent ions never closer than 1 binding site (3 Å is the average distance between the center of two consecutive binding sites), and never further than 3 binding sites. Between 600 and 1200 windows per system were computed rendering a total simulation time of 72–180 ns per system. Umbrella sampling simulations with harmonic potential restraints centered outside the predefined ranges were added when the preliminary analysis revealed the presence of energy minima that extended beyond the region of the configurational space sampled. The starting structures for the umbrella sampling simulations were generated by systematically translating the ions to their particular positions, and moving the surrounding water molecules accordingly. The initial coordinates for these computations are described in the next section. Each umbrella sampling simulation consisted of 5000 steps of energy minimization with restraints applied to the backbone atoms of the filter, followed by 120 ps of MD trajectory with harmonic restraints only on ions 1–4. The last 100 ps were used to calculate four-dimensional PMF with the weighted histogram analysis method (39).
Atomic systems
The channel structures in the atomic systems NaK-Xray and NaK-CNG were defined according to PDB files 3E8H (17) and 3K03 (26). Residues 22–113 were included in the channel models, together with the crystallographic water molecules, and the K+ ions in the filter. Ions were placed in the intracellular cavity, S4, S2, and Sext. Channels were centered in the x-y plane with the permeation pathway aligned to the z axis, and embedded in a preequilibrated bilayer of 569 dioleoylphosphatidylcholine molecules. The upper layer of the lipid membrane was aligned to the center of mass along z of the phenylalanine residues at the C-terminal of the outer helixes (Phe-75 in NaK-Xray, Phe-74 in NaK-CNG). Lipid molecules closer than 1.2 Å to protein atoms were removed. The systems were solvated with >15,000 water molecules. Potassium and chloride ions were added to neutralize the system (up to a final concentration of 150 mM). To equilibrate the atoms around the channels, 2000 steps of energy minimization and 400 ps of MD were performed, with restraints applied to the backbone atoms of the protein, the oxygen atoms of the crystallographic water molecules, and the ions in the filter. Restraints were initially set to 10 kcal·mol−1·Å−2, and gradually reduced to zero. Unrestrained MD simulation followed. The atomic systems used for the energetic analyses were taken after 1 ns of unrestrained MD.
The atomic system NaK-Xray was the starting structure for the definition of NaK-D66A and NaK-3S. To define NaK-D66A, the amino acid Asp-66 was manually mutated to Ala, and the same equilibration protocol described in the previous paragraph was performed. The mutation Asp-66-Ala does not alter the crystallographic structure of the filter, which justifies the procedure adopted. Because the crystallographic structure of the Asp-66-Ala mutated channel (PDB 2Q67) refers to a closed channel (24), we preferred to model, and to analyze, the Asp-66-Ala mutation in the background of the 3E8H crystallographic structure, where the intracellular gate is open. The structure of the filter in the PDB entry 3K03 was the template for the definition of the atomic system NaK-3S. Amino acids 63–70 of 3K03 were superimposed onto the corresponding amino acids of NaK-Xray. The water molecules observed in the crystallographic structure 3K03 were then introduced into the NaK-3S model. Lipid molecules and water in the baths were equilibrated with the same protocol used for the other three systems. Harmonic restraints were applied to the backbone atoms of residues 63–70, to the crystallographic water molecules, and to the ions in the filter. The centers for these harmonic potentials were the positions of the corresponding atoms in 3K03. After energy minimization for 20,000 steps, the system was simulated for 6.5 ns with decreasing harmonic restraints (10 kcal·mol−1·Å−2 for 0.5 ns, 5 kcal·mol−1·Å−2 for 1 ns, 2 kcal·mol−1·Å−2 for 2 ns, 1 kcal·mol−1·Å−2 for 3 ns). Unrestrained MD simulation followed for 20 ns. The final snapshot from the trajectory was used for the energetic analyses.
Results
Conduction through the WT NaK structure
The following notation is used to define each region of the selectivity filter in the NaK structures (Fig. 1): S2 refers to the lower water-filled cavity; S1 refers to the upper water-filled cavity; S0 refers to the region around the Cα of Gly-67, even if a binding site is not well defined in NaK; and Sext refers to the binding site above S0, between the carbonyl oxygen atoms of Gly-67 and Asn-68. Ions are numbered in the same order of the binding sites, i.e., 1 to 4 starting at the extracellular side.
In the minimum energy configuration of K+ ions in the system NaK-Xray, ions were found in the following sites: ∼1 Å below the side-chain oxygen atoms of residues Thr-63, S3, S1, and Sext (configuration IV in Fig. 2 A, energy 1.8 kcal/mol). Starting from configuration IV of Fig. 2 A, an energy barrier of 6.6 kcal/mol prevents the outward movement of ion K3 from S3 to the water-filled cavity (configuration V, energy 6.4 kcal/mol). From configuration IV the movement in the direction of configuration II (energy 5.9 kcal/mol) is associated with an even higher energetic barrier close to 13 kcal/mol. Configurations II–V are snapshots from a conduction event, which would be completed by the outward motion of ion K1 from Sext to the extracellular medium. The energy barriers along this permeation pathway are higher than 10 kcal/mol. This situation corresponds to the permeation pathway with the lowest energy barriers in the four-dimensional PMF shown in Fig. 2 A. The highest energy barriers along this pathway are associated with the movement of ions across S0. S0 not only does correspond to the narrowest region of the selectivity filter (radius ∼5.6 Å), but it is also the only location where an ion directly interacts with Cα and H atoms. A K+ ion needs to overcome an energetic barrier of 9.2 and 13.2 kcal/mol, respectively, in the outward and inward direction, to slide through this constriction when three K+ ions are present at the intracellular side (transition II-III). When only two ions are present at the intracellular side, traversing S0 becomes practically impossible (transition V-VI, barriers >15 kcal/mol). The energy profile along the minimum energy path, calculated by the string method (40) that connects the various ion configurations, is provided in the Supporting Material (Fig. S1) for all the systems analyzed.
Figure 2.
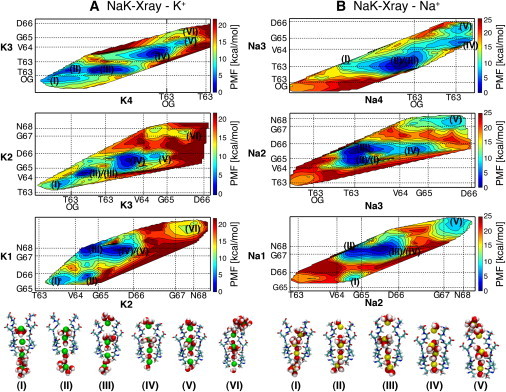
Energy maps for K+ (A) and Na+ (B) conduction in NaK-Xray. Two-dimensional projections of the four-dimensional PMF are shown. (A, top) PMF projected onto the coordinates of the two bottom (intracellular) ions, K4 and K3; (middle) PMF projected onto the coordinates of the two middle ions, K3 and K2; (bottom) PMF projected onto the coordinates of the two upper (extracellular) ions, K2 and K1. Counter lines are drawn every 2 kcal/mol. Ticks and dotted lines indicate the average positions of the carbonyl oxygen atoms of the amino acids lining the selectivity filter, and of the side-chain oxygen atoms of Thr-63 residues. Average positions were obtained from the trajectories of the umbrella sampling simulations. Snapshots of the selectivity filter with ions K1–4 and surrounding water molecules within 3 Å from ions are shown. (B) Analogous for Na+.
In contrast, when four Na+ ions are considered, the most stable configuration has ions: ∼1 Å below the side-chain oxygen atoms of residues Thr-63, in-plane with the carbonyl oxygen atoms of Thr-63, in S1 and in Sext (configuration III in Fig. 2 B, energy 1.3 kcal/mol). It is interesting to compare the minimum energy configurations of K+ and Na+ ions (configuration IV of Fig. 2 A versus configuration III of Fig. 2 B). Ions 1 and 4, at the boundaries of the selectivity filter occupy similar positions. In contrast, when ion 3 is Na+, it lays in-plane with the carbonyl oxygen atoms of Thr-63, and when it is K+ it is located in the center of S3. Another major difference between Na+ and K+ ions emerges in the configurations with two ions in the water-filled cavity. Starting from configuration II in Fig. 2 B, if ion Na1 is pushed inside the water-filled cavity in the direction of configuration I the energy increases significantly. The energy of the local minimum I is >8 kcal/mol higher than the energy of configuration II. For a filter filled up with K+ ions in an analogous transition (III-II in Fig. 2 A) the energy raises by ∼4.5 kcal/mol. The movement of a Na+ ion across S0, e.g., ion Na1 in the transition I-II, is associated with an energy barrier >10 kcal/mol, higher than the barrier observed for a K+ ion (∼10 and ∼20 kcal/mol respectively in the outward and inward directions). Similarly, a high-energy barrier is observed in the transition IV-V of Fig. 2 B, associated with the movement of ion Na2 across S0 (∼11 kcal/mol).
Effects of the Asp-66-Ala mutation on ion conduction
The main energetic barrier that K+ and Na+ ions have to overcome in the NaK-Xray structure during permeation is the translocation through S0. At the extracellular side of the filter, residues 66–70 are stabilized by a hydrogen bond between the side chain of Asp-66 and the backbone of Asn-68. Indeed, in the x-ray structures of the mutated channels, where this hydrogen bond does not exist, the residues at the extracellular side of the selectivity filter are more disordered (24). Therefore, an increase in the degree of mobility of the residues at the extracellular side of the selectivity filter could result from this mutation, which might be reflected in a reduction of the energetic barriers for ion conduction. To test this hypothesis, the PMF for K+ and Na+ conduction in NaK-D66A were calculated.
MD simulations of NaK-D66A confirmed the higher mobility of the residues at the extracellular side of the selectivity filter, and the expansion of the channel radius at the constriction point, site S0 (Fig. S2). In the x-ray structure of the Asp-66-Ala mutant, a water molecule behind Asn-68 mimics the side chain of Asn-66, making a hydrogen bond with the nitrogen of Asn-68. The same situation is observed in the MD trajectories of the NaK-D66A system. The entrance of a water molecule behind residue Asn-68 was favored by interactions with the side chain of residues Ser-70, interactions that also stabilized the water molecule once inside the binding pocket (Fig. S3).
In the case of K+ permeation, binding sites S4, S3, S2, S1, and Sext are energy minima in the free energy landscape (Fig. 3 A). The energy barrier associated with the passage of a K+ ion through S0 decreased from a minimum value of ∼10 kcal/mol in the case of the WT channel, to a minimum value of ∼8 kcal/mol in the case of the Asp-66-Ala mutant (transition II-III in Fig. 3 A, 12.5 and 7.6 kcal/mol in the outward and inward direction, respectively). The energy barrier along the minimum energy path that connects configurations I and III was ∼12 kcal/mol. Similarly, when the selectivity filter is loaded with Na+ ions, the permeation barrier through S0 also decreases compared to barriers in the WT channel. The energy barriers for Na+ translocation through S0 remain well above 10 kcal/mol (Fig. 3 B, transition II-III, 13.0 and 13.9 kcal/mol for the outward and inward directions, respectively).
Figure 3.
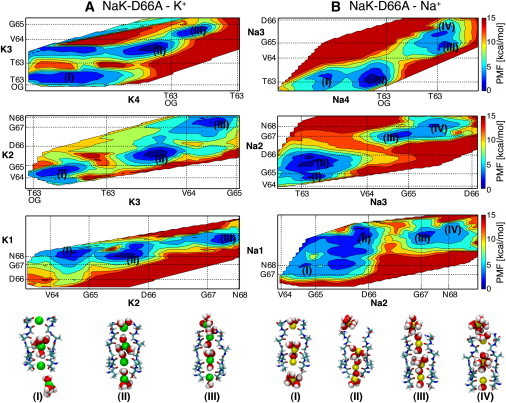
Energy maps for K+ (A) and Na+ (B) conduction in NaK-D66A. Notation as in Figure 2.
Permeation through selectivity filters with three binding sites
The constriction at S0 is completely absent in the NaK-CNG chimeras, and sites S4, S3, and S2 of NaK-CNG are analogous to the corresponding binding sites in K+ channels (11,26). Therefore, it is not surprising that in the free energy profiles of K+ channels and NaK-CNG similar energy minima are observed (Fig. 4 A). The PMF for Na+ ions in the selectivity filter of NaK-CNG is shown in Fig. 4 B, together with snapshots of the selectivity filter loaded with ions in different configurations. A striking feature of this PMF is the absence of any high-energetic barrier for Na+ ions when moving across the selectivity filter of NaK-CNG. Going from configuration I to configuration IV corresponds to the translocation of a Na+ ion from the intracellular cavity to the extracellular bath. The energies of configurations I and IV are closer than 1 kcal/mol to each other, and the highest energy barrier between the two configurations is ∼4 kcal/mol. The energy barriers for K+ permeation are higher than the energy barriers for Na+ permeation (∼6 kcal/mol). This difference of ∼2 kcal/mol between Na+ and K+ might be caused by the uncertainties of the PMF calculations, or by the limitations of the force field employed.
Figure 4.
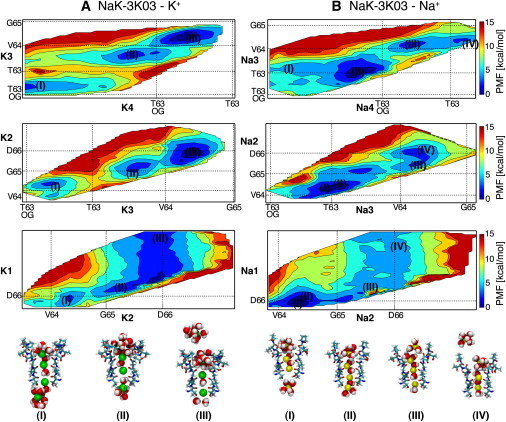
Energy maps for K+ (A) and Na+ (B) conduction in NaK-CNG. Notation as in Figure 2.
As expected, Na+ ions bind at different positions along the filter compared to K+ ions. Starting from the intracellular side, the first binding site for Na+ ions is at the level of the carbonyl oxygen atoms of residues Thr-63. A Na+ ion binds at this position in configuration I, II, and IV of Fig. 4 B. In contrast, in configuration III, the ion occupies a position more similar to that of the K+ binding site S4. The presence of an ion at the level of the carbonyl oxygen atoms of Val-64 and a water molecule in S3, explains why ion Na4 in configuration III cannot reach the plane defined by the carbonyl oxygen atoms of Thr-63. Proceeding toward the extracellular side, the carbonyl oxygen atoms of Val-64 define the next binding site, which extends toward the center of S2. In agreement with these observations, x-ray crystallography have revealed density peaks for Na+ ions both at the level of the carbonyl oxygen atoms of Val-64 and in S2 (26). At the extracellular side of the selectivity filter, Na+ ions bind preferentially at a position defined by the carbonyl oxygen atoms of Asp-66 where the pore is wider, and the ion is mainly coordinated by water molecules. K+ ions bind in an analogous position.
Using modeling and MD simulations, we have found that the selectivity filter of the WT NaK can adopt a structure analogous to the one observed in the NaK-CNG chimeras. Remarkably, the root mean-square displacement from the x-ray structure of the NaK-CNG chimera of the backbone atoms of residues 63–67 of NaK-3S is just ∼0.7 Å after 20 ns (Fig. S4). This value is comparable to those reported from MD studies of channels starting from x-ray structures (41,42). A comparison between the filter of NaK-3S and NaK-CNG highlighted some differences between the two structures. The conformations of the filters of NaK-3S and NaK-CNG are almost identical at amino acids 63–66, while differences emerge starting from amino acid 67 and become more severe from residue 68 (Fig. S5). The presence of a proline residue at position 68 in NaKCNG (instead of an asparagine, found in NaK-3S), could explain the sharper kink of the backbone (see Fig. S5, C and D). These structural differences at the extracellular entrance of the filter could result in differences in channel conductance.
The side chain of Asp-66, which interacts through a hydrogen bond with Asn-68 in the NaK-Xray, is involved in a hydrogen bond with Tyr-55 in NaK-3S (Fig. S6). Another major difference between the NaK-Xray and NaK-3S structures emerges at the level of residues Asn-68. In the filter of NaK-Xray, residues Asn-68 form a ring, with the side chain of Asn-68 of one-subunit hydrogen bonding to the backbone of Asn-68 of an adjacent subunit (Fig. S7, A and B). The ring was stable in several MD trajectories of 20 ns with different configurations of ions inside the filter. To reach the structure seen in the filter of NaK-3S, residues Asn-68 need to move in the radial direction and the ring needs to be eliminated (Fig. S7, C and D).
The energetic of conduction through the NaK-3S model system was similar to the ones observed in NaK-CNG (see the PMF for K+/Na+ conduction, Fig. S8).
Discussion
Umbrella sampling simulations have been carried out to characterize the free energy landscapes governing permeation events in the WT NaK channel and some of its mutants. This powerful computational strategy not only has been able to capture important differences between the different ion species, but it has also captured differences associated with the signature sequence of the channel pores. One of the main conclusions of this study is that the crystallographic structure of the WT NaK presents high energy barriers for the concerted translocations of both K+ and Na+ ions. This conclusion is in agreement with previous computational studies (27,28). However, to the best of our knowledge, this is the first time that free energy maps of complete conduction events in the WT NaK channel are presented.
The permeation pathway associated with the lowest energy barriers is characterized by energy minima with two K+ ions inside the water-filled cavity in the center of the selectivity filter, in agreement with MD simulations (27). However, these energy barriers along the minimum energy path are much higher than the energy barriers computed by similar methods for K+ channel, >10 kcal/mol versus 2–4 kcal/mol, respectively (43,44). Compared to KcsA, there is little experimental physiological data on NaK. However, the chord conductance of NaK is reported to be ∼30 pS, which is the same order of magnitude of the chord conductance of K+ channels under similar experimental conditions, e.g., KcsA ∼60 pS (45). Under these circumstances, the difference in the energy barriers obtained in the present calculations for NaK seems to be incompatible with the experimental data available. If the energy barrier were to be doubled, it would result in a more pronounced reduction in the channel conductance. Our estimates for the energy barriers are higher for Na+ than for K+ ions. In agreement with previous MD simulations (28), the channel seems to conduct K+ ions better than Na+ ions, although experimentally the same conductance was observed for both K+ and Na+ ions (6,26). In light of these observations, we conclude that the crystallographic structure of the WT NaK likely represents a nonconductive state of the pore.
A closer inspection of the energy maps for the WT NaK shows that the main impediment to conduction is associated with the constriction of the filter at the extracellular side of the water-filled cavity. The extracellular side of the filter is stabilized by a hydrogen bond between the side chain of residue Asp-66 and the backbone of residue Asn-68. To further analyze this observation, ion conduction through the Asp-66-Ala mutated channel was studied. In the Asp-66-Ala mutated channel this hydrogen bond does not exist, which results in that the mutation opens up the pore. The effect of the expansion of the pore is evident in the energy maps; the energy barriers for K+ and Na+ conduction through the narrowest point of the filter decreases in the mutated channel. However, the barriers for a complete conduction event remain high, especially for Na+ ions.
The presence of high-energy barriers even in the Asp-66-Ala mutated channel, exclude the hypothesis that the hydrogen bond between residues Asp-66 and Asn-68 alone is responsible for the nonconductive state. However, MD simulations and energy analyses of the Asp-66-Ala mutated channel show that the presence of a hydrogen bond between residues 66 and 68 stabilizes a nonconductive structure of the channel that becomes unstable when the bond is removed. The highest barrier for ion conduction found in the Asp-66-Ala mutated channel is still localized around residues Gly-67. Taking into account these observations, we decided to study the free energy of permeation through the recently published NaK-CNG chimeras (26), where the pore does not present an extracellular constriction. The energy barriers for K+ and Na+ conduction found in the NaK-CNG chimera are much lower than in the other systems described in this work. The energy barriers along the minimum energy path are ∼13/∼20 kcal/mol for K+ and Na+ ions, respectively, in the NaK-Xray system, and ∼12/∼14 kcal/mol, respectively, in the NaK-D66A system. The same barriers in NaK-CNG are ∼6/∼4 kcal/mol for K+ and Na+ ions. Thus, it is reasonable to conclude that NaK-Xray and NaK-D66A are nonconductive when compared to NaK-CNG. The structure of the selectivity filter observed in the NaK-CNG chimeras proved to be stable also in the WT NaK channel. Crucially, though not surprisingly, the WT channel with the pore fitted to that of the NaK-CNG chimera showed conduction properties similar to those of the NaK-CNG chimera.
In summary, from umbrella sampling simulations carried out to characterize the free energy landscapes governing permeation events in the WT NaK channel and some of its mutants, it has been found that i), the crystallographic structure of the WT NaK does not conduct Na+ or K+ ions; ii), the hydrogen bond between residues Asp-66 and Asn-68 in the WT stabilizes the structure of the selectivity filter, and when it is broken or does not exist, the filter evolves toward a structure with lower barriers for ion conduction; and iii), the structure of the selectivity filter in the NaK-CNG chimera corresponds to a conductive state.
Taking into account all these observations, we propose that the selectivity filter of the NaK channel and CNG channels is likely to exist in at least two different states: a nonconductive state, represented by the x-ray structure of the NaK channel, and a conductive state, represented by the structures of NaK-CNG chimeras. The balance between the two structures is likely governed by weak interactions, hydrogen bonds, and van der Waals forces, involving the atoms of the filter and those in their close proximity. The hydrogen bonds where Asp-66 is involved seem to play an important role in the pore architecture. The presence of a hydrogen bond between Asp-66 and Asn-68 stabilizes the nonconductive state. In contrast, a hydrogen bond between Asp-66 and Tyr-55 seems to stabilize the conductive state. According to the crystallographic structures, in the WT NaK the nonconductive state is favored, whereas the opposite is true for the NaK-CNG chimeras (26). This interpretation explains why the single channel currents through NaK are extremely flickering, with very short transitions to an open conductive state, although much longer open states are observed in the single channel currents of NaK-CNG chimeras. An apparent contradiction to the proposed mechanism is the fact that the crystal structure of the Asp-66-Ala mutant is analogous to the structure of the WT channel, despite the absence of the hydrogen bond between Ala-66 and Asn-68. However, the structure of the mutated channel was obtained in the presence of Ca2+ ions, which are blockers of the NaK channel (24). It is not surprising that a blocker stabilizes a nonconductive state of the selectivity filter. Analysis of the trajectories from the MD simulations of the NaK-D66A system indicates a set of alternative mutations to the ones in NaK-CNG that could unveil the conductive state of the filter. Residue Ser-70 assists the entrance of a water molecule behind the filter, and stabilizes this water molecule in a position where it hydrogen bonds to Asn-68 (Fig. S3). This hydrogen bond is analogous to the one between the side chain of Asp-66 and Asn-68 in the WT channel, which stabilizes the closed conformation of the filter. A residue with a hydrophobic side chain at position 70 could hamper the entrance of a water molecule behind the filter, destabilizing in turn the closed conformation. Another set of mutations that could destabilize the closed state of the filter is inferred when comparing the MD trajectories of NaK-Xray and NaK-3S. To reach the open conformation of the filter, the ring formed by residues Asn-68 needs to be broken (Fig. S7). Mutation of Asn-68 to a residue that cannot form this annular structure could further destabilize the closed conformation of the filter.
The presence of two possible states of the selectivity filter is supported also by mutations in the CNG channels. Mutating the residue equivalent to Tyr-55 of NaK to Ala renders the CNGA1 channel voltage gated (46). At a saturating concentration of cGMP, where the intracellular gate is maximally open, the channel conducts only at positive voltages. In the context of the proposed mechanism, the mutation Tyr-55-Ala should destabilize the conductive state in favor of the nonconductive state. The conductive pore reappears as the dominant state, when the transmembrane electric field pushes the electrically charged Asp-66 residues toward the intracellular side, thus destabilizing the nonconductive state and stabilizing the conductive state.
At present, gating at the selectivity filter of K+ channels is a relatively well-established mechanism (47–49). The results presented here suggest that a similar mechanism could exist in ion channels permeable by both K+ and Na+ ions. Although this interpretation of the crystallographic structures of the NaK channel is supported by computational data, and it is in agreement with a few available experimental observations, further experimental data would be certainly advantageous. Crystallization of the WT NaK under conditions that favor the putative conductive state is a possible strategy. Knowledge of the structure-function relationship of the selectivity filter is crucial, not only for a better understanding of the conduction mechanisms in ion channels, but also to provide an atomistic description of channel blockage. Blockage by Ca2+ ions is a relevant property in the physiological functioning of CNG channels, and the presence of a gating mechanism at the selectivity filter is certainly important for a correct interpretation of this process.
Acknowledgments
C.D. thanks The Royal Society for a University Research Fellowship.
This work was supported by grants from the Engineering and Physical Sciences Research Council. The Oxford Supercomputing Center and HECTOR are acknowledged for providing computational resources.
Supporting Material
References
- 1.Doyle D.A., Morais Cabral J., MacKinnon R. The structure of the potassium channel: molecular basis of K+ conduction and selectivity. Science. 1998;280:69–77. doi: 10.1126/science.280.5360.69. [DOI] [PubMed] [Google Scholar]
- 2.Jiang Y., Lee A., MacKinnon R. Crystal structure and mechanism of a calcium-gated potassium channel. Nature. 2002;417:515–522. doi: 10.1038/417515a. [DOI] [PubMed] [Google Scholar]
- 3.Kuo A., Gulbis J.M., Doyle D.A. Crystal structure of the potassium channel KirBac1.1 in the closed state. Science. 2003;300:1922–1926. doi: 10.1126/science.1085028. [DOI] [PubMed] [Google Scholar]
- 4.Jiang Y., Lee A., MacKinnon R. X-ray structure of a voltage-dependent K+ channel. Nature. 2003;423:33–41. doi: 10.1038/nature01580. [DOI] [PubMed] [Google Scholar]
- 5.Kuo A., Domene C., Vénien-Bryan C. Two different conformational states of the KirBac3.1 potassium channel revealed by electron crystallography. Structure. 2005;13:1463–1472. doi: 10.1016/j.str.2005.07.011. [DOI] [PubMed] [Google Scholar]
- 6.Shi N., Ye S., Jiang Y. Atomic structure of a Na+- and K+-conducting channel. Nature. 2006;440:570–574. doi: 10.1038/nature04508. [DOI] [PubMed] [Google Scholar]
- 7.Latorre R., Miller C. Conduction and selectivity in potassium channels. J. Membr. Biol. 1983;71:11–30. doi: 10.1007/BF01870671. [DOI] [PubMed] [Google Scholar]
- 8.Nimigean C.M., Miller C. Na+ block and permeation in single KcsA K+ channels. Biophys. J. 2002;82:350a. [Google Scholar]
- 9.Valiyaveetil F.I., Leonetti M., Mackinnon R. Ion selectivity in a semisynthetic K+ channel locked in the conductive conformation. Science. 2006;314:1004–1007. doi: 10.1126/science.1133415. [DOI] [PubMed] [Google Scholar]
- 10.Thompson A.N., Kim I., Nimigean C.M. Mechanism of potassium-channel selectivity revealed by Na(+) and Li(+) binding sites within the KcsA pore. Nat. Struct. Mol. Biol. 2009;16:1317–1324. doi: 10.1038/nsmb.1703. [DOI] [PMC free article] [PubMed] [Google Scholar]
- 11.Derebe M.G., Zeng W.Z., Jiang Y. Structural studies of ion permeation and Ca2+ blockage of a bacterial channel mimicking the cyclic nucleotide-gated channel pore. Proc. Natl. Acad. Sci. USA. 2011;108:592–597. doi: 10.1073/pnas.1013643108. [DOI] [PMC free article] [PubMed] [Google Scholar]
- 12.Aqvist J., Luzhkov V. Ion permeation mechanism of the potassium channel. Nature. 2000;404:881–884. doi: 10.1038/35009114. [DOI] [PubMed] [Google Scholar]
- 13.Noskov S.Y., Bernèche S., Roux B. Control of ion selectivity in potassium channels by electrostatic and dynamic properties of carbonyl ligands. Nature. 2004;431:830–834. doi: 10.1038/nature02943. [DOI] [PubMed] [Google Scholar]
- 14.Corry B., Chung S.H. Mechanisms of valence selectivity in biological ion channels. Cell. Mol. Life Sci. 2006;63:301–315. doi: 10.1007/s00018-005-5405-8. [DOI] [PMC free article] [PubMed] [Google Scholar]
- 15.Varma S., Sabo D., Rempe S.B. K+/Na+ selectivity in K channels and valinomycin: over-coordination versus cavity-size constraints. J. Mol. Biol. 2008;376:13–22. doi: 10.1016/j.jmb.2007.11.059. [DOI] [PMC free article] [PubMed] [Google Scholar]
- 16.Illingworth C.J.R., Furini S., Domene C. Computational studies on polarization effects and selectivity in K+ channels. J. Chem. Theory Comput. 2010;6:3780–3792. [Google Scholar]
- 17.Alam A., Jiang Y. Structural analysis of ion selectivity in the NaK channel. Nat. Struct. Mol. Biol. 2009;16:35–41. doi: 10.1038/nsmb.1537. [DOI] [PMC free article] [PubMed] [Google Scholar]
- 18.Zhou Y., Morais-Cabral J.H., MacKinnon R. Chemistry of ion coordination and hydration revealed by a K+ channel-Fab complex at 2.0 A resolution. Nature. 2001;414:43–48. doi: 10.1038/35102009. [DOI] [PubMed] [Google Scholar]
- 19.Domene C., Furini S. Dynamics, energetics, and selectivity of the low-K+ KcsA channel structure. J. Mol. Biol. 2009;389:637–645. doi: 10.1016/j.jmb.2009.04.038. [DOI] [PubMed] [Google Scholar]
- 20.Boiteux C., Bernèche S. Absence of ion-binding affinity in the putatively inactivated low-[K+] structure of the KcsA potassium channel. Structure. 2011;19:70–79. doi: 10.1016/j.str.2010.10.008. [DOI] [PubMed] [Google Scholar]
- 21.Ye S., Li Y., Jiang Y. Novel insights into K+ selectivity from high-resolution structures of an open K+ channel pore. Nat. Struct. Mol. Biol. 2010;17:1019–1023. doi: 10.1038/nsmb.1865. [DOI] [PMC free article] [PubMed] [Google Scholar]
- 22.Cordero-Morales J.F., Cuello L.G., Perozo E. Molecular determinants of gating at the potassium-channel selectivity filter. Nat. Struct. Mol. Biol. 2006;13:311–318. doi: 10.1038/nsmb1069. [DOI] [PubMed] [Google Scholar]
- 23.Cordero-Morales J.F., Cuello L.G., Perozo E. Voltage-dependent gating at the KcsA selectivity filter. Nat. Struct. Mol. Biol. 2006;13:319–322. doi: 10.1038/nsmb1070. [DOI] [PubMed] [Google Scholar]
- 24.Alam A., Shi N., Jiang Y.X. Structural insight into Ca2+ specificity in tetrameric cation channels. Proc. Natl. Acad. Sci. USA. 2007;104:15334–15339. doi: 10.1073/pnas.0707324104. [DOI] [PMC free article] [PubMed] [Google Scholar]
- 25.Cordero-Morales J.F., Jogini V., Perozo E. Molecular driving forces determining potassium channel slow inactivation. Nat. Struct. Mol. Biol. 2007;14:1062–1069. doi: 10.1038/nsmb1309. [DOI] [PubMed] [Google Scholar]
- 26.Derebe M.G., Sauer D.B., Jiang Y. Tuning the ion selectivity of tetrameric cation channels by changing the number of ion binding sites. Proc. Natl. Acad. Sci. USA. 2011;108:598–602. doi: 10.1073/pnas.1013636108. [DOI] [PMC free article] [PubMed] [Google Scholar]
- 27.Vora T., Corry B., Chung S.H. Brownian dynamics investigation into the conductance state of the MscS channel crystal structure. Biochim. Biophys. Acta. 2006;1758:730–737. doi: 10.1016/j.bbamem.2006.04.014. [DOI] [PubMed] [Google Scholar]
- 28.Shen R., Guo W.L., Zhong W.Y. Hydration valve controlled non-selective conduction of Na(+) and K(+) in the NaK channel. Biochim. Biophys. Acta. 2010;1798:1474–1479. doi: 10.1016/j.bbamem.2010.04.002. [DOI] [PubMed] [Google Scholar]
- 29.Noskov S.Y., Roux B. Importance of hydration and dynamics on the selectivity of the KcsA and NaK channels. J. Gen. Physiol. 2007;129:135–143. doi: 10.1085/jgp.200609633. [DOI] [PMC free article] [PubMed] [Google Scholar]
- 30.Phillips J.C., Braun R., Schulten K. Scalable molecular dynamics with NAMD. J. Comput. Chem. 2005;26:1781–1802. doi: 10.1002/jcc.20289. [DOI] [PMC free article] [PubMed] [Google Scholar]
- 31.MacKerell A.D., Bashford D., Karplus M. All-atom empirical potential for molecular modeling and dynamics studies of proteins. J. Phys. Chem. B. 1998;102:3586–3616. doi: 10.1021/jp973084f. [DOI] [PubMed] [Google Scholar]
- 32.Jorgensen W.L., Chandrasekhar J., Klein M.L. Comparison of simple potential functions for simulating liquid water. J. Chem. Phys. 1983;79:926–935. [Google Scholar]
- 33.Roux B., Bernèche S. On the potential functions used in molecular dynamics simulations of ion channels. Biophys. J. 2002;82:1681–1684. doi: 10.1016/S0006-3495(02)75520-3. [DOI] [PMC free article] [PubMed] [Google Scholar]
- 34.Feller S.E., Zhang Y.H., Brooks B.R. Constant-pressure molecular dynamics simulation–the langevin piston method. J. Chem. Phys. 1995;103:4613–4621. [Google Scholar]
- 35.Essmann U., Perera L., Pedersen L.G. A smooth particle mesh Ewald method. J. Chem. Phys. 1995;103:8577–8593. [Google Scholar]
- 36.Miyamoto S., Kollman P.A. Settle - an analytical version of the Shake and Rattle algorithm for wigid water molecules. J. Comput. Chem. 1992;13:952–962. [Google Scholar]
- 37.Domene C., Furini S. Examining ion channel properties using free-energy methods. Methods Enzymol. 2009;466:155–177. doi: 10.1016/S0076-6879(09)66007-9. [DOI] [PubMed] [Google Scholar]
- 38.Torrie G.M., Valleau J.P. Monte-Carlo free-energy estimates using non-Booltzman sampling – application to subcritical Lennard-Jones fluid. Chem. Phys. Lett. 1974;28:578–581. [Google Scholar]
- 39.Kumar S., Bouzida D., Rosenberg J.M. The weighted histogram analysis method for free-energy calculations on biomolecules. 1. The method. J. Comput. Chem. 1992;13:1011–1021. [Google Scholar]
- 40.Weinan E., Ren W., Vanden-Eijnden E. String method for the study of rare events. Phys. Rev. B. 2002;66:052301. doi: 10.1021/jp0455430. [DOI] [PubMed] [Google Scholar]
- 41.Bernèche S., Roux B. Molecular dynamics of the KcsA K(+) channel in a bilayer membrane. Biophys. J. 2000;78:2900–2917. doi: 10.1016/S0006-3495(00)76831-7. [DOI] [PMC free article] [PubMed] [Google Scholar]
- 42.Domene C., Sansom M.S.P. Potassium channel, ions, and water: simulation studies based on the high resolution x-ray structure of KcsA. Biophys. J. 2003;85:2787–2800. doi: 10.1016/S0006-3495(03)74702-X. [DOI] [PMC free article] [PubMed] [Google Scholar]
- 43.Bernèche S., Roux B. Energetics of ion conduction through the K+ channel. Nature. 2001;414:73–77. doi: 10.1038/35102067. [DOI] [PubMed] [Google Scholar]
- 44.Furini S., Domene C. Atypical mechanism of conduction in potassium channels. Proc. Natl. Acad. Sci. USA. 2009;106:16074–16077. doi: 10.1073/pnas.0903226106. [DOI] [PMC free article] [PubMed] [Google Scholar]
- 45.LeMasurier M., Heginbotham L., Miller C. KcsA: it's a potassium channel. J. Gen. Physiol. 2001;118:303–314. doi: 10.1085/jgp.118.3.303. [DOI] [PMC free article] [PubMed] [Google Scholar]
- 46.Martínez-François J.R., Xu Y., Lu Z. Mutations reveal voltage gating of CNGA1 channels in saturating cGMP. J. Gen. Physiol. 2009;134:151–164. doi: 10.1085/jgp.200910240. [DOI] [PMC free article] [PubMed] [Google Scholar]
- 47.Domene C., Klein M.L., Parrinello M. Conformational changes and gating at the selectivity filter of potassium channels. J. Am. Chem. Soc. 2008;130:9474–9480. doi: 10.1021/ja801792g. [DOI] [PubMed] [Google Scholar]
- 48.Cuello L.G., Jogini V., Perozo E. Structural mechanism of C-type inactivation in K(+) channels. Nature. 2010;466:203–208. doi: 10.1038/nature09153. [DOI] [PMC free article] [PubMed] [Google Scholar]
- 49.Cuello L.G., Jogini V., Perozo E. Structural basis for the coupling between activation and inactivation gates in K(+) channels. Nature. 2010;466:272–275. doi: 10.1038/nature09136. [DOI] [PMC free article] [PubMed] [Google Scholar]
Associated Data
This section collects any data citations, data availability statements, or supplementary materials included in this article.