Abstract
Quantitative ultrasound features such as the attenuation slope, sound speed and scatterer size, have been utilized to evaluate pathological variations in soft tissues such as the liver and breast. However, the impact of variations in the sound speed and backscatter due to underlying fat content or fibrotic changes, on the attenuation slope has not been addressed. Both numerical and acoustically uniform tissue-mimicking experimental phantoms are used to demonstrate the impact of sound speed variations on attenuation slope using clinical real-time ultrasound scanners equipped with linear array transducers. Radiofrequency data at center frequencies of 4 and 5 MHz are acquired for the experimental and numerical phantoms respectively. Numerical phantom sound speeds between 1480 to 1600 m/s in increments of 20 m/s for attenuation coefficients of 0.3, 0.4, 0.5, 0.6, and 0.7 dB/cm/MHz are simulated. Variations in the attenuation slope when the backscatter intensity of the sample is equal, 3dB higher, and 3 dB lower than the reference is also evaluated. The sound speed for the experimental tissue-mimicking phantoms were 1500, 1540, 1560 and 1580 m/s respectively, with an attenuation coefficient of 0.5 dB/cm/MHz. Radiofrequency data is processed using three different attenuation estimation algorithms, i.e. the reference phantom, centroid downshift, and a hybrid method. In both numerical and experimental phantoms our results indicate a bias in attenuation slope estimates when the reference phantom sound speed is higher (overestimation) or lower (underestimation than that of the sample. This bias is introduced via a small spectral shift in the normalized power spectra of the reference and sample with different sound speeds. The hybrid method provides the best estimation performance, especially for sample attenuation coefficient values lower than that of the reference phantom. The performance of all the methods deteriorates when the attenuation coefficient of the reference phantom is lower than that of the sample. In addition, the hybrid method is the least sensitive to sample backscatter intensity variations.
Keywords: Attenuation Coefficient, Attenuation Slope, Backscatter coefficient, Sound speed, Ultrasound, Quantitative ultrasound
INTRODUCTION
Radiofrequency (RF) data has been used for the determination of quantitative ultrasonic (QUS) features such as speed of sound (SOS), backscatter coefficient (BSC), attenuation coefficient and the non-linearity parameter (1–8). QUS features such as the attenuation slope may provide valuable insights into tissue pathology (8–9), and attenuation imaging is envisioned as an optional modality to augment standard B-mode imaging (10). These tissue features are used to quantify the underlying tissue pathology using ultrasound pulse-echo imaging, for eventual use in clinical diagnosis (11–12). For example, Strowitzki et al. (13) analyzed attenuation and backscatter values of brain tissue for potential intraoperative discrimination between normal and pathologic areas which could be of interest to the surgeon. Taylor et al. (14) estimated ultrasound attenuation in liver based on amplitude and frequency changes as a function of depth. They compared their QUS results with histological data indicating that the presence of fat alone accounted for the increased attenuation associated with cirrhosis, and similar high attenuation values were found in patients with fatty infiltration. Landini et al. (15) showed the feasibility of using an index derived from the slope of the frequency-dependent ultrasonic attenuation to provide quantitative information on normal and pathological breast tissue. Pre-term birth is also investigated by evaluating variations in attenuation during the ripening of the cervix (16). Bigelow et al. (17) have performed computer simulations as well as in-vivo studies on rats by detecting the attenuation decrease of the ripened cervix versus an unripened cervix.
Sound speed changes in biological tissue have also been measured ex-vivo (18–19) and in-vivo (20–21). Keshavarzi et al. (22) measured the attenuation and SOS variations in fresh human uterine fibroids and myometrium as a function of frequency. Frequency dependent backscatter variations have also been measured, for example, Garra et al. (23) measured spectral centroid shift from ultrasonic backscatter signals from the spine in-vivo, where measurements were made through the abdomen. Imaging scatterer size in thyroid nodules has also been investigated using the frequency dependence of backscatter (12). In soft tissue, such as liver, it has been shown that the mean backscatter coefficient of patients with fatty liver infiltrations is higher than that of normal patients (9). Attenuation and backscatter indices may also be effective in determining normal versus abnormal liver and “pure” fatty versus healthy liver (24). Gaitini et al. (24) demonstrate that backscatter indices are better than ultrasound texture based indices using receiver operating characteristic (ROC) analysis, with an area under the curve (AUC) of 0.86 to discriminate abnormal versus normal livers, 1.0 to discriminate “pure” fatty versus healthy livers, and 0.92 to discriminate “pure” fatty versus mixed livers.
Both time and frequency domain approaches for estimating the attenuation coefficient have been developed (25–26). Frequency domain approaches primarily rely on the estimation of the shift of the power spectrum towards lower frequencies due to the increased attenuation of the higher frequency content, and/or subsequent reduction in the signal/spectral amplitude with propagation depth. The centroid downshift method or spectral shift method evaluates the variation in the spectral centroid with depth from the backscattered RF data (27). Attenuation is estimated from the decay with depth of the spectral centroid due to the increased attenuation of higher frequency signals of the backscattered RF data when compared to the lower frequencies. The reference phantom method (RPM) or the spectral difference method, on the other hand utilizes backscattered RF signals to calculate the amplitude decay of the power spectra with depth (25). This method uses a well-characterized tissue mimicking (TM) phantom as a reference with known attenuation, sound speed and backscatter characteristics, to reduce system and transducer dependencies. An attenuation slope estimation method termed the hybrid spectral domain method which incorporates advantages of both the spectral shift and the spectral difference method, while overcoming their limitations, has also been developed (28). Spectral shift methods are sensitive to local spectral noise artifacts and have difficulty in compensating for diffraction effects due to beam focusing. Spectral difference methods on the other hand, fail to accurately estimate attenuation coefficient values at tissue boundaries that also include variations in the backscatter. The hybrid method uses a spectral difference method to reduce the impact of system dependent parameters such as diffraction by normalizing the power spectra obtained at different depths using a reference power spectrum. The normalized spectra is then filtered using a Gaussian filter centered on the transmit center frequency of the ultrasound system. A spectral shift method using spectral cross-correlation (29) is then performed on the filtered bandpass signal to estimate the attenuation coefficient.
In this paper we investigate the impact of SOS and backscatter intensity variations on attenuation estimation by comparing attenuation slope estimated using the three different frequency domain attenuation slope estimation methods; namely the reference phantom, centroid downshift, and the hybrid method, using numerical and experimental TM phantoms. Typical attenuation slope values of soft tissue, fat, liver and breast tissue are around 0.54, 0.48, 0.5 and 0.75 dB/cm/MHz, respectively (30). Attenuation slope estimates for sample phantoms whose backscatter intensity variations are different from that of the reference phantom are also presented. The next section presents details on the numerical ultrasound simulation, and acquisition of experimental data on TM phantoms. A description of the three attenuation methods along with data processing is also presented. The Results section presents the numerical and experimental results, which are then summarized in the Discussion section. Finally, the conclusions of this paper are presented.
MATERIALS AND METHODS
Ultrasound Simulation
Numerical phantoms were generated using a frequency domain simulation program based on the linear diffraction theory of continuous waves (31–32). A linear-array transducer was modeled consisting of rectangular elements of dimensions 0.18 mm by 10 mm, with a center to center element separation of 0.2 mm. Each beam line was formed using 128 consecutive elements which form the transducer aperture, and 170 A-lines over a 34 mm lateral width were generated. A fixed elevational focus is applied using an acoustic lens on the top surface of the transducer. The elevational focus is set to be equal to the lateral focus in order to avoid the effect of different elevational and lateral foci in the analysis. Dynamic receive focusing and dynamic aperture was used on receive such that the F number is fixed at 2. The field strength in the focal plane was set to be the field strength at all the depth planes in order to avoid a varying signal density due to the focusing effect. The incident pulse was simulated as a Gaussian-shaped pulse with center frequency of 5 MHz and 80% bandwidth.
All numerical phantoms generated in this paper were 34 mm wide with a depth of 80 mm and a thickness of 10 mm. The uniformly attenuating phantoms were simulated numerically by assuming a random distribution of 25 μm glass beads in a medium having a sound speed of 1540 m/s, which is the average sound speed for soft tissue. Most tissues of interest for medical ultrasound imaging have sound speeds within 2–3% of this value (33). The glass beads generate backscattered echo signals with the propagation of the ultrasound pulse. A scatterer number density of approximately 10 per cubic millimeter was used to ensure Rayleigh scattering statistics (34). Rayleigh scattering statistics are commonly associated with ultrasonic backscattered signals (35). Adjacent beam lines were separated by a 0.2 mm distance, equal to the element pitch. The sample and the reference phantoms were assumed to be in direct contact with the transducer. A single transmit focus set to 40 mm was utilized with the elevational focus also set to 40 mm. The sampling rate was set to 40 MHz and no time gain compensation (TGC) was assumed.
In order to investigate SOS variations, the first set of numerical phantoms had identical acoustic properties with only variations in the material SOS simulated, ranging from 1480–1600 m/s at 20 m/s intervals (7 phantoms). Two additional sets of numerical phantoms with similar sound speed values and incorporating backscatter intensities 3dB higher and 3dB lower were also constructed to investigate the effect of backscatter intensity variations. The scatterer density parameter was varied to introduce the variations in the backscatter intensity. Scatterer density was doubled to obtain the 3dB increase and halved for the 3dB lower backscatter intensity phantoms. In addition, phantoms with attenuation coefficient values ranging from 0.3–0.7 dB/cm/ MHz at 0.1 dB/cm/ MHz increments were also simulated at a sound speed of 1540 m/s, Table 1 lists the acoustic properties of the reference and sample phantoms generated.
Table 1.
Acoustic properties of different numerical reference and sample phantoms simulated
| Case | Acoustic Property | Sample Phantom | Reference Phantom |
|---|---|---|---|
| (1) | Speed of Sound (m/s) | 1480 1500 1520 1540 1560 1580 1600 | 1540 |
| Attenuation Coefficient (dB/cm/MHz) | 0.5 | 0.5 | |
| Scatterer Number Density (number /mm3) | 10 | 10 | |
| (2) | Speed of Sound (m/s) | 1540 | 1480 1500 1520 1540 1560 1580 1600 |
| Attenuation Coefficient (dB/cm/MHz) | 0.3 0.4 0.5 0.6 0.7 | 0.5 | |
| Scatterer Number Density (number /mm3) | 10 | 10 | |
| (3) | Speed of Sound (m/s) | 1480 1500 1520 1540 1560 1580 1600 | 1540 |
| Attenuation Coefficient (dB/cm/MHz) | 0.3 0.5 0.7 | 0.3 0.5 0.7 | |
| Scatterer Number Density (number /mm3) | 5 10 20 | 10 |
The SOS parameter is encountered in two different sections of the ultrasound simulation program: in the construction of the numerical phantoms, and during transmit and receive beamforming. The ultrasound system SOS was fixed at a value of 1540 m/s, and was used to generate the transmit focal zone, and for receive beamforming. The SOS variation described in this paper refers only to the tissue material SOS variation. The numerical simulation would therefore mimic this case, where an ultrasound system would be utilized to scan phantoms with varying sound speed or backscatter changes. Echo signal envelopes were obtained from the numerical RF data by computing the analytic signal using the Hilbert transform.
Experimental RF data acquisition
Four uniform TM experimental phantoms with constant SOSs of 1500, 1540, 1560, and 1580 m/s, at 22 degrees Celsius were manufactured in our laboratory. All of the phantoms have a uniform attenuation coefficient of 0.5 dB/cm/MHz. Both the SOS and the attenuation coefficient of the phantoms were measured using the narrowband substitution method in our laboratory (36–37). The TM phantoms consist of 45–53 μm randomly distributed glass beads in a gelatin background with a concentration of 200 beads/cm3. Each phantom is encased within a rectangular plexiglass container of dimensions 15 cm depth, 15 cm width, and a 5 cm thickness in the elevational direction. The phantoms were scanned using a Siemens S2000 clinical ultrasound system (Siemens Medical Systems, Issaquah, WA, USA) using a 9L4 linear array transduer operated at 4 MHz center frequency with transmit power of 39%, dynamic range of 90 dB, 40 MHz sampling rate, and constant TGC with all the potentiometer knobs at the center. The internal TGC of the system, was not disabled. The power level was kept low to avoid saturating the echo-signals which could lead to clipping of the time-domain signals during digitization, this can adversely impact computation of the power spectrum. Each RF data loop collected consists of 10–15 frames acquired at different locations from the uniform phantom to obtain independent uncorrelated frames. A region of interest (ROI) is selected around the focus and data within a 2 cm width and 1 cm depth block was used to estimate the attenuation coefficient.
Attenuation Estimation Methods
Frequency domain attenuation estimation methods were used in this paper. The first method used was a spectral difference method also known as the reference phantom method. Here the amplitude or intensity decay of the power spectra from the backscattered RF signals is utilized. The difference or ratio of the power spectra at two different depths are related to tissue attenuation, under the assumption that tissue can be modeled as a linear system. Consider a tissue sample with backscatter coefficient of BSC(ω1) and attenuation coefficient of α(ω1) whose properties are to be measured, the RPM utilizes a reference phantom with a known backscatter coefficient BSC'(ω1) and attenuation coefficient α'(ω1). The power spectral ratio at time t is calculated as (25):
| (1) |
where the echo-signal at time t is mapped to the signal at depth z = c.t/2, where c is the speed of sound, Δα(ω1) is the difference in attenuation coefficients of the tissue sample and reference phantom, and RB(ω1) is the ratio of the BSC.
The second method for estimating the attenuation slope is a spectral shift method which estimates the centroid downshift with depth(27). Since ultrasound attenuation increases monotonically with frequency, soft tissue has the transfer charactereistics of a lowpass filter. The power spectra downshifts towards lower frequencies with depth. Assuming that the power spectrum Pz(f) of the backscattered ultrasound signal at depth z has a Gaussian shape given by:
| (2) |
where Cz is a constant related to the initial transmit power, f is the frequency, fz is the center frequency, and B is the bandwidth. The pulse-echo transfer function H(f) can be written as:
| (3) |
where α is the attenuation slope and D is the sample thickness The spectral shift at two different depths z1 and z2 (z1<z2), assuming that the backscattered signals maintain the same Gaussian shape. Substituting Eqn. (2) into (3) yields:
| (4) |
Equation (4) shows that if the power spectrum at depth z2 maintains the same Gaussian form as that at depth z1, then there is a shift to a lower center frequency and the attenuation slope value can be determined from the centroid downshift. Hence,
| (5) |
The hybrid method initially uses the spectral difference approach to reduce the impact of system dependent parameters such as diffraction effects, then a Gaussian filter centered at the transmit center frequency (fc) of the system is used to filter the normalized power spectrum that also includes BSC variations (28). The hybrid method then utilizes the spectral cross-correlation algorithm which is a spectral shift method to calculate the spectral shifts from the filtered power spectra in order to estimate the attenuation coefficient (29). The center frequency of the Gaussian filtered intensity ratio at the depth z can be expressed as follows:
| (6) |
Where σ2 is the variance of the transmit pulse, αs and αr are the attenuation coefficients of the sample and reference respectively. By differentiating Eqn. (6) with respect to the depth z and under the assumption of a linear frequency dependent attenuation in soft tissue, linear regression over the local spectral shift estimates is used to compute the final attenuation coefficient. The attenuation coefficient slope is then given by
| (7) |
RF data processing
The reference phantom, centroid downshift, and hybrid methods for attenuation estimation were implemented in MATLAB (MathWorks Inc., Natick, MA, USA). Attenuation coefficients of the sample phantoms were calculated based on the specified reference phantom. The RF data was divided into smaller 50% overlapping segments in order to obtain a stable power spectrum using the Welch method (38). The window size was chosen according to the full width half maximum value (FWHM) of the estimated power spectrum without spectral broadening effects (29). Window sizes from 1 mm to 8 mm were evaluated; with the 3 mm window size used for the attenuation estimation process (smallest window size without spectral broadening). The ideal size of the gated window was chosen such that it was small enough to satisfy the stationarity assumption and to provide sufficient spatial resolution for the attenuation estimate, but also large enough to generate an accurate and robust power spectrum of the backscattered RF signal.
For the experimental analysis, the reference phantom SOS was fixed at 1540 m/s and the sample phantoms possess sound speed values of 1500, 1540, 1560 and 1580 m/s, respectively. RF data collected was processed with the same algorithms as the numerical phantoms. The window size was chosen to be 3 mm which generated a robust power spectrum of the backscattered RF signal as described above, and the percent overlap was set to 50%.
All of the results presented in the following section are obtained over 10 independent realizations of either the numerical simulations or independent experimental data acquisitions.
RESULTS
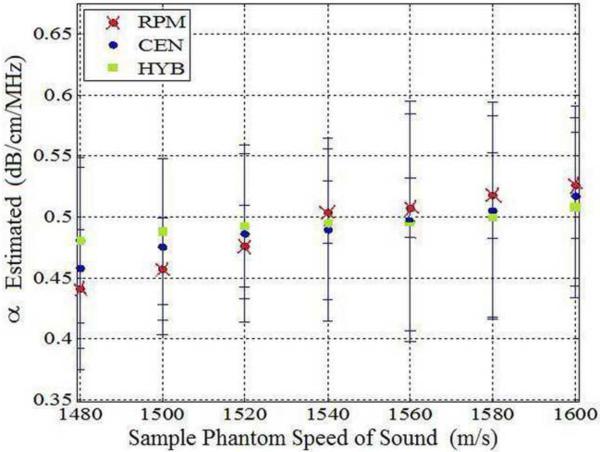
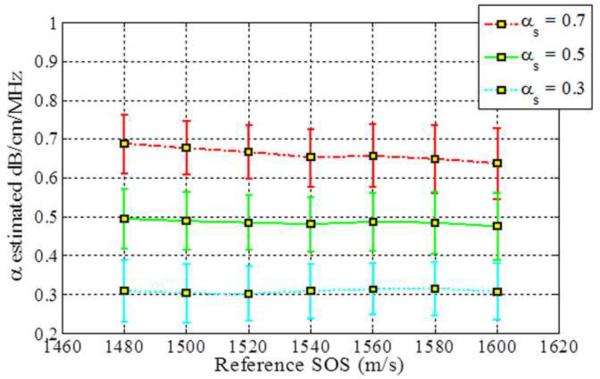
The impact of SOS variations are observed by estimating the attenuation slope values when the reference phantom has a sound speed of 1540 m/s and sample phantoms have sound speeds ranging from 1480 m/s to 1600 m/s, as illustrated in Fig. 1. All of the phantoms have the same value of the attenuation and backscatter coefficient. The attenuation coefficient of the sample phantoms and the reference phantom was 0.5 dB/cm/MHz in order to rule out the influence of different attenuation coefficients between the sample and the reference. Figure 1 shows that all three methods underestimate the attenuation coefficient when the sound speed of the sample is lower than that of the reference phantom. Table 3 presents the mean attenuation slope values (α) at each value of the sound of speed.
Figure 1.
Attenuation slope estimation results for the three methods for sample phantoms with different sound speeds (Case 1 from Table 1). Observe the bias in the attenuation slope estimated as the sound speed difference between the reference and the sample increase. (RPM: Re ference Phantom Method, CEN: Centroid Downshift Method, HYB: Hybrid Method)
Table 3.
| Figure | Estimation Method & α | α at 1480 m/s | α at 1500 m/s | α at 1520 m/s | α at 1540 m/s | α at 1560 m/s | α at 1580 m/s | α at 1600 m/s |
|---|---|---|---|---|---|---|---|---|
| Figure 1 | RPM (0.5) | 0.44 | 0.46 | 0.48 | 0.5 | 0.51 | 0.53 | 0.55 |
|
| ||||||||
| CEN (0.5) | 0.46 | 0.475 | 0.49 | 0.49 | 0.5 | 0.51 | 0.53 | |
|
| ||||||||
| HYB (0.5) | 0.48 | 0.49 | 0.493 | 0.495 | 0.5 | 0.5 | 0.51 | |
|
| ||||||||
| Figure 2 | RPM (0.3) | 0.39 | 0.38 | 0.35 | 0.31 | 0.3 | 0.29 | 0.28 |
| (0.5) | 0.58 | 0.55 | 0.51 | 0.5 | 0.495 | 0.48 | 0.47 | |
| (0.7) | 0.78 | 0.78 | 0.71 | 0.7 | 0.695 | 0.68 | 0.66 | |
|
| ||||||||
| CEN (0.3) | 0.29 | 0.28 | 0.27 | 0.275 | 0.28 | 0.28 | 0.27 | |
| (0.5) | 0.54 | 0.51 | 0.5 | 0.49 | 0.49 | 0.48 | 0.47 | |
| (0.7) | 0.74 | 0.71 | 0.7 | 0.68 | 0.679 | 0.65 | 0.63 | |
|
| ||||||||
| HYB (0.3) | 0.295 | 0.29 | 0.29 | 0.295 | 0.295 | 0.295 | 0.31 | |
| (0.5) | 0.5 | 0.5 | 0.495 | 0.495 | 0.5 | 0.495 | 0.49 | |
| (0.7) | 0.7 | 0.69 | 0.68 | 0.67 | 0.67 | 0.66 | 0.67 | |
|
| ||||||||
| Figure 3 | RPM (0.3) | 0.37 | 0.35 | 0.32 | 0.3 | 0.29 | 0.28 | 0.27 |
| (0.5) | 0.57 | 0.55 | 0.52 | 0.5 | 0.49 | 0.48 | 0.47 | |
| (0.7) | 0.77 | 0.75 | 0.72 | 0.7 | 0.69 | 0.68 | 0.67 | |
|
| ||||||||
| CEN (0.3) | 0.3 | 0.29 | 0.28 | 0.29 | 0.29 | 0.29 | 0.28 | |
| (0.5) | 0.52 | 0.5 | 0.49 | 0.48 | 0.48 | 0.47 | 0.45 | |
| (0.7) | 0.72 | 0.7 | 0.68 | 0.65 | 0.65 | 0.63 | 0.62 | |
|
| ||||||||
| HYB (0.3) | 0.31 | 0.31 | 0.3 | 0.31 | 0.32 | 0.32 | 0.31 | |
| (0.5) | 0.5 | 0.495 | 0.495 | 0.495 | 0.49 | 0.49 | 0.48 | |
| (0.7) | 0.69 | 0.68 | 0.67 | 0.65 | 0.64 | 0.63 | 0.62 | |
|
| ||||||||
| Figure 4 | RPM (0.3) | 0.38 | 0.35 | 0.33 | 0.3 | 0.3 | 0.28 | 0.27 |
| (0.5) | 0.58 | 0.55 | 0.53 | 0.5 | 0.5 | 0.48 | 0.47 | |
| (0.7) | 0.78 | 0.75 | 0.73 | 0.7 | 0.7 | 0.68 | 0.67 | |
|
| ||||||||
| CEN (0.3) | 0.27 | 0.26 | 0.25 | 0.26 | 0.26 | 0.27 | 0.25 | |
| (0.5) | 0.48 | 0.47 | 0.46 | 0.45 | 0.45 | 0.44 | 0.42 | |
| (0.7) | 0.69 | 0.66 | 0.65 | 0.62 | 0.62 | 0.6 | 0.595 | |
|
| ||||||||
| HYB (0.3) | 0.295 | 0.29 | 0.29 | 0.295 | 0.295 | 0.295 | 0.29 | |
| (0.5) | 0.48 | 0.47 | 0.45 | 0.45 | 0.45 | 0.45 | 0.45 | |
| (0.7) | 0.65 | 0.64 | 0.63 | 0.62 | 0.62 | 0.62 | 0.61 | |
|
| ||||||||
| Figure 6 | RPM | 0.31 | 0.5 | 0.65 | 0.62 | |||
|
| ||||||||
| CEN | 0.47 | 0.5 | 0.56 | 0.64 | ||||
|
| ||||||||
| HYB | 0.46 | 0.5 | 0.58 | 0.64 | ||||
The RPM pinpoints a attenuation estimate of 0.5 dB/cm/MHz when SOS between a sample and a reference phantom are the same, i.e. 1540 m/s. However, RPM overestimates the attenuation coefficient when the sample sound speed is higher than the reference sound speed of 1540m/s. The centroid downshift method performs well for the 0.5 dB/cm/MHz sample and reference at the 1540 m/s SOSs but it underestimates and overestimates the attenuation slope coefficient when the SOS difference gets larger, similar to the results obtained with the RPM. Results obtained with the hybrid method show a similar trend, however, the bias between the actual and the estimated attenuation slope is lowest with the hybrid method as clearly illustrated in Fig. 1.
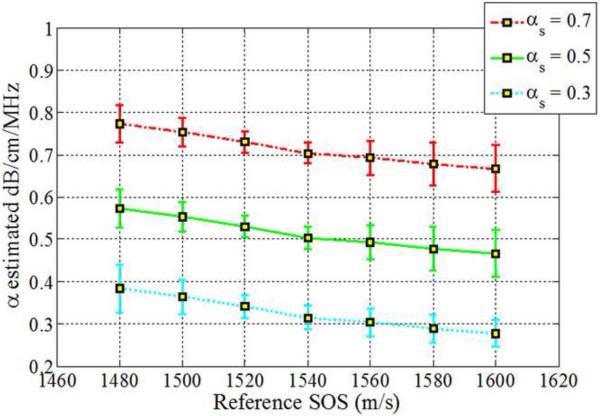
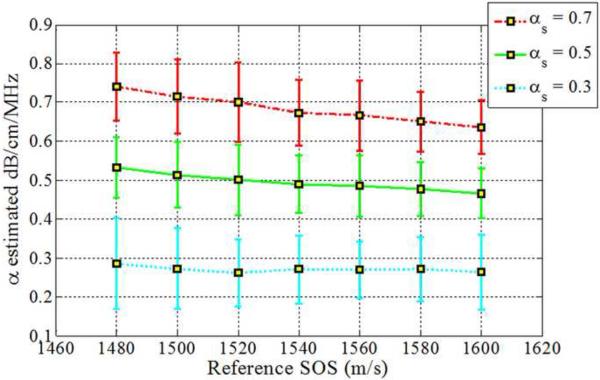
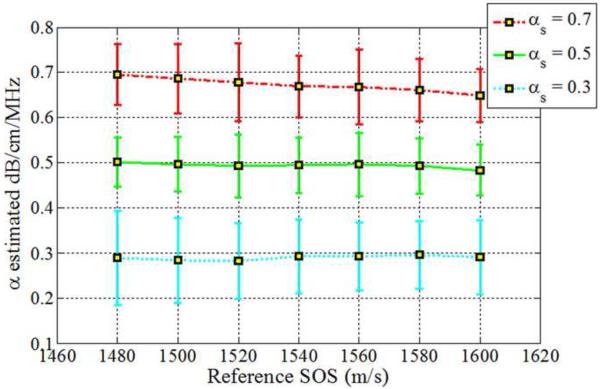
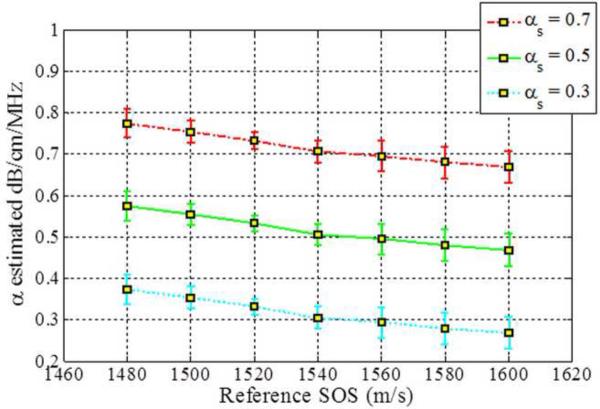
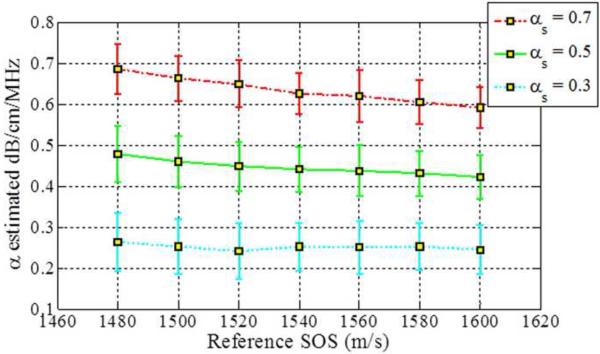
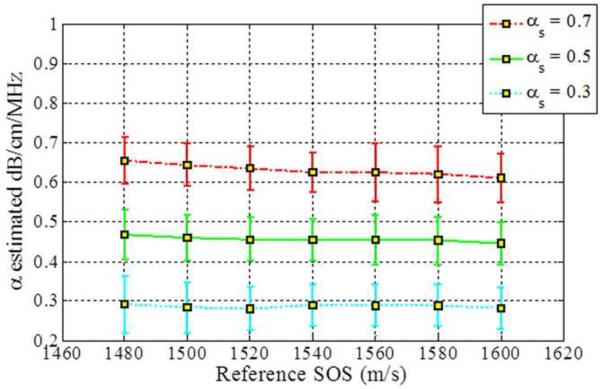
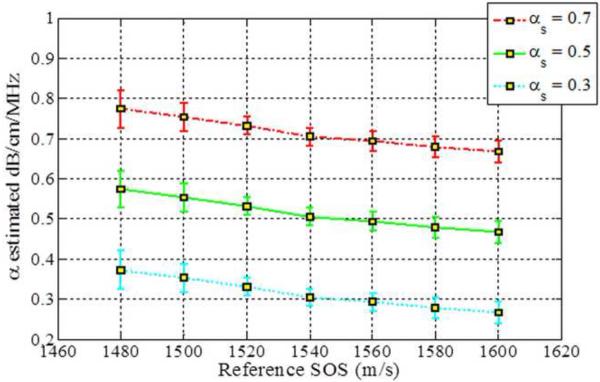
The impact of backscatter variations on attenuation slope estimation, obtained with the three methods, when the backscatter intensity of the sample is equal, 3dB higher and 3 dB lower than the reference respectively is shown in Figs 2–4, respectively. In addition, attenuation slope curves for the sample phantoms with attenuation coefficient values of 0.3, 0.5 and 0.7 dB/cm/MHz respectively, with the sound speed ranging from 1480 m/s to 1600m/s, at 20 m/s increments, similar to that plotted in Fig. 1, are presented in Figs. 2–4. The reference phantom used to generate Figs. 2–4, had a sound speed of 1540 m/s and an attenuation coefficient of 0.5 dB/cm/MHz.
Figure 2.
Estimated attenuation slopes for the sample phantoms when backscatter intensity between the reference and the sample phantoms are the same (Case 3 from Table 1) using (a) Reference phantom method, (b) Centroid downshift method and (c) Hybrid method.
Figure 4.
Estimated attenuation slope for the sample phantoms when the backscatter intensity of the sample phantom is 3dB lower than the reference (Case 3 from Table 1) using (a) Reference phantom method, (b) Centroid downshift method and (c) Hybrid method.
When the backscatter intensity of the sample is equal to the reference as shown in Fig. 2, attenuation slope estimations using the hybrid method are less sensitive to the different sound speed differences between the reference and the sample phantoms when compared to the other methods, similar to the trend observed in Fig. 1. A gradual downward trend or bias in the attenuation slope estimated is observed for the sample phantom with an attenuation coefficient of 0.7 dB/cm/MHz with the hybrid method. The RPM estimated the attenuation slope correctly when the reference and sample phantom's have the same SOS of 1540 m/s. In other words, it produces the best result when the SOS of the sample and reference are identical. However, the larger the difference in the SOS between the reference and sample phantom, the more the underestimation or overestimation of the attenuation slope when compared to the other methods.
When the backscatter intensity of the samples are 3dB higher than that of the reference phantoms, as shown in Fig. 3, the hybrid method provides the closest estimated value of the attenuation coefficient with lowest standard deviation when compared to the other methods. The RPM results shown in Fig. 3 (a), indicate a similar pattern as described previously in Fig. 2. The Centroid Downshift method underestimates the attenuation slope over almost all of the different speeds of sound. In a similar manner, when the backscatter intensity of the samples is 3dB lower than that of reference phantoms, the estimation results for the attenuation coefficient is similar to that obtained with the 3dB higher backscatter intensity samples as shown in Fig. 4.
Figure 3.
Estimated attenuation slope for the sample phantoms when the backscatter intensity of the sample phantom is 3dB higher than the reference (Case 3 from Table 1) using (a) Reference phantom method, (b) Centroid downshift method and (c) Hybrid method.
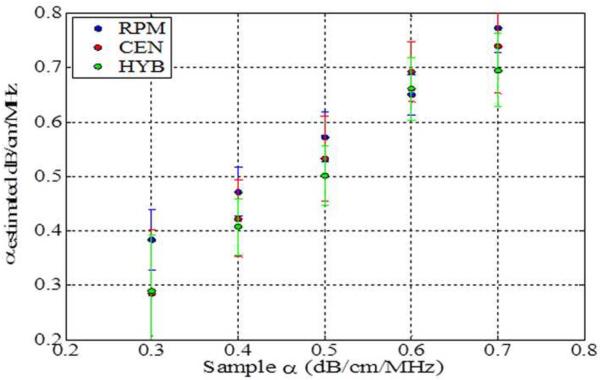
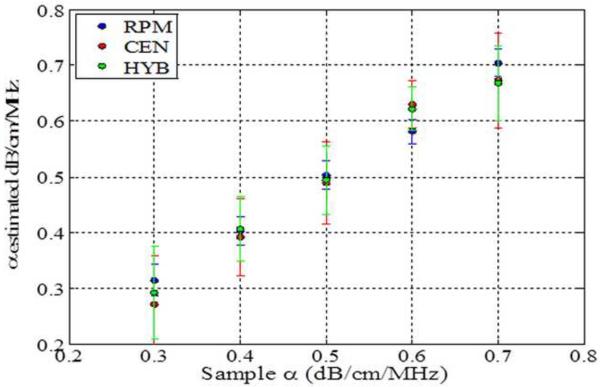
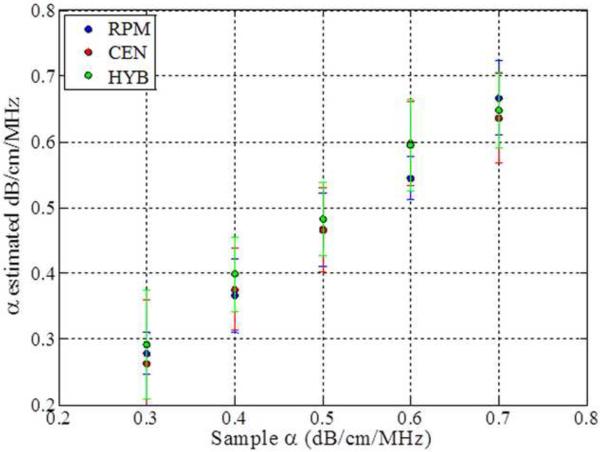
Figure 5 compares the results of the three methods for sample phantoms that have different sound speeds of 1480, 1540 and 1600 m/s, respectively. At a SOS of 1480 m/s, the RPM consistently overestimates the attenuation slope for each of the sample phantoms. The hybrid method yields accurate estimation except for the sample phantoms with an attenuation coefficient of 0.6 dB/cm/MHz. It underestimates the attenuation slope for the sample phantoms with attenuation coefficient of 0.5 and 0.7 dB/cm/MHz along with the centroid downshift method. The RPM underestimates the attenuation slope for all sample phantoms when the reference phantom speed of sound is higher than the sample's sound of speed.
Figure 5.
Estimated attenuation coefficients of sample phantoms with speed of sound 1540 m/s, and reference phantoms with sounds speeds of (a) 1480 m/s (b) 1540 m/s and (c) 1600 m/s. (Case 2 from Table 1, RPM: Reference Phantom Method, CEN: Centroid Downshift Method, HYB: Hybrid Method)
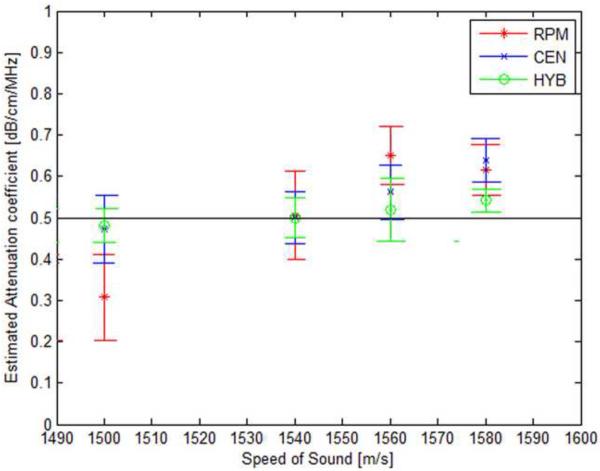
Experimental results of the attenuation slope estimation using the three methods are shown in Fig. 6 using the TM phantoms manufactured in our laboratory. Table 2, presents the acoustic properties of the experimental phantoms. Note that the RPM underestimates the attenuation coefficient, when the reference phantom has a higher sound speed than the sample phantom and overestimates when the sound speed of the reference phantom is lower than that of the sample phantom. For the centroid and the hybrid methods, the attenuation coefficient is overestimated when the sound speed of the sample phantom is higher than that of the reference phantom due to the higher upward shift in the power spectra frequency, whereas it is slightly underestimated when the sample sound speed is lower than that of the reference phantom due to the smaller shift in the power spectra center frequency.
Figure 6.
Attenuation slope estimation results for the three methods for sample TM phantoms with different sound speeds. Observe the bias in the attenuation slope estimated as the sound speed difference between the reference and the sample increase. (RPM: Reference Phantom Method, CEN: Centroid Downshift Method, HYB: Hybrid Method)
Table 2.
Acoustic properties of the TM sample and reference phantoms.
| Acoustic Property | Sample Phantom | Reference Phantom |
|---|---|---|
| Speed of Sound (m/s) | 1500 1540 1560 1580 | 1540 |
| Attenuation Coefficient (dB/cm/MHz) | 0.5 | 0.5 |
| Scatter Number Density (number / mm3) | 10 | 10 |
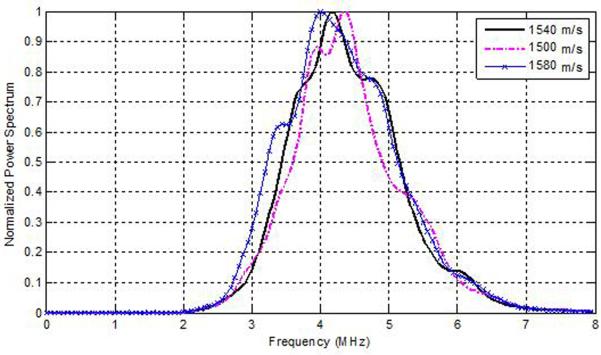
To understand the results described in Figs. 1–6, we plot the power spectra estimated from experimental TM phantoms. Figure 7, presents power spectra estimated from three different phantoms with sound speeds of 1500, 1540 and 1580 m/s, respectively. Observe that depending on the SOS of the phantoms, the central peak of the power spectra is shifted spectrally by a small amount. Since the sound speed set in the beamformer of the ultrasound system was 1540 m/s, we compare the power spectrum of the TM phantom with the 1540 m/s sound speed to the ones generated from the TM phantoms with the lower and higher sound speed. Observe that the power spectra of the phantoms with lower and higher sound speed are shifted when compared to the power spectra obtained for the phantom with the sound speed of 1540 m/s. From Fig. 7, we compute a spectral upshift of 0.375 MHz for the phantom with a sound speed of 1500 m/s, and a spectral downshift of 0.174 MHz for the phantom with the higher sound speed of 1580 m/s when compared to the phantom with the 1540 m/s sound speed. To generalize, we obtain a spectral upshift if the medium sound speed is lower than the sound speed set in the beamformer and a corresponding downshift when the medium sound speed is larger than that of the ultrasound beamformer.
Figure 7.
Spectral shifts in the normalized Power spectra obtained for TM phantoms with different sound speeds.
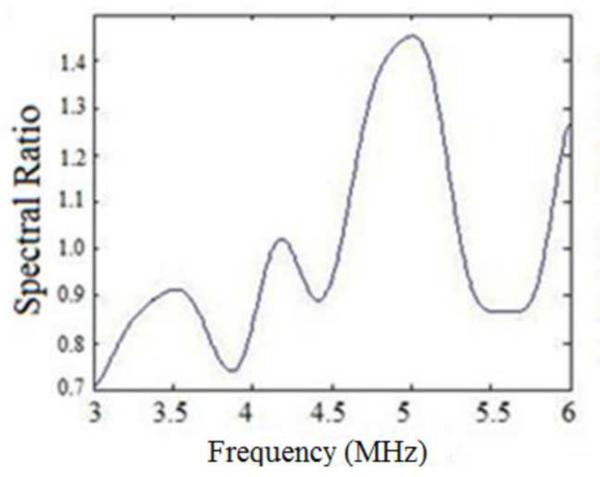
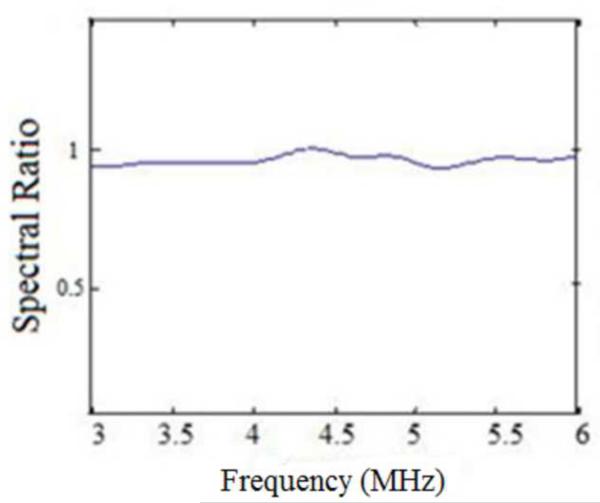
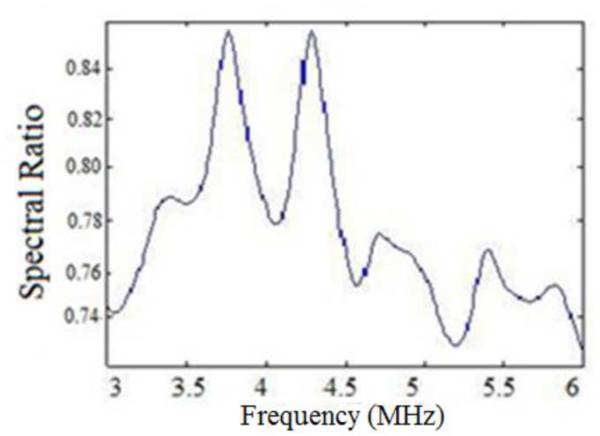
Since the centroid downshift method uses the downshift in the power spectra to estimate the attenuation slope, we would expect the bias in the results as shown in Figs. 1–6. The RPM, on the other hand utilizes the normalized power spectra and is a spectral difference method. The spectral shift with the sound speed difference however also impacts the normalization, because of the mismatch in the sound speed of the sample and reference phantom. The hybrid method computes the center frequency shift of the filtered and normalized power spectral ratio between the sample and reference power spectra. To further understand the bias errors associated with the hybrid method, we plotted the normalized power spectral ratio between the reference and the sample phantoms. Figure 8 (a) shows that the power spectral ratio shifts to the right (towards higher frequencies) when the sample sound speed is greater than the reference sound speed. Note that the spectral ratio is almost constant when the sample and reference sound speed are the same as shown in Fig. 8(b). Finally Fig. 8 (c) shows the condition where the power spectrum ratio shifts to the left, when the sample sound speed is lower than the reference sound speed. Also note that the shift in the normalized power spectral ratio is opposite to that of the spectral shift observed in Fig. 7, a possible reason for the reduced bias in attenuation slope estimates observed with the hybrid method.
Figure 8.
Plots of the normalized Power spectral ratio between sample and reference power spectrums for the experimental data when: (a) the sample sound speed is greater than the reference sound speed, (b) sound speeds of the reference and the phantom are the same and (c) the sample sound speed is lower than the reference sound speed.
DISCUSSION
Since the beamformer SOS is fixed at 1540 m/s in clinical ultrasound systems, any difference in the tissue sound speed can introduce a bias in the attenuation slope estimated for quantitative ultrasound imaging. In addition, an apparent time-shift is observed in the RF and B-mode signals, leading to an incorrect scaling of depth information in the phantom. In turn, the ROI in these phantoms will be located at shallower or deeper depths than it is supposed to be. Without appropriate compensation, the algorithm will pick up different regions between the sample and the reference. We illustrate that the differences between the SOS used in the beamformer and that of the tissue or material being imaged introduces the spectral or frequency shift in the power spectra as shown in Fig. 7.
When the entire spectrum in the frequency domain is shifted, each frequency will have a different spectral amplitude. As the material SOS increases, the pulse propagates faster through the medium and backscattered signal arrives back at the transducer in a shorter time. The power spectrum as shown in Fig. 7, moves to a slightly lower frequency range, due to the transmit focusing with the lower sound speed of 1540 m/s. In a similar manner, when the medium has a lower sound speed, the ultrasound pulse takes longer to propagate and backscatter, resulting in a shift toward higher frequencies in the power spectrum with the faster speed set in the beamformer.
These small shifts lead to the bias in estimation of the attenuation coefficient slope, which increases with larger fluctuations in the sound speed. Attenuation is estimated from the downshift in the center frequency, thus media with lower sound speeds introduce an underestimation bias in proportion to the spectral upshift introduced as shown in Fig. 7. Overestimation is introduced for media with a faster sound speed due to the addition of the spectral downshift bias due to sound speed changes to the actual attenuation estimated. Because the RPM takes the log spectral difference between sample and reference in the same frequency bin, errors in the estimated attenuation slope would be more pronounced and will be present even if one of the spectra is slightly shifted.
For all methods the attenuation coefficient is underestimated when the sound speed of the sample is lower than that of the reference phantom. For the RPM attenuation coefficient is overestimated when the sample sound speed is higher than the reference sound speed of 1540m/s. Since the power spectrum of the higher sound speed sample lies in a lower frequency range than that for the sample with the 1540 m/s sound speed, the power spectral signal ratio changes lead to an inaccurate estimation of the attenuation slope. The centroid downshift method performs well for the samples with an attenuation coefficient of 0.5dB/cm/MHz but underestimates and overestimates when SOS differences become lower or higher, similar to that illustrated with the RPM. For the hybrid method the bias in the attenuation slope estimated depends on the center frequency of the Gaussian filter used to scale the power spectral ratio. In general, this center frequency should be the same as the center frequency of the transducer used to acquire the data. Since ultrasound transducers are resonant devices the best signal-to-noise ratio is obtained in the region around the center or excitation frequency of the transducer. SOS variations in the sample and reference power spectra, may introduce peaks in the power spectral ratio that are different from the center frequency of the ultrasound system, which is utilized for the Gaussian filter center frequency.
For the RPM, the attenuation coefficient is underestimated when the sample sound speed is lower than that of the reference sound speed and overestimated when the sound speed is higher, irrespective of whether the backscatter intensity of the sample is equal, 3 dB lower, and 3 dB higher than that of the reference phantom. For the centroid downshift method the attenuation coefficient does not follow a pattern when the backscatter intensity of the sample is equal or 3 dB higher than that of the reference but always underestimates the attenuation coefficient when the backscatter intensity of the sample is 3 dB lower than that of the reference phantom. The hybrid method shows the least dependence on the backscatter intensity of the sample. However, the sound of speed is less dependent in the case of low attenuation values, the hybrid method provides a robust attenuation estimate as shown in Figs. 2(c) and 3(c).
CONCLUSION
The impact of SOS and backscatter intensity variations on the estimation of the attenuation slope has been investigated using three frequency domain estimation algorithms, the RPM, the centroid downshift method, and the hybrid method. The SOS mismatch between that utilized for the beamformer and the sample or tissue introduces the estimation bias for the centroid downshift method. This bias is also observed with the RPM due to the small spectral shift, introducing errors in the log spectral difference computed to estimate the attenuation slope. Experimentally, all of the methods underestimate the attenuation slope when the sample sound speed is lower than that of the reference, and overestimate the attenuation slope when the reverse is true. The hybrid method has the smallest bias with respect to sound speed changes when compared to the other methods.
The results presented in this paper also demonstrate that the RPM provides accurate and precise (smallest errorbars) results, where the reference phantom properties are similar to that of the sample or tissue being imaged. A second observation is that the RPM performs poorly if the attenuation coefficient of the reference is lower than that of the sample or tissue being imaged.
The hybrid method shows the least dependence on sound speed mismatches between the tissue or phantom being imaged and the beamformer settings. The small spectral shifts introduced due to the sound speed variations in the tissue being imaged (sample), appear to be diminished with the normalization with the reference spectra that is performed with the hybrid method as illustrated with Figs. 7 and 8. The discussion in this paper applies for array transducers focused at similar depths in both the sample and reference phantoms. Additional work using unfocussed transducers to evaluate the impact of sound speed on the attenuation slope estimates, should be performed to determine if the artifacts are due to focusing of the ultrasound beam in media with sound speed variations.
Acknowledgements
This work was supported in part by NIH grants R21 EB003853, R01CA112192-S103, and R01 CA111289.
Footnotes
Publisher's Disclaimer: This is a PDF file of an unedited manuscript that has been accepted for publication. As a service to our customers we are providing this early version of the manuscript. The manuscript will undergo copyediting, typesetting, and review of the resulting proof before it is published in its final citable form. Please note that during the production process errors may be discovered which could affect the content, and all legal disclaimers that apply to the journal pertain.
References
- 1.Zeqiri B, Scholl W, Robinson SP. Measurement and testing of the acoustic properties of materials: a review. Metrologia. 2010;47(2):S156–S71. [Google Scholar]
- 2.Bigelow TA, Oelze ML, O'Brien WDJ. Estimation of total attenuation and scatterer size from backscattered ultrasound waveforms. J Acoust Soc Am. 2005;117(3 Pt 1):1431–9. doi: 10.1121/1.1858192. [DOI] [PubMed] [Google Scholar]
- 3.Ribault M, Chapelon JY, Cathignol D, Gelet A. Differential attenuation imaging for the characterization of high intensity focused ultrasound lesions. Ultrason Imaging. 1998;20(3):160–77. doi: 10.1177/016173469802000302. [DOI] [PubMed] [Google Scholar]
- 4.Yang Y, Dunn F. Acoustic non-linearity method for estimating the ratio of bound to free water of biological media. Ultrasonics. 1993;31(1):35–8. doi: 10.1016/0041-624x(93)90030-4. [DOI] [PubMed] [Google Scholar]
- 5.Duck F. Tissue non-linearity. Proc Inst Mech Eng H. 2010;224(2):155–70. doi: 10.1243/09544119JEIM574. [DOI] [PubMed] [Google Scholar]
- 6.Mamou J, Coron A, Hata M, Machi J, Yanagihara E, Laugier P, et al. Three-dimensional high-frequency characterization of cancerous lymph nodes. Ultrasound Med Biol. 2010;36(3):361–75. doi: 10.1016/j.ultrasmedbio.2009.10.007. [DOI] [PMC free article] [PubMed] [Google Scholar]
- 7.Yang M, Krueger TM, Miller JG, Holland MR. Characterization of anisotropic myocardial backscatter using spectral slope, intercept and midband fit parameters. Ultrason Imaging. 2007;29(2):122–34. doi: 10.1177/016173460702900204. [DOI] [PubMed] [Google Scholar]
- 8.Lin T, Ophir J, Potter G. Frequency-dependent ultrasonic differentiation of normal and diffusely diseased liver. J Acoust Soc Am. 1987;82(4):1131–8. doi: 10.1121/1.395303. [DOI] [PubMed] [Google Scholar]
- 9.Lu ZF, Zagzebski JA, Lee FT. Ultrasound backscatter and attenuation in human liver with diffuse disease. Ultrasound Med Biol. 1999;25:1047–54. doi: 10.1016/s0301-5629(99)00055-1. [DOI] [PubMed] [Google Scholar]
- 10.Huisman HJ, Thijssen JM, Wagener DJ, Rosenbusch GJ. Quantitative ultrasonic analysis of liver metastases. Ultrasound Med Biol. 1998;24(1):67–77. doi: 10.1016/s0301-5629(97)00211-1. [DOI] [PubMed] [Google Scholar]
- 11.Bajaj M, Koo W, Hammami M, Hockman EM. Effect of subcutaneous fat on quantitative bone ultrasound in chicken and neonates. Pediatr Res. 2010;68(1):81–3. doi: 10.1203/PDR.0b013e3181df9c8c. [DOI] [PubMed] [Google Scholar]
- 12.Wilson T, Chen Q, Zagzebski JA, Varghese T, VanMiddlesworth L. Initial clinical experience imaging scatterer size and strain in thyroid nodules. J Ultrasound Med. 2006;25(8):1021–9. doi: 10.7863/jum.2006.25.8.1021. [DOI] [PubMed] [Google Scholar]
- 13.Strowitzki M, Brand S, Jenderka KV. Ultrasonic radio-frequency spectrum analysis of normal brain tissue. Ultrasound Med Biol. 2007;33(4):522–9. doi: 10.1016/j.ultrasmedbio.2006.09.004. [DOI] [PubMed] [Google Scholar]
- 14.Taylor KJ, Riely CA, Hammers L, Flax S, Weltin G, Garcia-Tsao G, et al. Quantitative US attenuation in normal liver and in patients with diffuse liver disease: importance of fat. Radiology. 1986;160(1):65–71. doi: 10.1148/radiology.160.1.3520657. [DOI] [PubMed] [Google Scholar]
- 15.Landini L, Sarnelli R, Squartini F. Frequency-dependent attenuation in breast tissue characterization. Ultrasound Med Biol. 1985;11(4):599–603. doi: 10.1016/0301-5629(85)90031-6. [DOI] [PubMed] [Google Scholar]
- 16.McFarlin BL, O'Brien WDJ, Oelze ML, Zachary JF, White-Traut RC. Quantitative ultrasound assessment of the rat cervix. J Ultrasound Med. 2006;25:1031–40. doi: 10.7863/jum.2006.25.8.1031. [DOI] [PMC free article] [PubMed] [Google Scholar]
- 17.Bigelow TA, McFarlin BL, O'Brien WD, Oelze ML. In vivo ultrasonic attenuation slope estimates for detecting cervical ripening in rats: Preliminary results. J Acost Soc Am. 2008;123(3):1794–800. doi: 10.1121/1.2832317. [DOI] [PMC free article] [PubMed] [Google Scholar]
- 18.El-Brawany MA, Nassiri DK, Terhaar G, Shaw A, Rivens I, Lozhken K. Measurement of thermal and ultrasonic properties of some biological tissues. J Med Eng Technol. 2009;33(3):249–56. doi: 10.1080/03091900802451265. [DOI] [PubMed] [Google Scholar]
- 19.Techavipoo U, Varghese T, Chen Q, Stiles TA, Zagzebski JA, Frank GR. Temperature dependence of ultrasonic propagation speed and attenuation in excised canine liver tissue measured using transmitted and reflected pulses. J Acoust Soc Am. 2004;115(6):2859–65. doi: 10.1121/1.1738453. [DOI] [PubMed] [Google Scholar]
- 20.Robinson DE, Chen F, Wilson L, Knight PC. In vivo measurement of sound speed with pulsed echo ultrasound. Ultrasound Med Biol. 1983;(Suppl 2):123–6. [PubMed] [Google Scholar]
- 21.Ravary-Plumioen B, Pourcelot P, Evrard D, Crevier-Denoix N. Variability of speed of sound measurements in loaded equine superficial digital flexor tendons. Computer Methods in Biomechanics and Biomedical Engineering. 2008;11:191–2. [Google Scholar]
- 22.Keshavarzi A, Vaezy S, Kaczkowski PJ, Keilman G, Martin R, Chi EY, et al. Attenuation coefficient and sound speed in human myometrium and uterine fibroid tumors. J Ultrasound Med. 2001;20(5):473–80. doi: 10.7863/jum.2001.20.5.473. [DOI] [PubMed] [Google Scholar]
- 23.Garra BS, Locher M, Felker S, Wear KA. Measurements of ultrasonic backscattered spectral centroid shift from spine in vivo: methodology and preliminary results. Ultrasound Med Biol. 2009;35(1):165–8. doi: 10.1016/j.ultrasmedbio.2008.06.004. [DOI] [PMC free article] [PubMed] [Google Scholar]
- 24.Gaitini D, Baruch Y, Ghersin E, Veitsman E, Kerner H, Shalem B, et al. Feasibility study of ultrasonic fatty liver biopsy : texture vs. attenuation and backscatter. Ultrasound Med Biol. 2004;30(10):1321–7. doi: 10.1016/j.ultrasmedbio.2004.08.001. [DOI] [PubMed] [Google Scholar]
- 25.Yao LX, Zagzebski JA, Madsen EL. Backscatter coefficient measurements using a reference phantom to extract depth-dependent instrumentation factors. Ultrason Imaging. 1990;12(1):58–70. doi: 10.1177/016173469001200105. [DOI] [PubMed] [Google Scholar]
- 26.He P, Greenleaf JF. Attenuation estimation on phantoms-a stability test. Ultrason Imaging. 1986;8(1):1–10. doi: 10.1177/016173468600800101. [DOI] [PubMed] [Google Scholar]
- 27.Fink M, Hottier F, Cardoso JF. Ultrasonic signal processing for in vivo attenuation measurement: short time Fourier analysis. Ultrason Imaging. 1983;5(2):117–35. doi: 10.1177/016173468300500202. [DOI] [PubMed] [Google Scholar]
- 28.Kim H, Varghese T. Hybrid spectral domain method for attenuation slope estimation. Ultrasound Med Biol. 2008;34(11):1808–19. doi: 10.1016/j.ultrasmedbio.2008.04.011. [DOI] [PubMed] [Google Scholar]
- 29.Kim H, Varghese T. Attenuation estimation using spectral cross-correlation. IEEE Trans Ultrason Ferroelectr Freq Control. 2007;54(3):510–9. doi: 10.1109/tuffc.2007.274. [DOI] [PubMed] [Google Scholar]
- 30.Culjat MO, Goldenberg D, Tewari P, Singh RS. A review of tissue substitutes for ultrasound imaging. Ultrasound Med Biol. 2010;36(6):861–73. doi: 10.1016/j.ultrasmedbio.2010.02.012. [DOI] [PubMed] [Google Scholar]
- 31.Li Y, Zagzebski JA. A frequency domain model for generating B-mode images with array transducers. IEEE Trans Ultrason Ferroelectr Freq Control. 1999;46(3):690–9. doi: 10.1109/58.764855. [DOI] [PubMed] [Google Scholar]
- 32.Chen Q. Ph.D dissertation. University of Wisconsin-Madison; Madison: 2004. Computer simulation in parametric ultrasonic imaging. [Google Scholar]
- 33.Bamber JC. In: Physical principles of medical ultrasonics, speed of sound pp. 200–224. Hill CR, editor. Halsted Press; New York: 1986. [Google Scholar]
- 34.Wagner RF, Smith SW, Sandrik JM, Lopez H. Statistics of speckle in ultrasound B-scans. IEEE Trans Sonics and Ultrasonics. 1983;30(3):156–63. [Google Scholar]
- 35.Insana MF, Wagner RF, Brown DG, Hall TJ. Describing small-scale structure in random media using pulse-echo ultrasound. J Acoust Soc Am. 1990;87(1):179–92. doi: 10.1121/1.399283. [DOI] [PMC free article] [PubMed] [Google Scholar]
- 36.Madsen EL, Frank GR, Carson PL, Edmonds PD, Frizzell LA, Herman BA, et al. Interlaboratory comparison of ultrasonic attenuation and speed measurements. J Ultrasound Med. 1986;5(10):569–76. doi: 10.7863/jum.1986.5.10.569. [DOI] [PubMed] [Google Scholar]
- 37.Madsen EL, Dong F, Frank GR, Garra BS, Wear KA, Wilson T, et al. Interlaboratory comparison of ultrasonic backscatter, attenuation, and speed measurements. J Ultrasound Med. 1999;18(9):615–31. doi: 10.7863/jum.1999.18.9.615. [DOI] [PubMed] [Google Scholar]
- 38.Welch P. The use of fast Fourier transform for the estimation of power spectra: A method based on time averaging over short, modified periodograms. IEEE Transactions on Audio and Electroacoustics. 1967;15(2):70–3. [Google Scholar]


