Abstract
Pyrophosphate, which may be deficient in advanced renal failure, is a potent inhibitor of vascular calcification. To explore its use as a potential therapeutic, we injected exogenous pyrophosphate subcutaneously or intraperitoneally in normal rats and found that their plasma pyrophosphate concentrations peaked within 15 min. There was a single exponential decay with a half-life of 33 min. The kinetics were indistinguishable between the two routes of administration or in anephric rats. The effect of daily intraperitoneal pyrophosphate injections on uremic vascular calcification was then tested in rats fed a high-phosphate diet containing adenine for 28 days to induce uremia. Although the incidence of aortic calcification varied and was not altered by pyrophosphate, the calcium content of calcified aortas was significantly reduced by 70%. Studies were repeated in uremic rats given calcitriol to produce more consistent aortic calcification and treated with sodium pyrophosphate delivered intraperitoneally in a larger volume of glucose-containing solution to prolong plasma pyrophosphate levels. This maneuver significantly reduced both the incidence and amount of calcification. Quantitative histomorphometry of bone samples after double-labeling with calcein indicated that there was no effect of pyrophosphate on the rates of bone formation or mineralization. Thus, exogenous pyrophosphate can inhibit uremic vascular calcification without producing adverse effects on bone.
Keywords: activated vitamin D, bone, chronic kidney disease, uremia
Pyrophosphate (PPi) is a potent inhibitor of calcium crystallization that is present in body fluids at concentrations sufficient to prevent hydroxyapatite formation in vitro,1–3 suggesting that it may function as an endogenous inhibitor of calcification. In particular, production of PPi by smooth muscle may be an important defense against medial vascular calcification. Rat aortas do not calcify in vitro unless the PPi produced by the vessels is removed.4 Furthermore, humans lacking ectonucleotide pyrophosphorylase1 (Enpp1), the enzyme that synthesizes extracellular PPi, develop severe medial arterial calcification at an early age.5–7
Recent data suggest that PPi deficiency may contribute to the increased incidence of medial vascular calcification in advanced kidney disease. Levels of PPi are reduced in hemodialysis patients,8 and correlate inversely with the level of vascular calcification in patients with advanced chronic kidney disease.9 Hydrolysis of PPi is increased in aortas from uremic rats because of upregulation of alkaline phosphatase,10 providing a mechanism for vascular deficiency of PPi. Therefore, the data suggest that exogenous PPi may be useful in treating or preventing uremic vascular calcification.
Studies conducted more than four decades ago showed that subcutaneously administered PPi inhibited medial arterial calcification in vitamin D-toxic rats.11 However, large doses were required and the treatment resulted in marked skin necrosis. Nonhydrolyzable analogs of PPi, such as bisphosphonates, were subsequently shown to inhibit vascular calcification in the same animal model, but at much lower doses.3 More recently, bisphosphonates have been shown to prevent aortic calcification in uremic rats.12,13 One potential problem with this therapy, however, is inhibition of bone formation. The high levels of tissue-nonspecific alkaline phosphatase (TNAP) in bone serve to remove PPi and allow bone formation to occur in the face of inhibitory circulating PPi concentrations.14 This is the basis for the skeletal abnormalities in hypophosphatasia, where TNAP is deficient.15 However, TNAP would not protect bone from the non-hydrolyzable bisphosphonates and, accordingly, the doses of bisphosphonates that inhibit vascular calcification in uremic rats also inhibit bone formation.13
Based on these previous results, we reasoned that exogenous PPi might inhibit uremic vascular calcification without adversely affecting bone. Therefore, we explored the therapeutic potential of PPi in uremic vascular calcification by examining both its pharmacokinetics and its effects on aortic calcification and bone formation in a model of medial arterial calcification in uremic rats.
RESULTS
Pharmacokinetics
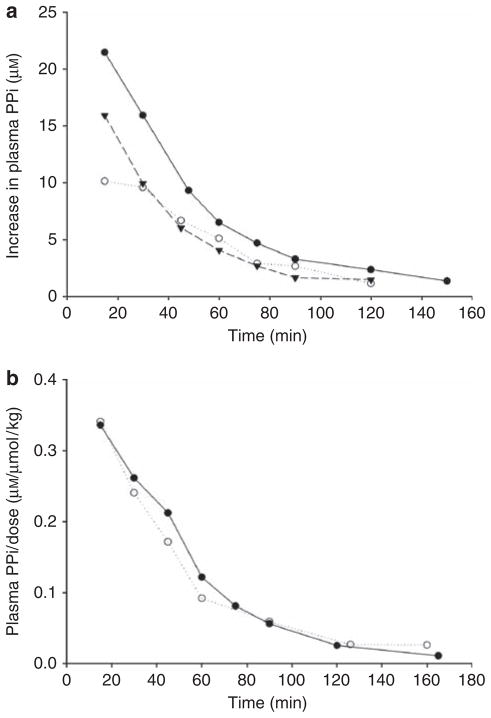
Initial studies were performed in three rats using a single subcutaneous injection of 80 μmol/kg of PPi containing tracer 32PPi. At 15 min, 51.9±3.5% of the radioactivity in the plasma was in the form of orthophosphate and this increased to 91.4±0.8% at 120 min, indicating rapid hydrolysis of PPi. Plasma 32PPi peaked at 15 min and decreased exponentially thereafter (Figure 1a). The r2 for the linear regression of the logarithmically transformed data ranged from 0.95 to 0.98, indicating a single-exponential decline and yielded a half-life of 31.4±1.4 min. Extrapolation to the ordinate yielded an apparent volume of distribution of 4.1±0.5 l/kg. In an additional study performed with both renal arteries and veins occluded to determine the renal contribution to PPi clearance, the half-life was 35 min (not shown). Similar results were obtained after intraperitoneal injection (Figure 1b), with a half-life of 34.1±2.6 min. However, the peak concentration as a fraction of the dose (0.336 and 0.340 μM/μmol/kg) was greater than after subcutaneous injection (0.196±0.041 μM/μmol/kg), suggesting better delivery by the intraperitoneal route. With either route, the half-life was not affected by the dose (shown in Figure 1b). Oral administration was not attempted because of rapid PPi hydrolysis in the intestinal tract.11
Figure 1. Change in plasma pyrophosphate (PPi) concentration after injection of PPi containing tracer [32P]PPi.
(a) Single subcutaneous injection of 80 μmol/kg sodium PPi in three different rats. (b) Single intraperitoneal injections of 0.026 μmol/kg (solid symbols) or 2.6 μmol/kg (open symbols) sodium PPi in a volume of 5 ml/kg. The increment in plasma PPi concentration was calculated from the specific activity of the injected 32PPi.
Effect on vascular calcification
To determine whether PPi administration reduces uremic vascular calcification, rats fed a high-phosphate diet containing adenine first underwent daily subcutaneous injection of sodium PPi. However, this route resulted in subcutaneous nodules and was therefore abandoned. In contrast, daily intraperitoneal injection of sodium PPi in a volume of 5 ml/kg appeared to be well tolerated and was therefore used to test our hypothesis. Body weights and plasma chemistries of these rats at the time of killing are presented in Table 1. There was no mortality in the control group. One rat treated with 160 μmol/kg/day died at 10 days (13% mortality). Two rats treated with 80 μmol/kg/day died at 11 and 27 days (25% mortality). The aorta from the latter rat was included in the analysis and was not calcified. PPi treatment did not alter animal weight or the plasma concentrations of calcium and phosphorus. Plasma alkaline phosphatase activity was slightly reduced in the rats treated with the lower dose of PPi but not the higher dose. The urea concentration was slightly higher in the rats treated with the higher dose of PPi but this was not observed in subsequent studies at the same dose (see below), and there were no other signs (weight loss, physical appearance) that these rats were more uremic. There was no correlation between any plasma parameter or the adenine dose and aortic calcium content.
Table 1.
Plasma chemistries in adenine-fed rats receiving daily intraperitoneal injections of NaPPi in 10 ml/kg
| Baseline | PPi dose, μmol/kg/day
|
|||
|---|---|---|---|---|
| 0 (n=15) | 80 (n=6) | 160 (n=7) | ||
| Body weight (g) | 324±1 | 223±6 | 220±10 | 230±5 |
| Urea (mmol/l) | 10.2±0.5 | 23±2 | 24±3 | 36±6* |
| Calcium (mmol/l) | 1.96±0.04 | 1.79±0.10 | 1.62±0.09 | 1.99±0.13 |
| Phosphorus (mmol/l) | 1.4±0.1 | 6.9±0.8 | 6.7±0.4 | 6.7±0.6 |
| Alkaline phosphatase (IU/l) | NA | 76.3±1.2 | 54.8±1.5* | 80.0±3.9 |
Abbreviations: NA, not assayed; NaPPi, sodium PPi; PPi, pyrophosphate.
P<0.05.
Baseline chemistries were obtained from six rats of similar age fed normal rat chow (23% protein).
Results are means±s.e.m.
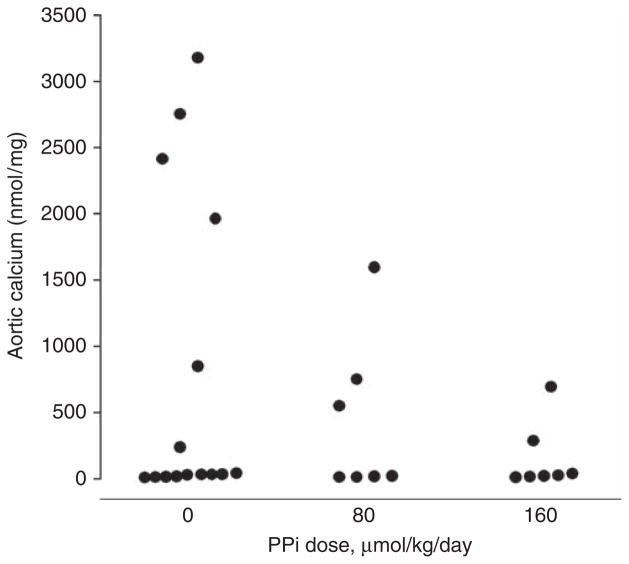
In rats fed a normal diet, aortic calcium content was 20±3 nmol/mg (n = 22). A calcium content of 53 nmol/mg, which is 3 s.d. above that in normal rats, was employed a priori to define pathological calcification. As shown in Figure 2, aortic calcification is variable in this model and only developed in 40% of vehicle-treated rats. The lowest calcium content that met the definition of pathological calcification as outlined above was 235 nmol/mg, indicating a clear distinction between calcified and noncalcified aortas. The incidence of aortic calcification was decreased by PPi at 160 μmol/kg (29 vs 40%), but the difference was not significant. Although there was a dose-dependent decrease in the calcium content of the calcified aortas up to 74% (1898±466 vs 965±319 vs 489±205 nmol/mg), the difference was not significant because of the variability in calcification.
Figure 2. Effect of pyrophosphate (PPi) on aortic calcium content in uremic rats.
Rats were fed a diet consisting of 2.5% protein, 1.06% phosphorus, 0.92% calcium, and 0.75% adenine for 4 weeks and received sodium PPi in Hank’s buffered saline or saline alone by daily intraperitoneal injection of 5 ml/kg. Each point represents a single animal.
To better demonstrate the effect of PPi, changes were made in order to prolong the effect of PPi and to reduce the variability in calcification. To slow the absorption of PPi from the peritoneum, the volume of fluid was increased to 40 ml/kg and glucose was added. As shown in Figure 3, this resulted in a threefold increase in the plasma PPi level, and levels remained elevated for ~240 min. To reduce the variability in aortic calcification, uremic rats were given 40 ng/kg of calcitriol three times per week by subcutaneous injection. This resulted in extensive aortic calcification in all animals (Figure 4), but did not increase aortic calcium content in nonuremic rats, even at the substantially higher dose of 100 ng/kg (33.3±4.3 nmol/kg; n = 6), indicating that this effect is specific for uremia.
Figure 3. Plasma pyrophosphate (PPi) concentration after single intraperitoneal injections of 160 μmol/kg sodium PPi in a volume of 40 ml/kg.
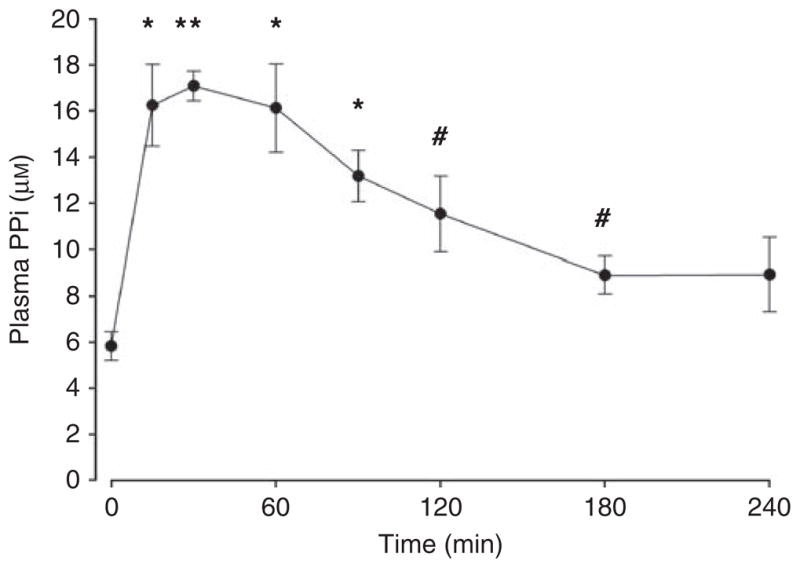
Results are means±s.e.m. of four animals. *P<0.01, **P<0.001, #P<0.05 vs baseline.
Figure 4. Effect of peritoneal infusion of pyrophosphate (PPi) on uremic vascular calcification.
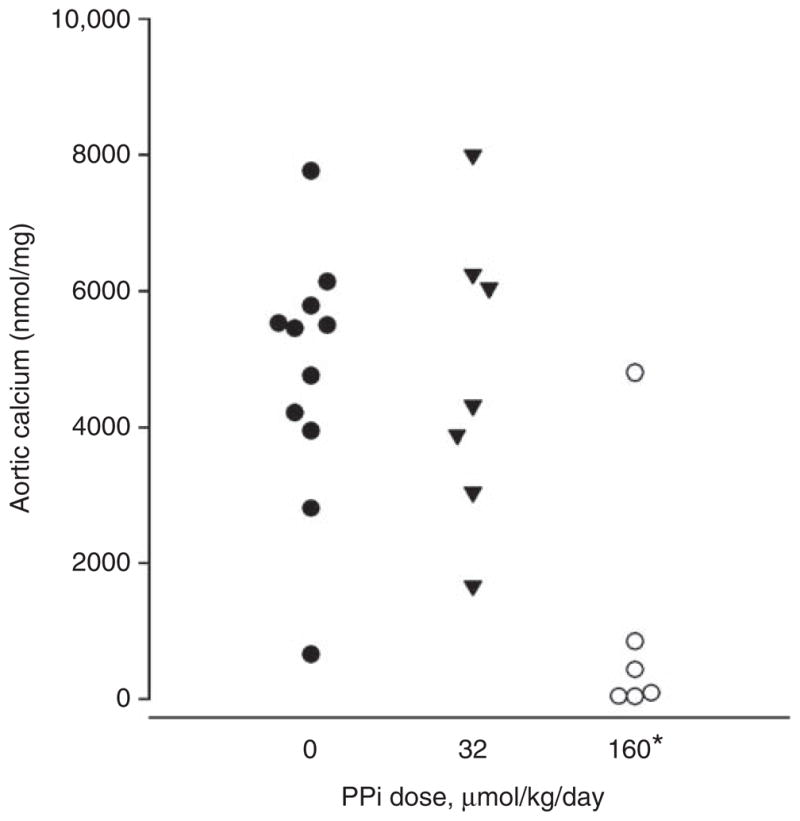
Rats were fed a diet consisting of 2.5% protein, 1.06% phosphorus, 0.92% calcium, and 0.75% adenine for 4 weeks and given calcitriol 40 ng/kg by subcutaneous injection 3 times per week. PPi was infused daily through a peritoneal catheter in a volume of 40 ml/kg. Each point represents a single animal. *P<0.005 vs control.
Two PPi solutions were tested in the studies shown in Figure 4, 0.8 and 4 mmol/l, both injected daily at 40 ml/kg, resulting in doses of 32 and 160 μmol/kg/day. The higher dose significantly reduced aortic calcium content (1040±762 nmol/mg vs 4773 + 565 nmol/mg, P<0.005) and the incidence of calcification (67 vs 100%, P<0.05). The lower dose did not alter calcification (4744±418 nmol/mg). Body weight (276 + 10 vs 271 + 14 g), plasma urea (25 + 5 vs 25 + 3 mmol/l), plasma calcium (1.50 + 0.06 vs 1.58 + 0.07 mmol/l), and plasma phosphorus (6.7 + 0.3 vs 6.5 + 0.3 mmol/l) did not differ between rats treated with 160 μmol/kg and vehicle-treated rats. Plasma PPi levels at the time of killing (24 h after the last peritoneal infusion of PPi) were the same in control rats (5.5±0.4 μM) and rats treated with the higher dose of PPi (5.3±0.7 μM), indicating that there was no accumulation of PPi in the plasma over the course of the experiment.
Effect on bone
Quantitative histomorphometric analysis was performed on femurs from uremic rats (receiving or not receiving calcitriol) treated with or without PPi (high dose only), and are shown in Table 2. For comparison, data from pairfed nonuremic rats obtained in a previous study are also shown. All parameters of bone formation were greatly increased in uremic rats, but were unaffected by PPi treatment. Osteoclastic parameters were also unchanged by PPi treatment (data not shown).
Table 2.
Parameters of bone formation in normal rats and in adenine-fed rats treated with or without 160 μmol PPi/kg/day
| Normal (6) | Uremic
|
||||
|---|---|---|---|---|---|
| No calcitriol
|
Calcitriol
|
||||
| Control (7) | PPi (7) | Control (6) | PPi (6) | ||
| Bone volume (% of total) | 12.5±1.6 | 14.2±2.5 | 15.8±1.6 | 14.4±1.1 | 11.4±0.8 |
| Osteoblasts (no. per 100 mm) | 29±2 | 494±198 | 176±82 | 453±110 | 399±278 |
| Osteoblast surface | 0.39±0.04 | 6.2±2.2 | 2.5±1.1 | 5.6±1.3 | 5.3±3.3 |
| Osteoid thickness (μm) | 3.6±0.5 | 4.6±0.9 | 4.4±1.1 | 4.6±0.9 | 3.5±0.3 |
| Mineral apposition (μm/day) | 2.0±0.3 | 5.7±0.6 | 5.5±0.6 | 6.8±0.5 | 6.8±0.6 |
| Bone formation (mm3/cm2/year) | 9.9±1.9 | 24.9±6.3 | 21.9±5.2 | 43.2±8.5 | 45.3±6.2 |
Abbreviation: PPi, pyrophosphate.
None of the differences between control and PPi-treated rats were significant by Mann–Whitney U-test.
Parentheses indicate the number of animals in each group.
Other effects
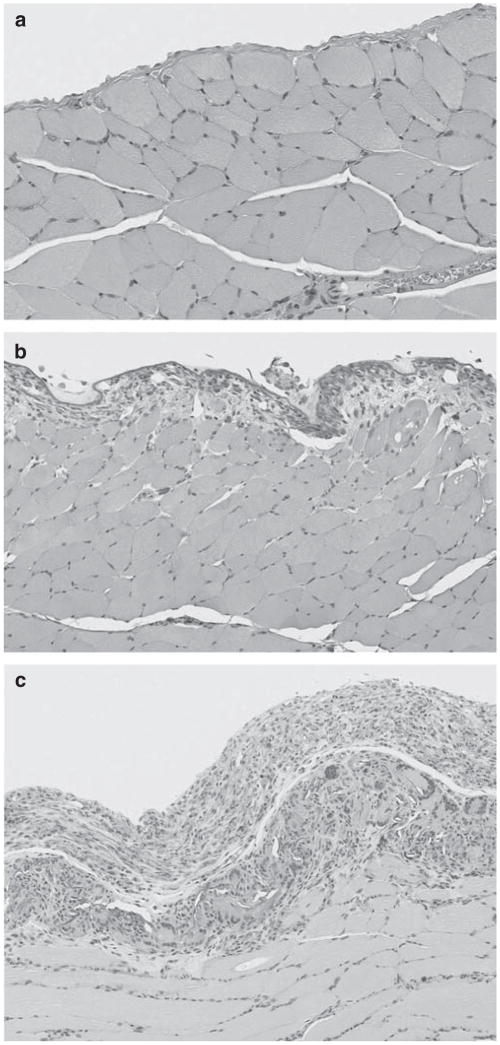
There was no mortality in the second set of studies and there was no difference in the appearance or behavior of the PPi-treated rats. Examination of the knee joint revealed no crystal deposition in rats treated with PPi (not shown). Histology of the abdominal organs revealed a chronic inflammation of the peritoneum covering the diaphragm in low- and high-dose groups (Figure 5) and fibrosis of the splenic capsule and chronic inflammation involving the mesentery attached to the spleen in the high-dose group. In general, the severity of the peritoneal reaction on the diaphragm was marked in rats given 4 mmol/l PPi and only mild in rats receiving 0.8 mmol/l. A mild inflammatory response was also observed in the placebo group, presumably a response to the surgery, the presence of the peritoneal catheter, or exposure to the vehicle. No animal showed overt signs of peritonitis.
Figure 5. Histology of the diaphragm and parietal peritoneum in uremic rats given sodium pyrophosphate (PPi) by intraperitoneal injection.
(a) Vehicle; (b) 0.8 mmol/l PPi; (c) and 4 mmol/l PPi. Hematoxylin and eosin staining.
DISCUSSION
This study demonstrates that exogenous PPi can substantially inhibit vascular calcification in uremic rats. This action is presumably because of an increase in the concentration of PPi in the vessel wall, which directly inhibits hydroxyapatite formation. Tissue levels are controlled by local production and hydrolysis as well as diffusion from the blood. We have previously shown that plasma levels of PPi are reduced in hemodialysis patients8 and that PPi hydrolysis is increased in vessels from uremic rats.10 Although the effect of uremia on extracellular PPi production in the vessel wall is unknown, these data suggest a reduction in extracellular PPi levels in uremic vessels. Owing to the short half-life of PPi in plasma, only transient increases in the concentration of plasma PPi occurred with treatment, and it is possible that the increases in tissue PPi were similarly transient. However, the data show that a 4 h increase in PPi levels with a peak tripling was sufficient to substantially inhibit calcification. This suggests that only intermittent correction of PPi deficiency can prevent calcification.
As PPi could potentially inhibit any hydroxyapatite formation, effects on normally calcified tissues such as bone need to be considered. Despite the robust inhibition of vascular calcification in uremic rats, there was no effect on any parameters of bone formation. This selective action of PPi is probably explained by the high levels of TNAP in bone. This ectoenzyme hydrolyzes PPi and enables mineralization to occur in the face of circulating PPi levels that can inhibit hydroxyapatite formation.14 The inhibition of bone formation that we previously observed with doses of bisphosphonates sufficient to inhibit uremic vascular calcification13 can probably be explained by the fact that bisphosphonates are not hydrolyzed by TNAP and can thus directly inhibit bone mineralization. Another explanation for the selective effect of PPi is the immediate proximity of the vascular wall to circulating PPi compared with bone tissue.
There was a significantly greater plasma urea concentration with the highest PPi dose in the initial study. The fact that this group did not have a reduction in adenine dose compared with the other groups (see Materials and Methods) could have contributed. However, the animals did not show other signs of increased uremia, and plasma urea was not increased in the second set of studies despite the same dose of adenine. There was no articular crystal deposition indicative of calcium PPi deposition disease, suggesting that arthritis will not be a side effect of PPi treatment. An inflammatory reaction was present in the peritoneum, indicating that this dose and frequency of PPi is not feasible for long-term intraperitoneal delivery.
Our initial studies were hampered by the variability of vascular calcification in the adenine, high-phosphate diet model, often with <50% of rats developing any calcification. This has also been observed by other investigators, and the mechanism responsible for this variability is unknown.12,16 Lowering the protein content of the diet, which eliminated this variability in a previous study,12 was not effective in this study, but treatment with calcitriol resulted in aortic calcification in all animals and increased the overall degree of calcification. This effect of calcitriol on uremic calcification has been observed in other studies and with other models,17–19 but usually with higher doses We also found that treatment of normal rats on a high-phosphate diet with a 2.5-fold higher dose of calcitriol did not increase aortic calcium content, indicating that calcitriol was acting synergistically with the renal failure.
This study indicates that PPi may be a useful therapy for uremic vascular calcification. Inhibition of calcification was achieved with only small, transient daily increases in plasma PPi that did not produce any adverse effects on bone. Additional studies will be required to determine the optimal dosing and route of administration and whether PPi can reverse existing vascular calcification.
MATERIALS AND METHODS
Plasma PPi kinetics
Male rats (230–400 g) were anesthetized with isoflurane for the duration of these studies. Polyethylene tubing was placed in the carotid artery and kept patent with heparinized saline. After injection of 32PPi, 200 μl samples of blood were drawn into heparized tubes and centrifuged to collect plasma. Plasma was combined with an equal volume of 10% trichloroacetic acid and centrifuged again. Orthophosphate was extracted as previously described10 using 1 volume of supernatant, 10 volumes of 30 mmol/l ammonium molybdate in 0.75 M sulfuric acid, and 20 volumes of isobutanol/petroleum ether (4:1). Radioactivity in the organic phase was counted and radioactivity remaining in the aqueous phase was assumed to be PPi. The change in plasma PPi concentration was calculated from the specific activity of the injected PPi. In some experiments, unlabeled PPi was injected and PPi was assayed directly in the plasma.
Aortic calcification in uremic rats
Chronic renal failure was produced by feeding adenine to rats.20,21 Male Sprague-Dawley rats were obtained from Charles River Laboratories (Wilmington, MA) and fed a standard rodent diet until body weight exceeded 300 g. Rats were then fed a 2.5% protein diet (Harlan Teklad, Madison, WI), which enhances vascular calcification,12 supplemented with neutral sodium phosphate. This diet contained 1.06% phosphorus and 0.92% calcium. The adenine content was 0.75% and was reduced to 0.5% for rats that had a rapid rate of weight loss. This occurred after 10 days in half the rats in the control group and all the rats in the 80 μmol/kg group in the studies shown in Figure 2, and after 21 days in 3 rats each in the control group and the 32 μmol/kg group in the studies in Figure 4. For some experiments, calcitriol (Calcitriol Injection, American Regent Shirley, NY) was given subcutaneously at a dose of 40 ng/kg every Monday, Wednesday, and Friday, concomitant with the adenine diet. Calcein (2 mg in 2 ml Hank’s solution) was injected intraperitoneally on days 20 and 25 to label bone. Rats were killed after 28 days and aortas were perfused with saline, harvested, and cleaned. All protocols were approved by the Institutional Animal Care and Use Committee.
Intraperitoneal PPi therapy
In initial studies, sodium PPi was injected daily in 5 ml/kg of a buffered saline solution and was started simultaneously with the adenine diet. Larger volumes were used in subsequent studies and required peritoneal catheters. Three days before beginning adenine treatment, peritoneal catheters were placed through a midline abdominal incision and tunneled subcutaneously to a subcutaneous port implanted behind the neck (Clearport; Access Technologies, Skokie, IL). Sodium PPi in a sterile, glucose-containing, buffered saline solution was injected daily through the skin into the subcutaneous port in a volume of 40 ml/kg, starting on day 8 of the adenine diet. Control rats received the same solution without PPi.
Biochemical assays
After drying and weighing, the entire aortas were extracted overnight in 1 M HCl, and calcium in the extract was measured colorimetrically by the cresolphthalein method.22 Plasma urea was measured colorimetrically by the urease–glutamate dehydrogenase method (Sigma-Aldrich, St Louis, MO), plasma phosphate was measured colorimetrically by the molybdate method,23 and plasma calcium was measured by the cresolpthalein method.22 Plasma PPi was measured enzymatically as previously described,8 with modifications. Plasma was diluted 1:4 with PPi-free water, and 20 μl samples were incubated with 100 μl of assay solution containing 4 μM uridine diphosphoglucose (UDPG), tracer UDP[14C]glucose, 0.3 units/ml UDPG pyrophorylase (type X from baker’s yeast), 2 units/ml phosphoglucomutase (from rabbit muscle), 0.5 units/ml glucose-6-phosphate dehydrogenase (type XV from baker’s yeast), and 10 μM NADP in a buffer of 90 mmol/l KCl, 5 mmol/l MgCl, and 70 mmol/l Tris, pH 7.6. After 30 min at 37 °C, the unreacted UDP[14C]glucose was removed by charcoal precipitation and radioactivity in the supernatant was counted. The concentration of PPi was calculated from the difference between assays performed with and without UDPG pyrophosphorylase. PPi-free water and buffer were prepared by elution through a column of hydroxyapatite.
Bone histomorphometry
After killing, one femur was removed, cleaned of attached tissue, and placed in absolute ethanol. After dehydration, samples were embedded in methylmethacrylate and eight sections were cut serially at 4-μm thickness with a heavy-duty microtome. This thickness allows analysis of the same histological features in slides prepared for light and fluorescent microscopy. Every other section was stained with the modified Masson-Goldner trichrome technique while the other sections were reserved for fluorescence microscopy. Static and dynamic parameters of bone structure, formation, and resorption were measured at a standardized site below the growth plate using a semiautomatic method.24,25
Reagents
32PPi was obtained from Perkin Elmer-NEN (Waltham, MA). Unless otherwise indicated, all other reagents were obtained from Sigma-Aldrich.
Statistics
Differences between control and treatment groups were determined by one-way analysis of variance or Mann–Whitney U-test for nonparametric data, with correction for multiple comparisons. Comparison of the incidence of calcification was by χ2 testing.
Acknowledgments
The authors thank Faten Hassounah for her expert technical assistance.
Footnotes
DISCLOSURE
Drs O’Neill and Lomashvili are coinventors of a pending patent owned by Emory University related to these studies. Dr Riser is an emplyee of Baxter Healthcare. All the other authors declared no competing interests.
References
- 1.Russell RGG, Bisaz S, Fleisch H. Pyrophosphate and diphosphates in calcium metabolism and their possible role in renal failure. Arch Intern Med. 1969;124:571–575. [PubMed] [Google Scholar]
- 2.Meyer JL. Can biological calcification occur in the presence of pyrophosphate? Arch Biochem Biophys. 1984;231:1–8. doi: 10.1016/0003-9861(84)90356-4. [DOI] [PubMed] [Google Scholar]
- 3.Francis MD, Russell RGG, Fleisch H. Diphosphonates inhibit formation of calcium phosphate crystals in vitro and pathologic calcification in vivo. Science. 1969;165:1264–1266. doi: 10.1126/science.165.3899.1264. [DOI] [PubMed] [Google Scholar]
- 4.Lomashvili KA, Cobbs S, Hennigar RA, et al. Phosphate-induced vascular calcification: role of pyrophosphate and osteopontin. J Am Soc Nephrol. 2004;15:1392–1401. doi: 10.1097/01.asn.0000128955.83129.9c. [DOI] [PubMed] [Google Scholar]
- 5.Terkeltaub RA. Inorganic pyrophosphate generation and disposition in pathology. Am J Physiol Cell Physiol. 2001;281:C1–C11. doi: 10.1152/ajpcell.2001.281.1.C1. [DOI] [PubMed] [Google Scholar]
- 6.Rutsch F, Vaingankar S, Johnson K, et al. PC-1 nucleotide triphosphate pyrophosphohydrolase deficiency in idiopathic infantile arterial calcification. Am J Pathol. 2001;158:543–554. doi: 10.1016/S0002-9440(10)63996-X. [DOI] [PMC free article] [PubMed] [Google Scholar]
- 7.Goding JW, Terkeltaub RA, Maurice M, et al. Ecto-phosphodiesterase/pyrophosphatase of lymphocytes and non-lymphoid cells: structure and function of the PC-1 family. Immunol Rev. 1998;161:11–26. doi: 10.1111/j.1600-065x.1998.tb01568.x. [DOI] [PubMed] [Google Scholar]
- 8.Lomashvili KA, Khawandi W, O’Neill WC. Reduced plasma pyrophosphate levels in hemodialysis patients. J Am Soc Nephrol. 2005;16:2495–2500. doi: 10.1681/ASN.2004080694. [DOI] [PubMed] [Google Scholar]
- 9.O’Neill WC, Sigrist MK, McIntyre CW. Plasma pyrophosphate and vascular calcification in chronic kidney disease. Nephrol Dial Transplant. 2010;25:187–191. doi: 10.1093/ndt/gfp362. [DOI] [PMC free article] [PubMed] [Google Scholar]
- 10.Lomashvili KA, Garg P, Narisawa S, et al. Upregulation of alkaline phosphatase and pyrophosphate hydrolysis; potential mechanism for uremic vascular calcification. Kidney Int. 2008;73:1024–1030. doi: 10.1038/ki.2008.26. [DOI] [PMC free article] [PubMed] [Google Scholar]
- 11.Schibler D, Russell GG, Fleisch H. Inhibition by pyrophosphate and polyphosphate of aortic calcification induced by vitamin D3 in rats. Clin Sci. 1968;35:363–372. [PubMed] [Google Scholar]
- 12.Price PA, Roublick AM, Williamson MK. Artery calcification in uremic rats is increased by a low protein diet and prevented by treatment with ibandronate. Kidney Int. 2006;70:1577–1583. doi: 10.1038/sj.ki.5001841. [DOI] [PubMed] [Google Scholar]
- 13.Lomashvili KA, Monier-Faugere M-C, Wang X, et al. Effect of bisphosphonates on vascular calcification and bone metabolism in experimental renal failure. Kidney Int. 2009;75:617–625. doi: 10.1038/ki.2008.646. [DOI] [PMC free article] [PubMed] [Google Scholar]
- 14.Murshed M, Harmey D, Millan JL, et al. Unique coexpression in osteoblasts of broadly expressed genes accounts for the spatial restriction of ECM mineralization to bone. Genes Dev. 2005;19:1093–1104. doi: 10.1101/gad.1276205. [DOI] [PMC free article] [PubMed] [Google Scholar]
- 15.Fedde KN, Blair L, Silverstein J, et al. Alkaline phosphatase knock_out mice recapitulate the metabolic and skeletal defects of infantile hypophosphatasia. J Bone Miner Res. 1999;14:2015–2026. doi: 10.1359/jbmr.1999.14.12.2015. [DOI] [PMC free article] [PubMed] [Google Scholar]
- 16.Neven E, Dauwe S, De Broe ME, et al. Endochondral bone formation is involved in media calcification in rats and in men. Kidney Int. 2007;72:574–581. doi: 10.1038/sj.ki.5002353. [DOI] [PubMed] [Google Scholar]
- 17.Henley C, Colloton M, Cattley RC, et al. 1,25-Dihydroxyvitamin D3 but not cinacalcet HCl (Sensipar/Mimpara) treatment mediates aortic calcification in a rat model of secondary hyperparathyroidism. Nephrol Dial Transplant. 2005;20:1370–1377. doi: 10.1093/ndt/gfh834. [DOI] [PubMed] [Google Scholar]
- 18.Mizobuchi M, Finch JL, Martin DR, et al. Differential effects of vitamin D receptor activators on vascular calcification in uremic rats. Kidney Int. 2007;72:709–715. doi: 10.1038/sj.ki.5002406. [DOI] [PubMed] [Google Scholar]
- 19.Cardus A, Panizo S, Parisi E, et al. Differential effects of vitamin D analogs on vascular calcification. J Bone Miner Res. 2007;22:860–866. doi: 10.1359/jbmr.070305. [DOI] [PubMed] [Google Scholar]
- 20.Yokozawa T, Zheng PD, Oura H, et al. Animal model of adenine-induced chronic renal failure in rats. Nephron. 1986;44:230–234. doi: 10.1159/000183992. [DOI] [PubMed] [Google Scholar]
- 21.Okada H, Kaneko Y, Yawata T, et al. Reversibility of adenine-induced renal failure in rats. Clin Exper Nephrol. 1999;3:82–88. [Google Scholar]
- 22.Moorehead WR, Biggs HG. 2-amino-2-methyl-1-propanol as the alkalizing agent in an improved continuous-flow cresolphthalein complexone procedure for calcium in serum. Clin Chem. 1974;20:1458–1460. [PubMed] [Google Scholar]
- 23.Cogan EB, Birrell GB, Griffith OH. A robotics-based automated assay for inorganic and organic phosphates. Anal Biochem. 1999;271:29–35. doi: 10.1006/abio.1999.4100. [DOI] [PubMed] [Google Scholar]
- 24.Malluche HH, Sherman D, Meyer W, et al. A new semiautomatic method for quantitative static and dynamic bone histology. Calcif Tissue Int. 1982;34:439–448. doi: 10.1007/BF02411282. [DOI] [PubMed] [Google Scholar]
- 25.Manaka RC, Malluche HH. A program package for quantitative analysis of histologic structure and remodeling dynamics of bone. Comput Programs Biomed. 1981;13:191–202. doi: 10.1016/0010-468x(81)90098-2. [DOI] [PubMed] [Google Scholar]


