Abstract
A method for the quantitative estimation of instability with respect to deamidation of the asparaginyl (Asn) residues in proteins is described. The procedure involves the observation of several simple aspects of the three-dimensional environment of each Asn residue in the protein and a calculation that includes these observations, the primary amino acid residue sequence, and the previously reported complete set of sequence-dependent rates of deamidation for Asn pentapeptides. This method is demonstrated and evaluated for 23 proteins in which 31 unstable and 167 stable Asn residues have been reported and for 7 unstable and 63 stable Asn residues that have been reported in 61 human hemoglobin variants. The relative importance of primary structure and three-dimensional structure in Asn deamidation is estimated.
Keywords: biological clocks, proteins
The spontaneous deamidation of glutaminyl and asparaginyl residues causes experimentally and biologically important changes in peptide and protein structures. In asparaginyl deamidation, the primary reaction products are aspartyl and isoaspartyl. Early work on peptide and protein deamidation (1–10) established that deamidation occurs in vitro and in vivo and depends on primary sequence, three-dimensional (3D) structure, pH, temperature, ionic strength, buffer ions, and other solution properties.
It was hypothesized (3, 5, 7) and then experimentally demonstrated (2, 8, 9, 11) that deamidation can serve as a biologically relevant molecular clock that regulates the timing of in vivo processes. Substantial evidence supports the hypothesis that Asn deamidation at neutral pH proceeds through a cyclic imide reaction mechanism (12–14).
A procedure is needed whereby the stability of individual amides in peptides and proteins can be reliably estimated. Although it was evident to investigators 30 years ago (2–7) that protein deamidation rates depend on primary, secondary, tertiary, and quaternary protein structure, and numerous examples have been found, it was not possible to devise a useful deamidation prediction procedure until a complete library of deamidation rates as a function of primary sequence was available.
A suitable library of sequence-determined Asn rates has now been published (15), and the relevance of this library has been established (16). These rates can now be combined with 3D data to provide a useful deamidation prediction procedure. Each amide residue has an intrinsic sequence-determined deamidation rate, which depends on charge distribution, steric factors, and other aspects of peptide chemistry. This primary rate is modulated by 3D structure, which usually slows the rate. In a few instances, it increases the deamidation rate.
We have devised a simple procedure that is useful for predicting the relative deamidation rates of most protein Asn residues. We have tested this procedure on a complete set of all proteins for which, during a review of the literature, we found experiments specifically identifying one or more labile Asn residues in a protein and also a suitable 3D structure for that same protein. Although our procedure assumes that deamidation proceeds through a cyclic five-membered imide formed by reaction of the Asn amide side chain with the nearest carboxyl-side peptide bond nitrogen, it would likely give good results even if the actual mechanism were different.
When sequence-dependent rates of deamidation first became available (3–10), it was found that most protein deamidation rates were slower than those of corresponding model peptides, except in protein amides located in especially flexible regions such as those that initiate the in vivo turnover of cytochrome C (2, 8) and aldolase (9, 11). Deamidation suppression of Asn in α-helices has been demonstrated (15–17), and it is evident that Asn deamidation generally depends on 3D freedom in the peptide chain.
We have limited this Asn deamidation prediction procedure to 3D observations that can easily be made with an ordinary personal-computer-based 3D protein structure viewer and 1–2 hours of work per protein without special computer programs or other aids. Subtle or complicated 3D effects have, therefore, been omitted. Although it is to be expected that sophisticated computerized procedures for this purpose will eventually be devised, there are not yet sufficient experimental data with which to calibrate such procedures.
Materials and Methods
Selection of Proteins.
All reports of Asn deamidation in proteins wherein investigators identified the specific deamidating Asn residue were gathered from the Medline and Citation Index databases. The Brookhaven Protein Data Bank (http://www.rcsb.org/pdb) was then searched for a 3D structure that was identical in protein biological type and primary sequence to each protein in which deamidation had been reported. Every protein for which we found a suitable deamidation report and a corresponding 3D structure is included herein. None have been omitted.
In addition, 44 human hemoglobin mutations that convert another residue into Asn and 16 mutations that change the residue on the carboxyl side of one of the 10 wild-type Asn residues have been reported. This set of 70 Asn residues, of which 7 have been reported to deamidate, is included.
The selected proteins and their Brookhaven Protein Data Bank identification numbers are: rabbit aldolase 1ADO (11, 18), human angiogenin 1B1I (19, 20), bovine calbindin 4ICB (21, 22), pig cAMP-dependent protein kinase 1CDK (23, 24), horse cytochrome C 2GIW (NMR) (25, 26), mouse epidermal growth factor 1EGF (NMR) (27, 28), rat fatty acid-binding protein 1LFO (29, 30), human fibroblast growth factor 2AFG (31, 32), Aspergillus awamorii glucoamylase 3GLY (33, 34), human growth hormone 1HGU (35, 36), human hemoglobin 1A3N (37–44, 45), Escherichia coli Hpr-phosphocarrier protein 1HDN (NMR) (46, 47), human hypoxanthine guanine phosphoribosyl transferase 1BZY (48, 49), human insulin 2HIU (NMR) (50, 51), mouse interleukin 1β 2MIB (52, 53), human interleukin 2 3INK (54, 55), chicken lysozyme 1E8L (NMR) (56, 57), bovine ribonuclease A 1AFK (58, 59), Ustilago sphaerogena ribonuclease U2 1RTU (60, 61), bovine seminal ribonuclease 11BG (62, 63), human T cell surface protein CD4 1CDJ (64, 65), human thioltransferase 1JHB (NMR) (66, 67), human triosephosphate isomerase 1HTI (68, 69), and bovine trypsin 1MTW (70, 71).
Trypsin is included, but the reported (70) relative Asn instabilities are unsuitable. Trypsin was incubated in solution for 1 year while the solution was differentiated through crystal growth into a homogenous fraction that exhibited deamidation at three positions. No deamidation measurements on an undifferentiated solution were reported.
Selection of 3D Parameters.
A set of observations of the 3D environment of each Asn was selected. This set included positions with respect to α-helical or β-sheet regions, hydrogen bonds to the Asn, other hydrogen bonds inhibiting formation of a succinimide intermediate, and relative freedom of the Asn peptide backbone. These observations were made and tabulated by one of us (N.E.R.) before any calculations were carried out. The tabulated observations were not changed after calculations began. The observations were made with swiss protein data bank viewer software, StereoGraphics ENT B and CE-3 viewer hardware (StereoGraphics Corp., San Rafael, CA) and a Pentium III computer with microsoft nt 4.0.
The deamidation coefficient, CD, is
defined as CD = (0.01)
(t1/2)( ),
where t1/2 is the pentapeptide primary
structure half life (15), Cm is a
structure proportionality factor, CSn is the 3D
structure coefficient for the nth structure observation,
Sn is that observation, and
f(Cm,
CSn, Sn) =
Cm[(CS1)(S1) +
(CS2)(S2) +
(CS3)(S3) −
(CS4,5)(S4)/(S5) +
(CS6)(S6) +
(CS7)(S7) +
(CS8)(S8) +
(CS9)(S9) +
(CS10)(1 − S10) +
(CS11)(5 − S11) +
(CS12)(5 − S12)]. The
structure observations, Sn, were selected
as those most likely to impede deamidations, including hydrogen bonds,
α helices, β sheets, and peptide inflexibilities. The functional
form of CD assumes that each of these
structural factors is added to the reaction activation energy.
The observed Sn were:
For Asn in an α-helical region:
S1 = distance in residues inside the α helix from the NH2 end, where S1 = 1 designates the end residue in the helix, 2 is the second residue, and 3 is the third. If the position is 4 or greater, S1 = 0.
S2 = distance in residues inside the α helix from the COOH end, where S1 = 1 designates the end residue in the helix, 2 is the second residue, and 3 is the third. If the position is 4 or greater or S1 ≠ 0, then S2 = 0.
S3 = 1 if Asn is designated as completely inside the α helix, because it is 4 or more residues from both ends. If the Asn is completely inside, S3 = 1, S1 = 0, and S2 = 0. If S1 ≠ 0 or S2 ≠ 0, then S3 = 0.
For flexibility of a loop including Asn between two adjacent antiparallel β sheets:
S4 = number of residues in the loop.
S5 = number of hydrogen bonds in the loop. S5 ≥ 1 by definition.
For hydrogen bonds:
S6 = the number of hydrogen bonds to the Asn side chain C⩵O group. Acceptable values are 0, 1, and 2.
S7 = the number of hydrogen bonds to the Asn side chain NH2 group. Acceptable values are 0, 1, and 2.
S8 = the number of hydrogen bonds to the backbone N in the peptide bond on the COOH side of Asn. Hydrogen bonds counted in S6 or S7 are not included. Acceptable values are 0 and 1. This nitrogen is used in the five-membered succinimide ring.
S9 = additional hydrogen bonds, not included in S6, S7, and S8, that would need to be broken to form the succinimide ring.
For Asn situated so that no α-helix, β-sheet, or disulfide bridge structure is between the Asn and the end of the peptide chain:
S10 = 1 if the number of residues between the Asn and the nearest such structure is 3 or more. If the number of intervening residues is 2, 1, or 0, or Asn not between structure and chain end, then S10 = 0.
If the Asn lies near to any α-helix, β-sheet, or disulfide bridge structures:
S11 = the number of residues between the Asn and the structure on the NH2 side, up to a maximum of 5. Values of 0, 1, 2, 3, 4, and 5 are acceptable.
S12 = the number of residues between the Asn and the structure on the COOH side, up to a maximum of 5. Values of 0, 1, 2, 3, 4, and 5 are acceptable.
Hydrogen bonds selected by the Swiss Protein Data Bank (PDB) viewer were accepted if the bond length was 3.3 Å or less, and there was room in the structure to accommodate the van der Waals radius of the hydrogen. The Swiss PDB viewer, according to the customary criteria, selected α helices and β sheets. All primary structure t1/2 values were those published (15), except for Asn with carboxyl-side Pro, Asn, or Gln and N-glycosylated Asn. We used estimated values of t1/2 of 500, 40, 60, and 500 days for Asn-Pro, Asn-Asn, Asn-Gln, and N-glycosylated Asn, respectively.
Optimization of the Coefficient of Deamidation.
CD values were optimized (72, 73) by using various values for Cm and CSn to maximize the value of the deamidation resolving power, DP. The optimized values were Cm = 0.48, CS1 = 1.0, CS2 = 2.5, CS3 = 10.0, CS4,5 = 0.5, CS6 = 1.0, CS7 = 1.0, CS8 = 3.0, CS9 = 2.0, CS10 = 2.0, CS11 = 0.2, and CS12 = 0.7.
For example, the β-Lys-Asn 145-His sequence of hemoglobin is not in an α helix or in a loop between two β sheets, so S1 through S4 = 0, S5 = 1. There is one hydrogen bond to the amide side chain nitrogen and one other to be broken to form the imide, but there are none to the amide carboxyl or the backbone nitrogen, so S6 = 0, S7 = 1, S8 = 0, and S9 = 1. This Asn is near the carboxyl end of the chain and one residue from an α-helix on the amino side, so S10 = 0, S11 = 1, and S12 = 5. The Gly-Lys-Asn-His-Gly half life (15) is 10.5 days. Therefore, CD = (0.01)(10.5)e(0.48)[(1)(1)+(2)(1)+(2)(1–0)+(0.2)(4)] = (0.105)e(0.48)(5.8) = (0.105)(16.184) = 1.70.
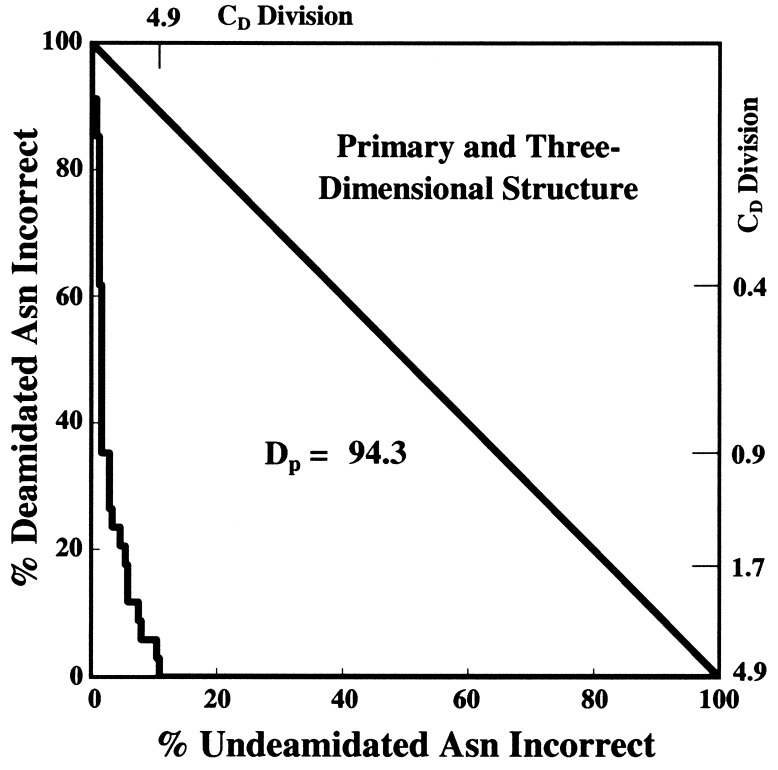
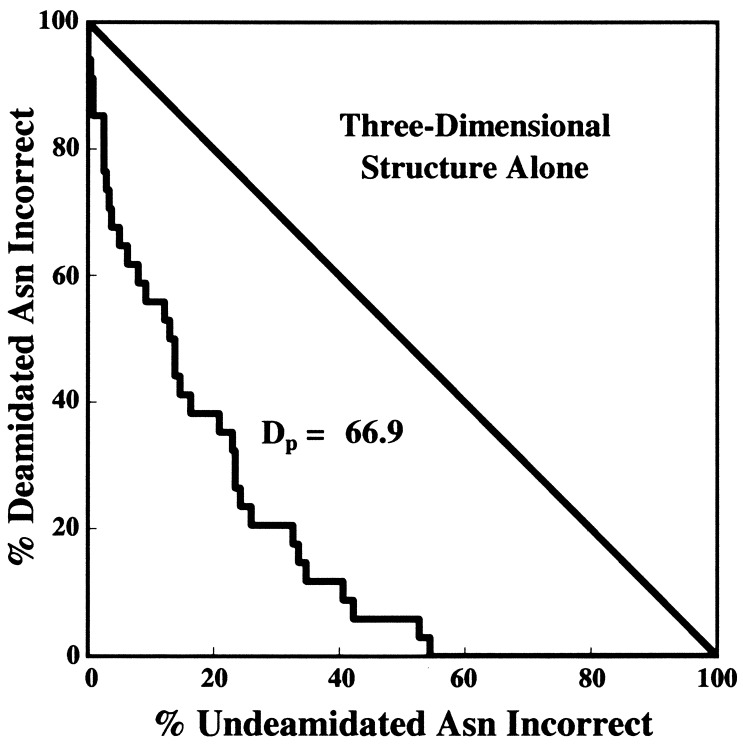
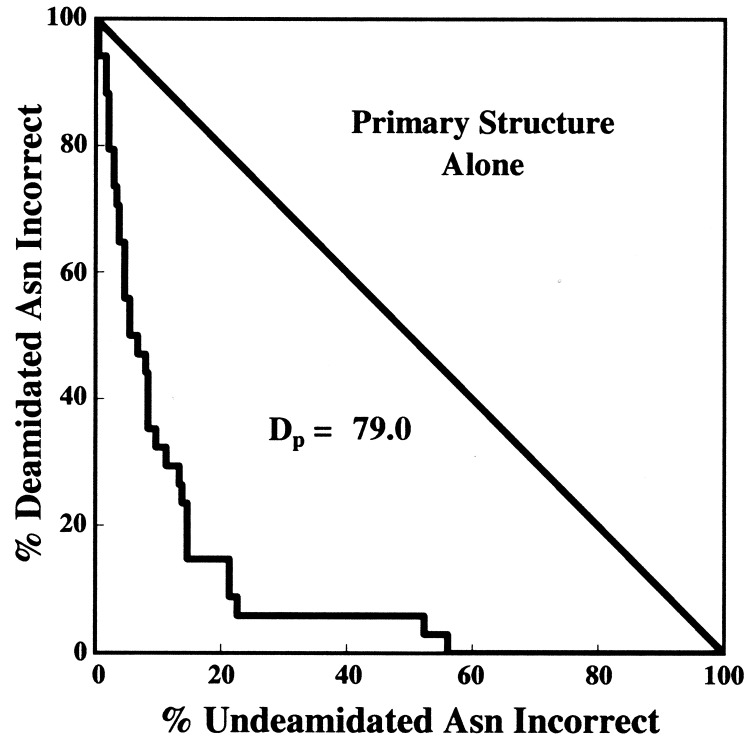
The DP calculation method as developed previously for the evaluation of quantitative procedures in diagnostic medicine (72, 73) was used as illustrated in Figs. 1–3. A total of 264 Asn residues listed in Tables 1 and 2 were arranged in order of calculated CD values and then divided into all possible two group sets arising from division at all possible CD values. The errors at these division points for the optimized parameters are graphed in Fig. 1. Figs. 2 and 3 show graphs for primary structure and 3D structure alone. If the classification of Asn stabilities were perfect, then the graphs in Figs. 1–3 would be straight lines along the axes, appearing as points in the origin. If there were no correlation between the calculations and the experimental data, the graphs would be along the diagonal lines. DP is defined as the percentage of the area between the diagonal and the origin that has been successfully removed by the deamidation estimation procedure.
Figure 1.
Classification accuracies of the Asn residues in Tables 1 and 2 with all possible CD division values used for the classification, excluding four Asn marked ‡ in Table 1 and ‡ and ‡‡ in Table 2, and calculated deamidation resolving power (DP).
Figure 3.
Tabulation and calculation as in Fig. 1, but by using only the 3D structure part of the coefficients CD. All t1/2 = 1.
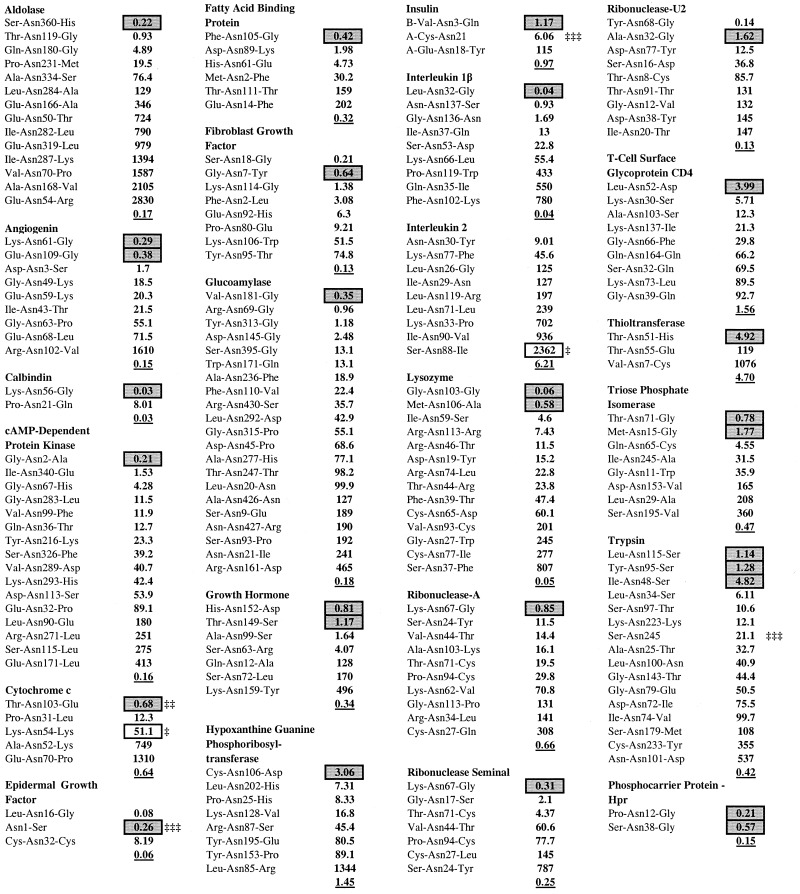
Table 1.
Ordered deamidation coefficients and experimentally determined deamidating Asn residues in 23 proteins
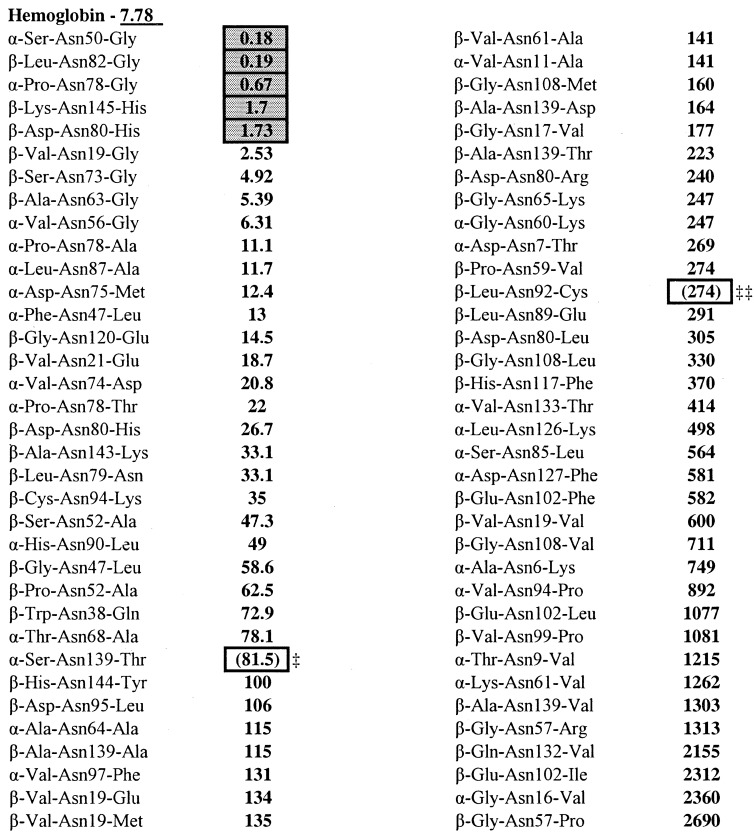
Table 2.
Ordered deamidation coefficients for 70 Asn residues in wild-type and mutant human hemoglobins and experimentally determined deamidating Asn residues
Frame-shift mutation and
heme loss mutation, so 3D structures are unknown, and CDderived from wild-type hemoglobin is not applicable. Squares designate Asn reported as deamidated. designates wild-type deamidation index, ID.
Figure 2.
Tabulation and calculation as in Fig. 1, but by using only the primary structure part of the coefficients CD. Cm = 0.
Two of the hemoglobin Asn mutations involve large undetermined structural changes in the protein, one by a frame-shift and the other causing the loss of the heme group, so suitable 3D criteria could not be tabulated. 3D effects apparently markedly accelerate deamidation of Asn 54 in cytochrome C and Asn 88 in interleukin 2. These four Asn were not used in calculating DP.
Reliability of the Coefficient of Deamidation.
In addition to DP, the Asn ranks within each protein as shown in Table 1 are especially interesting because these ranks avoid the complication that the different proteins were subjected to a wide variety of differing deamidating conditions. All 70 Asn in the hemoglobin set shown in Table 2 were incubated in vivo at 37°C for an average of 60 days in human blood.
Although the Asn residues designated as deamidating have been reported from experiments, those designated as undeamidating depend on negative results. In many cases, ammonia evolution or protein separation experiments have shown that additional unstable amides are present in these proteins. This is reflected in the asymmetry seen in Fig. 1, wherein some of the “% deamidated Asn incorrect” at low CD values are probably correctly assigned but not yet reported. We expect that some of the Asn residues listed in Tables 1 and 2 with low CD values will eventually be found to significantly deamidate.
The values of CD depend on 18 x-ray diffraction and 6 NMR structures. Although the deamidation of aldolase Asn-360 is known to be entirely sequence controlled in vivo and in vitro with no 3D suppression (9, 15, 16), the x-ray crystal structure shows one suppressing hydrogen bond. This aldolase CD is, therefore, 0.22. It should be 0.08. Solution structures are best used when available.
Multiplication of the coefficient of deamidation (CD) by 100 provides a semiquantitative prediction of Asn deamidation half times in 37°C, pH 7.4, 0.15 M Tris⋅HCl buffer, even though CD does not include all aspects of 3D structure. Table 3 lists those proteins for which experimental deamidation half times at 37°C, pH at or near 7.4, but with a wide range of buffer types and solution properties have been reported (2, 31, 39, 50, 74–78) vs. the corresponding values of (100)(CD) for those Asn. The overall differences in Table 3 are well within the range expected from variations in buffer type and other solvent conditions.
Table 3.
Deamidation half times in days at 37°C, pH 7.4 vs. estimates by (100)(CD)
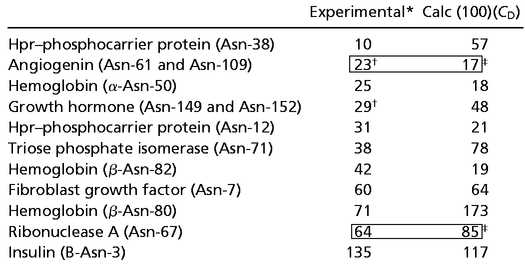 |
Buffer conditions vary. pHs at or close to 7.4.
Reported rate for sum of both Asn residues.
Buffer (Tris) identical to that of model peptides used to calculate CD.
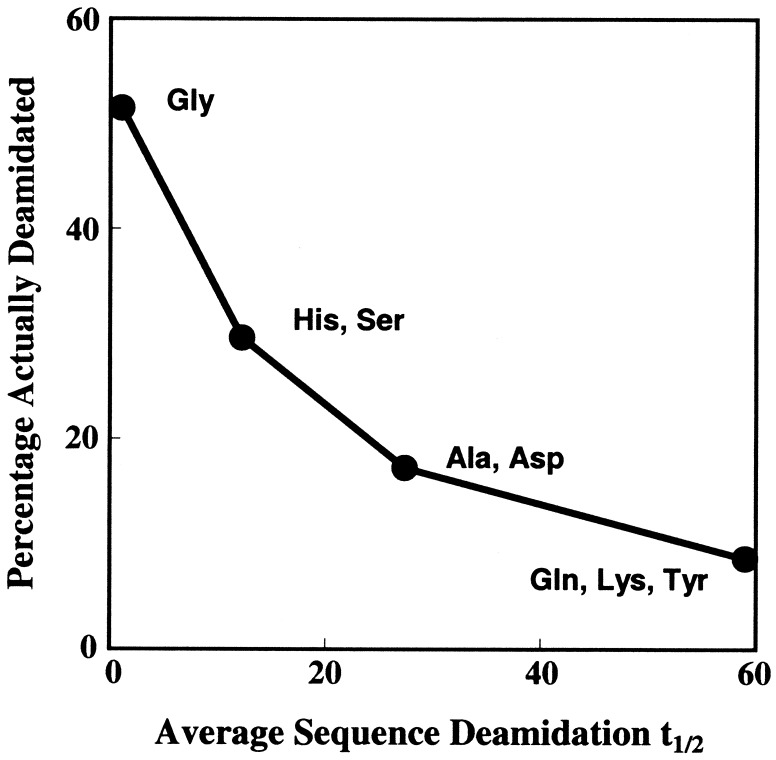
It is customary to guess which Asn residues may easily deamidate on the basis of primary structure. With the complete rate table (15) and 33 of the deamidating Asn residues in our data set, the sequence assumptions that these types of Asn residues easily deamidate are 49% in error even in the very unstable Asn-Gly sequences, 70% in the Asn-Ser and Asn-His sequences, 83% in Asn-Ala and Asn-Asp, and 91% in Asn-Gln, Asn-Lys, and Asn-Tyr. The converse nondeamidation assumptions are 51%, 30%, 17%, and 9% in error, respectively (see Fig. 4). In comparison, Fig. 1 shows that a division criterion of CD ≤ 3 leads to less than 6% error in classification of all easily deamidating and all relatively stable Asn residues, simultaneously. A criterion of CD ≤ 5 includes 100% of deamidating Asn residues, except for Asn 54 in cytochrome C and Asn 88 in interleukin 2.
Figure 4.
Percentages of deamidating Asn residues listed in Tables 1 and 2 that would be correctly guessed by simply assuming that Asn residues with COOH-side Gly, His, Ser, Ala, Asp, Gln, Lys, or Tyr deamidate vs. average pentapeptide deamidation half times (15) for those specific Asn sequences.
Deamidation Index.
The initial deamidation of a protein at neutral pH causes a unit decrease in charge. We define ID = [∑(CDn)−1]−1,where CDn is CD for the nth Asn residue, as the protein “deamidation index.” Therefore (100)(ID) is an estimate of the initial single-residue deamidation half time for the protein with all Asn residues considered, as shown in Tables 1 and 2.
Results and Discussion
This calculation method, based on the sequence-controlled deamidation rates of Asn model peptides and simple aspects of the Asn 3D environment in proteins, permits a useful estimation of the instability with respect to deamidation of Asn in proteins.
For a diverse group of protein types, this method is at least 94% reliable, as illustrated in Fig. 1. This reliability is underestimated, because the evaluation in Fig. 1 considers all of these protein amides simultaneously even though their deamidations were observed under a wide variety of experimental conditions. Moreover, some experimentally known Asn instabilities in these proteins have not yet been characterized, so the data used in Fig. 1 incorrectly classify some Asn as stable that are actually unstable.
When used to determine the reportedly most unstable Asn residues within a single protein as illustrated in Tables 1 and 2, this method correctly identifies the most unstable Asn residue for 31 of 36 residues in 24 proteins and, in 4 of the remaining 5 cases, is in error by only one residue.
This method does not allow for special 3D structures that change deamidation rates in unusual ways. There are still too few reported instances of these to permit their theoretical estimation. In two Asn sequences encountered here, Lys-Asn 54-Lys in cytochrome C and Ser-Asn 88-Ileu in interleukin 2, the reported experimentally determined protein rates are faster than the sequence determined rates. Also, in two instances, Met-Asn 15-Gly in triosephosphate isomerase (79) and Lys-Asn 54-Lys (7) in cytochrome C, deamidation takes place after a prior deamidation of the protein changes the structure in an accommodating way. Although this calculation method cannot predict these special effects, it aids in their recognition.
Finally, this procedure provides a semiquantitative answer to a previously unanswered question. What are the relative contributions to deamidation rates in proteins from primary structure and 3D structure? Figs. 1–3 serve as a reasonable basis for estimating that Asn deamidation in proteins is, on average, determined approximately 60% by primary structure and 40% by 3D structure. These percentages apply to 3D effects that diminish deamidation rates below those of primary structure alone. In 2 cases out of 36—about 6% of deamidating Asn and 1% of all Asn examined here—3D structure is reported to actually accelerate deamidation.
These calculations demonstrate that most deamidation rates of Asn residues in proteins are approximately equal to the sequence-controlled rates modulated through slowing by 3D structure. The modulated values can be estimated by a remarkably simple calculation. We are now experimentally determining a complete deamidation rate table for Gln residues in pentapeptides, which should allow a similar treatment for Gln residues in proteins. Values of ID and CD for many other proteins are available at www.deamidation.org.
Acknowledgments
We thank Prof. and Mrs. R. B. Merrifield for their advice and encouragement. We also thank the John Kinsman Foundation and other donors to the Oregon Institute of Science and Medicine for financial support.
Abbreviation
- 3D
three-dimensional
References
- 1.Flatmark T. Acta Chem Scand. 1964;18:1656–1666. [Google Scholar]
- 2.Flatmark T, Sletten K. J Biol Chem. 1968;243:1623–1629. [PubMed] [Google Scholar]
- 3.Robinson A B, McKerrow J H, Cary P. Proc Natl Acad Sci USA. 1970;66:753–757. doi: 10.1073/pnas.66.3.753. [DOI] [PMC free article] [PubMed] [Google Scholar]
- 4.Robinson A B, Scotchler J W, McKerrow J H. J Am Chem Soc. 1973;95:8156–8159. doi: 10.1021/ja00805a032. [DOI] [PubMed] [Google Scholar]
- 5.Robinson A B. Proc Natl Acad Sci USA. 1974;71:885–888. doi: 10.1073/pnas.71.3.885. [DOI] [PMC free article] [PubMed] [Google Scholar]
- 6.Scotchler J W, Robinson A B. Anal Biochem. 1974;59:319–322. doi: 10.1016/0003-2697(74)90040-2. [DOI] [PubMed] [Google Scholar]
- 7.Robinson A B, Rudd C. Curr Top Cell Regul. 1974;8:247–295. doi: 10.1016/b978-0-12-152808-9.50013-4. [DOI] [PubMed] [Google Scholar]
- 8.Robinson A B, McKerrow J H, Legaz M. Int J Pept Protein Res. 1974;6:31–35. doi: 10.1111/j.1399-3011.1974.tb02355.x. [DOI] [PubMed] [Google Scholar]
- 9.McKerrow J H, Robinson A B. Science. 1974;183:85. doi: 10.1126/science.183.4120.85. [DOI] [PubMed] [Google Scholar]
- 10.Robinson A B, Scotchler J W. Int J Pept Protein Res. 1974;6:279–282. doi: 10.1111/j.1399-3011.1974.tb02385.x. [DOI] [PubMed] [Google Scholar]
- 11.Midelfort C F, Mehler A H. Proc Natl Acad Sci USA. 1972;69:1816–1819. doi: 10.1073/pnas.69.7.1816. [DOI] [PMC free article] [PubMed] [Google Scholar]
- 12.Bornstein P, Balian G. J Biol Chem. 1970;245:4854–4856. [PubMed] [Google Scholar]
- 13.Meinwald Y C, Stimson E R, Scheraga H A. J Pept Protein Res. 1986;28:79–84. doi: 10.1111/j.1399-3011.1986.tb03231.x. [DOI] [PubMed] [Google Scholar]
- 14.Geiger T, Clarke S. J Biol Chem. 1987;262:785–794. [PubMed] [Google Scholar]
- 15.Robinson N E, Robinson A B. Proc Natl Acad Sci USA. 2001;98:944–949. doi: 10.1073/pnas.98.3.944. [DOI] [PMC free article] [PubMed] [Google Scholar]
- 16.Robinson N E, Robinson A B, Merrifield R B. J Pept Protein Res. 2001;57:1–12. [Google Scholar]
- 17.Kosky A A, Razzaq U O, Treuheit M J, Brems D N. Protein Sci. 1999;8:2519–2523. doi: 10.1110/ps.8.11.2519. [DOI] [PMC free article] [PubMed] [Google Scholar]
- 18.Blom N, Sygusch J. Nat Struct Biol. 1997;4:36–39. doi: 10.1038/nsb0197-36. [DOI] [PubMed] [Google Scholar]
- 19.Hallahan T W, Shapiro R, Strydom D J, Vallee B L. Biochemistry. 1992;31:8022–8029. doi: 10.1021/bi00149a036. [DOI] [PubMed] [Google Scholar]
- 20.Leonidas D D, Shapiro R, Allen S C, Subbarao G V, Veluraja K, Acharya K R. J Mol Biol. 1999;285:1209–1233. doi: 10.1006/jmbi.1998.2378. [DOI] [PubMed] [Google Scholar]
- 21.Chazin W J, Kordel J, Thulin E, Hofmann T, Drakenberg T, Forsen S. Biochemistry. 1989;28:8646–8653. doi: 10.1021/bi00447a055. [DOI] [PubMed] [Google Scholar]
- 22.Svensson L A, Thulin E, Forsen S. J Mol Biol. 1992;223:601–606. doi: 10.1016/0022-2836(92)90976-q. [DOI] [PubMed] [Google Scholar]
- 23.Jedrzejewski P T, Girod A, Tholey A, Konig N, Thullner S, Kinzel V, Bossemeyer D. Protein Sci. 1998;2:457–469. doi: 10.1002/pro.5560070227. [DOI] [PMC free article] [PubMed] [Google Scholar]
- 24.Bossemeyer D, Engh R A, Kinzel V, Ponstingl H, Huber R. EMBO J. 1993;12:849–859. doi: 10.1002/j.1460-2075.1993.tb05725.x. [DOI] [PMC free article] [PubMed] [Google Scholar]
- 25.Flatmark T. Acta Chem Scand. 1966;20:1487–1496. doi: 10.3891/acta.chem.scand.20-1487. [DOI] [PubMed] [Google Scholar]
- 26.Banci L, Bertini I, Huber J G, Spyroulias G A, Turano P. J Biol Inorg Chem. 1999;4:21–33. doi: 10.1007/s007750050285. [DOI] [PubMed] [Google Scholar]
- 27.DiAugustine R P, Gibson B W, Aberth W, Kelly M, Ferrua C M, Tomooka Y, Brown C F, Walker M. Anal Biochem. 1987;165:420–429. doi: 10.1016/0003-2697(87)90291-0. [DOI] [PubMed] [Google Scholar]
- 28.Montelione G T, Wuthrich K, Burgess A W, Nice E C, Wagner G, Gibson K D, Scheraga H A. Biochemistry. 1992;31:236–249. doi: 10.1021/bi00116a033. [DOI] [PubMed] [Google Scholar]
- 29.Odani S, Okazaki Y, Kato C, Uchiumi T, Takahashi Y. Arch Biochem Biophys. 1993;309:81–84. doi: 10.1006/abbi.1994.1088. [DOI] [PubMed] [Google Scholar]
- 30.Thompson J, Winter N, Terwey D, Bratt J, Banaszak L. J Biol Chem. 1997;272:7140–7150. doi: 10.1074/jbc.272.11.7140. [DOI] [PubMed] [Google Scholar]
- 31.Volkin D B, Verticelli A M, Bruner M W, Marfia K E, Tsai P K, Sardana M K, Middaugh C R. J Pharmacol Sci. 1994;84:7–11. doi: 10.1002/jps.2600840104. [DOI] [PubMed] [Google Scholar]
- 32.Blaber M, Disalvo J, Thomas K A. Biochemistry. 1996;35:2086–2094. doi: 10.1021/bi9521755. [DOI] [PubMed] [Google Scholar]
- 33.Svensson B, Larson K, Svendsen I, Boel E. Carlsberg Res Commun. 1983;48:529–544. [Google Scholar]
- 34.Aleshin A E, Hoffman C, Firsov L M, Honzatko R B. J Mol Biol. 1994;238:575–591. doi: 10.1006/jmbi.1994.1316. [DOI] [PubMed] [Google Scholar]
- 35.Silberring J, Brostedt P, Ingvast A, Nyberg F. Rapid Commun Mass Spectrom. 1991;5:579–581. doi: 10.1002/rcm.1290051202. [DOI] [PubMed] [Google Scholar]
- 36.Chantalat L, Jones N D, Korber F, Navaza J, Pavlovsky A G. Protein Peptide Lett. 1995;2:333. [Google Scholar]
- 37.Huisman T H J, Carver M F H, Efremov G D. A Syllabus of Human Hemoglobin Variants. 2nd Ed. Augusta, GA: Univ. of Georgia; 1998. [DOI] [PubMed] [Google Scholar]
- 38.Wajeman H, Kister J, Vasseur C, Blouquit Y, Trastour J C, Cottenceau D, Galacteros F. Biochim Biophys Acta. 1992;1138:127–132. doi: 10.1016/0925-4439(92)90052-o. [DOI] [PubMed] [Google Scholar]
- 39.Paleari R, Paglietti E, Mosca A, Mortarino M, Maccioni L, Satta S, Cao A, Galanello R. Clin Chem. 1999;45:21–28. [PubMed] [Google Scholar]
- 40.Wajcman H, Vasseur C, Blouquit Y, Santo D E, Peres M J, Martins M C, Poyart C, Galacteros F. Am J Hematol. 1991;38:194–200. doi: 10.1002/ajh.2830380308. [DOI] [PubMed] [Google Scholar]
- 41.Hutt P J, Donaldson M H, Khatri J, Fairbanks V F, Hoyer J D, Thibodeau S N, Moxness M S, McMorrow L E, Green M M, Jones R T. Am J Hematol. 1996;52:305–309. doi: 10.1002/(SICI)1096-8652(199608)52:4<305::AID-AJH10>3.0.CO;2-C. [DOI] [PubMed] [Google Scholar]
- 42.Moo-Penn W F, Jue D L, Bechtel K C, Johnson M H, Schmidt R M. J Biol Chem. 1976;251:7557–7562. [PubMed] [Google Scholar]
- 43.Seid-Akhavan M, Winter W P, Abramson R K, Rucknagel D L. Proc Natl Acad Sci USA. 1976;73:882–886. doi: 10.1073/pnas.73.3.882. [DOI] [PMC free article] [PubMed] [Google Scholar]
- 44.Blackwell R Q, Boon W H, Liu C S, Weng M I. Biochim Biophys Acta. 1972;278:482–490. doi: 10.1016/0005-2795(72)90008-6. [DOI] [PubMed] [Google Scholar]
- 45.Tame J, Vallone B. Acta Crystallogr D Biol Cryst. 2000;56:805–811. doi: 10.1107/s0907444900006387. .. [DOI] [PubMed] [Google Scholar]
- 46.Sharma S, Hammen P K, Anderson J W, Leung A, Georges F, Hengstenberg W, Klevit R E, Waygood E B. J Biol Chem. 1993;268:17695–17704. [PubMed] [Google Scholar]
- 47.Van Nuland N A, Hangyi I W, van Schaik R C, Berendsen H J, van Gunsteren W F, Scheek R M, Robillard G T. J Mol Biol. 1994;237:544–559. doi: 10.1006/jmbi.1994.1254. [DOI] [PubMed] [Google Scholar]
- 48.Wilson J M, Landa L E, Kobayashi R, Kelley W N. J Biol Chem. 1982;257:14830–14834. [PubMed] [Google Scholar]
- 49.Shi W, Li C M, Tyler P C, Furneaux R H, Grubmeyer C, Schramm V L, Almo S C. Nat Struct Biol. 1999;6:588–593. doi: 10.1038/9376. [DOI] [PubMed] [Google Scholar]
- 50.Brange J, Langkjaer L, Havelund S, Volund A. Pharm Res. 1992;9:715–726. doi: 10.1023/a:1015835017916. [DOI] [PubMed] [Google Scholar]
- 51.Hua Q X, Gozani S N, Chance R E, Hoffmann J A, Frank B H, Weiss M A. Nat Struct Biol. 1995;2:129–138. doi: 10.1038/nsb0295-129. [DOI] [PubMed] [Google Scholar]
- 52.Daumy G O, Wilder C L, Merenda J M, McColl A S, Geoghegan K F, Otterness I G. FEBS Lett. 1991;278:98–102. doi: 10.1016/0014-5793(91)80093-i. [DOI] [PubMed] [Google Scholar]
- 53.Van Oostrum J, Priestle J P, Grutter M G, Schmitz A. J Struct Biol. 1991;107:189–195. doi: 10.1016/1047-8477(91)90021-n. [DOI] [PubMed] [Google Scholar]
- 54.Sasaoki K, Hiroshima T, Kusumoto S, Nishi K. Chem Pharm Bull. 1992;40:976–980. doi: 10.1248/cpb.40.976. [DOI] [PubMed] [Google Scholar]
- 55.Brandhuber B J, Boone T, Kenney W C, McKay D B. Science. 1987;238:1707–1709. doi: 10.1126/science.3500515. [DOI] [PubMed] [Google Scholar]
- 56.Kato A, Tanimoto S, Muraki Y, Kobayashi K, Kumagai I. Biosci Biotechnol Biochem. 1992;56:1424–1428. doi: 10.1271/bbb.56.1424. [DOI] [PubMed] [Google Scholar]
- 57.Schwalbe, H., Grimshaw, S. B., Spencer, A., Buck, M., Boyd, J., Dobson, C. M., Redfield, C. & Smith, L. J. (2001) Protein Sci., in press. [DOI] [PMC free article] [PubMed]
- 58.Wearne S J, Creighton T E. Proteins Struct Funct Genet. 1989;5:8–12. doi: 10.1002/prot.340050103. [DOI] [PubMed] [Google Scholar]
- 59.Leonidas D D, Shapiro R, Irons L I, Russo N, Acharya K R. Biochemistry. 1997;36:5578–5588. doi: 10.1021/bi9700330. [DOI] [PubMed] [Google Scholar]
- 60.Kanaya S, Uchida T. Biochem J. 1986;240:163–170. doi: 10.1042/bj2400163. [DOI] [PMC free article] [PubMed] [Google Scholar]
- 61.Noguchi S, Satow Y, Uchida T, Sasaki C, Matsuzaki T. Biochemistry. 1995;34:15583–15591. doi: 10.1021/bi00047a025. [DOI] [PubMed] [Google Scholar]
- 62.Di Donato A, Galletti P, D'Alessio G. Biochemistry. 1986;25:8361–8368. doi: 10.1021/bi00374a005. [DOI] [PubMed] [Google Scholar]
- 63.Vitagliano L, Adinolfi S, Sica F, Merlino A, Zagari A, Mazzarella L. J Mol Biol. 1999;293:569–577. doi: 10.1006/jmbi.1999.3158. [DOI] [PubMed] [Google Scholar]
- 64.Teshima G, Porter J, Yim K, Ling V, Guzzetta A. Biochemistry. 1990;30:3916–3922. doi: 10.1021/bi00230a016. [DOI] [PubMed] [Google Scholar]
- 65.Wu H, Myszka D G, Tendian S W, Brouillette C G, Sweet R W, Chaiken I M, Hendrickson W A. Proc Natl Acad Sci USA. 1996;93:15030–15035. doi: 10.1073/pnas.93.26.15030. [DOI] [PMC free article] [PubMed] [Google Scholar]
- 66.Papov V V, Gravina S A, Mieyal J J, Biemann K. Protein Sci. 1994;3:428–434. doi: 10.1002/pro.5560030307. [DOI] [PMC free article] [PubMed] [Google Scholar]
- 67.Sun C, Berardi M J, Bushweller J H. J Mol Biol. 1998;280:687–701. doi: 10.1006/jmbi.1998.1913. [DOI] [PubMed] [Google Scholar]
- 68.Yuan P M, Talent J M, Gracy R W. Mech Ageing Dev. 1981;17:151–162. doi: 10.1016/0047-6374(81)90081-6. [DOI] [PubMed] [Google Scholar]
- 69.Mande S C, Mainfroid V, Kalk K H, Goraj K, Martial J A, Hol W G. Protein Sci. 1994;3:810–821. doi: 10.1002/pro.5560030510. [DOI] [PMC free article] [PubMed] [Google Scholar]
- 70.Kossiakoff A A. Science. 1988;240:191–194. doi: 10.1126/science.3353715. [DOI] [PubMed] [Google Scholar]
- 71.Stubbs M T, Huber R, Bode W. FEBS Lett. 1995;375:103–107. doi: 10.1016/0014-5793(95)01190-p. [DOI] [PubMed] [Google Scholar]
- 72.Robinson A B, Westall F C. J Orth Psych. 1974;3:70–79. [Google Scholar]
- 73.Robinson A B, Pauling L. Clin Chem. 1974;20:961–965. [PubMed] [Google Scholar]
- 74.Brennan T V, Anderson J W, Zongchao J, Waygood E B, Clarke S. J Biol Chem. 1994;269:24586–24595. [PubMed] [Google Scholar]
- 75.Johnson B A, Shirokawa J M, Hancock W S, Spellman M W, Basa L J, Aswad D W. J Biol Chem. 1989;264:14262–14271. [PubMed] [Google Scholar]
- 76.Yuksel K U, Gracy R W. Arch Biochem Biophys. 1986;248:452–459. doi: 10.1016/0003-9861(86)90498-4. [DOI] [PubMed] [Google Scholar]
- 77.Capasso S, Salvadori S. J Peptide Res. 1999;54:377–382. doi: 10.1034/j.1399-3011.1999.00111.x. [DOI] [PubMed] [Google Scholar]
- 78.Lewis U J, Cheever E V, Hopkins W C. Biochim Biophys Acta. 1970;214:498–508. doi: 10.1016/0005-2795(70)90310-7. [DOI] [PubMed] [Google Scholar]
- 79.Sun A, Yuksel K U, Gracy R W. Arch Biochem Biophys. 1995;322:361–368. doi: 10.1006/abbi.1995.1476. [DOI] [PubMed] [Google Scholar]


