Abstract
Biofuels from photosynthetic microalgae are quickly gaining interest as a viable carbon-neutral energy source. Typically, characterization of algal feedstock involves breaking down triacylglycerols (TAG) and other intact lipids, followed by derivatization of the fatty acids to fatty acid methyl esters prior to analysis by gas chromatography (GC). However, knowledge of the intact lipid profile could offer significant advantages for discovery stage biofuel research such as the selection of an algal strain or the optimization of growth and extraction conditions. Herein, lipid extracts from microalgae were directly analyzed by ultra-high pressure liquid chromatography–mass spectrometry (UHPLC-MS) using a benchtop Orbitrap mass spectrometer. Phospholipids, glycolipids, and TAGs were analyzed in the same chromatographic run, using a combination of accurate mass and diagnostic fragment ions for identification. Using this approach, greater than 100 unique TAGs were identified over the six algal strains studied and TAG profiles were obtained to assess their potential for biofuel applications. Under the growth conditions employed, Botryococcus braunii and Scenedesmus obliquus yielded the most comprehensive TAG profile with a high abundance of TAGs containing oleic acid.
Figure.
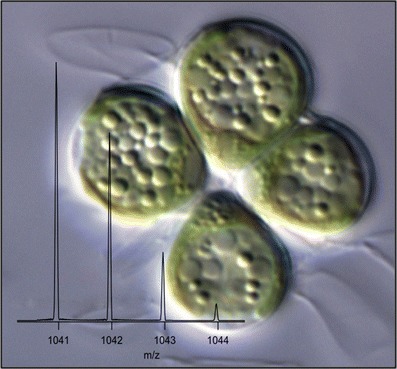
Optical microscope image of Botryococcus braunii and high resolution mass spectrum of triacylglycerol 28:2/18:1/18:1 (inset)
Electronic Supplementary Material
Supplementary material is available for this article at 10.1007/s00216-011-5376-6 and is accessible for authorized users.
Keywords: Microalgae, Biofuels, Triacylglyerols, Liquid chromatography, Mass spectrometry
Introduction
Diminishing global oil reserves and increased awareness of the environmental impact of burning fossil fuels have prompted renewed interest in the development of alternative fuel sources in recent years. The viability of microalgae as a carbon-neutral biofuel source has been well documented [1–4]. In contrast to land-based biomass, microalgae do not compete with food crops for arable land [5, 6] and can grow year-long in photobioreactors with an annual biomass productivity exceeding that of terrestrial plants [7, 8]. Additional benefits of using algae as a biofuel feedstock include possible coupling with waste-water treatment [9] and carbon dioxide sequestration [10, 11]. Despite this potential, algal biofuel production has not yet reached that of terrestrial biomass due to high production costs and energy requirements [12]. For these reasons, research has been devoted to optimizing the algae growth conditions, harvesting conditions, and lipid extraction processes [1]. As new technology is developed and oil prices continue to rise, experts believe that microalgal biofuels will become economically feasible within the next 10 to 15 years [12].
Depending on the strain of microalgae, these single-celled marine and freshwater organisms are capable of producing lipids at levels up to 20–50% of their dry cell weight under specific growth conditions [2]. These neutral lipids, mainly in the form of triacylglycerols (TAGs), can be converted to fatty acid methyl esters (FAMEs) and used as biofuel, much like lipids from terrestrial plants. In addition to TAGs, the lipid fraction of microalgae may also include chlorophylls, carotenoids, glycolipids, phospholipids, and sterols. Under optimal growth conditions, algae synthesize fatty acids for the production of membrane lipids, which include glycolipids and phospholipids. However, under stressed conditions, algae alter their biosynthetic pathways and begin to produce neutral lipids for energy storage, mainly in the form of TAGs [2, 5, 13]. Triacylglycerols are preferred over phospholipids or glycolipids for biofuel production due to their higher percentage of fatty acids and their lack of phosphorous and sulfur. Phosphate hinders the transesterification process, and it has been reported that TAGs have >99% biodiesel yield compared to <70% yield for phospholipids [14]. In addition, sulfur levels in fuels are regulated to minimize vehicle emissions. The fatty acid profile also plays an important role in determining fuel properties. Briefly, saturated fatty acids provide good oxidative stability and ignition properties, while polyunsaturated fatty acids have good cold-flow characteristics [15]. Researchers suggest that a reasonable compromise can be reached by selecting a fuel that is derived from predominantly monounsaturated fatty acids [15]. Therefore, the form of the intact lipids, in addition to the fatty acid profile, is important to establish an alga’s potential as a viable biofuel feedstock.
Conventionally, algal lipid extracts have been analyzed by gas chromatography (GC), following conversion of intact lipids to FAMEs. Detection is often carried out by flame ionization detection, where identities of FAMEs are established by comparison of retention times to known standards [16–18], or by mass spectrometry, which offers fragmentation data for fatty acid identification [16, 18, 19]. Typically, GC analysis offers excellent separation efficiency and high-sensitivity, and provides a quantitative fatty acid profile of the lipid extract. However, GC analysis of FAMEs offers no information on the nature of the intact lipids. As a result, GC analysis could be misleading if relying solely on the fatty acid profile for strain selection in biofuels applications. For instance, a favorable fatty acid profile could potentially be achieved from a lipid extract composed primarily of phospholipids, which would not be ideal for biofuel development as described above. Therefore, while GC analysis of FAMEs is perfectly suited for quality control monitoring of finished oils, it is arguably not the ideal technique for many biofuel research and development activities such as strain selection.
Liquid chromatography–mass spectrometry (LC-MS) has been successfully employed for the analysis of various lipid classes such as TAGs [20–24] and phospholipids [24–31]. For profiling complex lipid mixtures, high-resolution mass spectrometry (HRMS) is typically required and the lower cost of most modern systems had rendered HRMS suitable for high-throughput lipid applications [32–34]. In this study, lipid extracts from microalgae were directly analyzed by UHPLC-ESI-MS using a stand-alone benchtop Orbitrap mass spectrometer. Phospholipids, glycolipids, and TAGs were analyzed in the same chromatographic run, using a combination of accurate mass and diagnostic fragment ions for identification. Using this approach, comprehensive TAG profiles were obtained for six different algal strains to assess their potential for biofuel applications.
Experimental
Chemicals and reagents
Liquid chromatography solvents acetonitrile, isopropanol, and methanol were HPLC-grade or glass-distilled and purchased from Caledon (Georgetown, ON, Canada). The following triacylglycerol standards were purchased from Nu-Chek Prep (Elysian, MN, USA): trimyristin (3 × 14:0), triolein (3 × 18:1 cis-9), trilinolenin (3 × 18:3 cis-9,12,15), trieicosenoin (3 × 20:1 cis-11), and tridocosahexaenoin (3 × 22:6 cis-4,7,10,13,16,19). The following polar lipid standards were acquired from Matreya (Pleasant Gap, PA, USA): digalactosyldiacylglycerol (18:0/16:0), monogalactosyldiacylglycerol (18:0/16:0), lyso-phosphocholine (18:1), phosphoglycerol (18:1/18:1), and phosphocholine (18:1/18:1).
Algal growth conditions
Photosynthetic microalgae cultivation was conducted in 250 or 1,000 L internally illuminated Brite-Box photobioreactors [35] in batch mode at 20 °C. Seawater or lake water was sterilized by either pasteurization or tangential flow filtration. The cultures were supplemented with nutrients according to the f/2 formulation [36]. The irradiance was increased gradually from 20% at the time of inoculation to maximum intensity in mid-log phase to minimize the potential for photoinhibition. The maximum light intensity (250 μmol photons m−2 s−1) was measured in algae-free seawater with a flat quantum sensor. The following species were investigated in this study: Botryococcus braunii, Nannochloropsis gaditana, Neochloris oleoabundans, Phaeodactylum tricornutum, Porphyridium aerugineum, and Scenedesmus obliquus. The cultivated biomass was harvested as a wet paste by process centrifugation at the stationary phase of growth and lyophilized to a final moisture content of 3% (w/w). Lyophilized biomass was considered sufficiently dry for solvent assisted lipid extraction.
Lipid extraction and sample preparation
Freeze-dried biomass (homogenized with a mortar and pestle) of approximately 0.5 g was extracted using the Soxtec 2050 automated solvent extraction system (FOSS North America, Eden Prairie MN) with chloroform/methanol (2:1) at 150 °C using the following program: boiling 25 min, rinsing 40 min, solvent recovery 15 min, and pre-drying 2 min. Extracted lipids were dried at 105 °C for 1 h under nitrogen, placed in a desiccator for 1 h, and weighed to determine gravimetric lipid yield. Lipids were resolubilized in chloroform/methanol (2:1) and stored under nitrogen at −20 °C until further analysis. The extracts were then filtered using 0.22-μm Ultrafree-MC centrifugal filter devices (Amicon Bioseparations), then diluted 50-fold in 1:1 methanol/isopropanol prior to injection.
LC-MS instrumentation and conditions
LC-MS data was acquired on an Accela UHPLC system coupled to an Exactive mass spectrometer (Thermo Fisher Scientific, San Jose, CA). The Accela system consisted of a quaternary pump and autosampler, using a Thermo Hypersil Gold C8 column (100 × 2.1 mm, 1.9 μm) at 40 °C. The mobile phase consisted of A, 10 mM ammonium acetate in water (pH adjusted to 5.0 with acetic acid); B, acetonitrile; and C, isopropanol. A gradient with a flow rate of 500 μL/min was used: 30% A/70% B to 100% B from 0 to 5 min, ramped to 95% B/5% C from 5 to 6 min, 20% B/80% C from 6 to 12 min, then held at 20% B/80% C from 12 to 14.5 min. The column was then re-equilibrated back to 30% A/70% B for 5 min. Injection volume was 3.0 μL and each algal extract was analyzed in triplicate.
The Exactive mass spectrometer is a second-generation, stand-alone Orbitrap system, capable of resolution up to 100,000 (FWHM) but without the advanced scanning features offered by the linear ion trap front-end of the conventional Orbitrap mass spectrometer. The system was operated with an optional high-temperature ESI probe (HESI-II) and an “all-ion fragmentation” collision cell known as the HCD cell. In positive ion mode, the source parameters were set as follows: sheath gas, 60; auxiliary gas flow, 15; sweep gas, 0; spray voltage, 3.30 kV; capillary temperature, 380 °C; capillary voltage, 32.5 V; tube lens voltage, 85 V; skimmer voltage, 18 V; heater temperature, 350 °C. Alternating full spectrum scans and HCD scans at 50 eV were collected at 2 Hz using the “High” resolution setting (50,000 FWHM) over a mass range of 100–2,000 m/z.
Results and discussion
TAG identification strategy
Electrospray ionization (ESI) is a soft ionization technique that generates intact TAG molecular ions, typically observed as ammonium or sodium adducts depending on the chromatographic mobile phase employed. Under low-energy collision-induced dissociation (CID), TAGs fragment in a systematic fashion to produce diacylglycerol (DAG) product ions that can be used to identify TAGs through automated database searches. In our case, data were entered into a locally hosted version of the LipidMAPS database [37] that has been modified with a variety of custom fatty acids.
In order to deal with the complexity of natural lipid extracts, some form of data-dependent LC-MS/MS acquisition is typically employed, whereby the most abundant peaks in an MS survey scan are selected for MS/MS scans performed in series. However, these approaches can potentially miss low-abundance TAGs and long cycle times yield very few data points across chromatographic peaks. Therefore, our strategy involved collecting data in a completely untargeted fashion by toggling between MS scans and “all-ion fragmentation” scans offered by the Exactive mass spectrometer. The challenge of this approach is in the assignment of the correct DAG product ions to potentially co-eluting TAGs when multiple combinations are possible. However, in these rare occurrences, this can be mitigated by aligning extracted ion chromatograms of the DAG fragments with those of the intact TAGs, exploiting small shifts in retention times of nearly co-eluting TAGs.
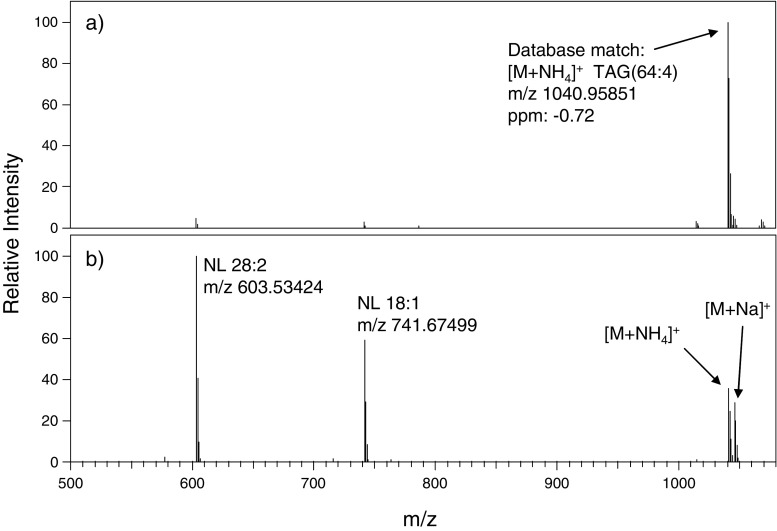
Typical data used for TAG identification are shown in Fig. 1. The MS spectrum (Fig. 1a) shows the accurate mass of an intact lipid from the algae B. braunii at retention time 11.33 min, which can be searched against a database to yield a match within 1 ppm of an ammoniated TAG with a total of 64 carbons and four double bonds in its fatty acyl chains (denoted as TAG(64:4)). Subjecting the intact TAGs to the HCD collision cell (Fig. 1b) yields diacylglycerol fragment ions, which indicate the neutral loss of a fatty acid from the glycerol backbone. This particular TAG shows a neutral loss of fatty acids 18:1 and 28:2, indicating that the TAG(64:4) identity is 28:2/18:1/18:1. Determination of the position of fatty acyl chains within each TAG was beyond the scope of this study. It should be noted that while ammonium adducts were the predominant form of intact TAG ions in the MS scan (Fig. 1a), the relative abundance of the sodium adduct is enhanced in the all-ion fragmentation scan (Fig. 1b). However, this phenomenon is simply due to the increased stability of the sodium adducts, whereas ammonium adducts require less energy for fragmentation. Limits of detection (LODs) measured for five TAG standards ranged from 11 to 19 nmol/L, corresponding to 30–56 pg injected on-column.
Fig. 1.
Typical LC-MS spectrum (a) and “all-ion fragmentation” spectrum acquired with the HCD cell (b) for TAG 28:2/18:1/18:1 at retention time 11.33 min for B. braunii. Fragment ions in (b) corresponding to neutral losses (NL) of fatty acids 28:2 and 18:1 are indicated
Liquid chromatography optimization
Liquid chromatography conditions were optimized to separate the various lipid classes found in algal extracts as much as possible, while maintaining a reasonably short run time to accommodate moderate sample throughput. Using a tertiary mobile phase system, more polar lipids were eluted first with a water/acetonitrile gradient, followed by elution of TAGs with acetonitrile/isopropanol. As shown in Fig. 2, various classes of lipids from a B. braunii extract were separated in roughly 12 min, as outlined in the three-dimensional plot of intensity as a function of retention time and mass-to-charge ratio. Triacylglycerols elute as sharp peaks between 8 and 12 min with masses ranging from roughly m/z 750 to 1,200, while more polar lipids generally eluted in the first 8 min of the chromatogram. Although not the main objective of this study, several classes of these moderately polar lipids were identified in B. braunii and the other algal strains studied, and their position in the chromatogram is illustrated in Fig. 2. Identification was carried out by matching observed masses within 2 ppm to calculated masses in the LipidMAPS database, and lipid classes were confirmed by characteristic fragment ions. For instance, phosphocholines yield a diagnostic fragment ion at m/z 184.07, and are therefore easily revealed through extracted ion chromatograms of this mass, while phosphoglycerols exhibit a neutral loss of the sodiated headgroup (193.99 Da). A variety of other polar lipids were also identified in B. braunii, including monogalactosyldiacylglycerols, digalactosyldiacylglycerols, sulfoquinovosyldiacylglycerols, 1,2-diacylglyceryl-3-O-4′-(N,N,N-trimethyl)-homoserines, and other lipophilic compounds such as chlorophylls, as indicated in Fig. 2. With the exception of phosphocholines, which eluted as broad peaks in the 9–11-min range, all of these lipid classes were well-resolved from the TAG region of the chromatogram.
Fig. 2.
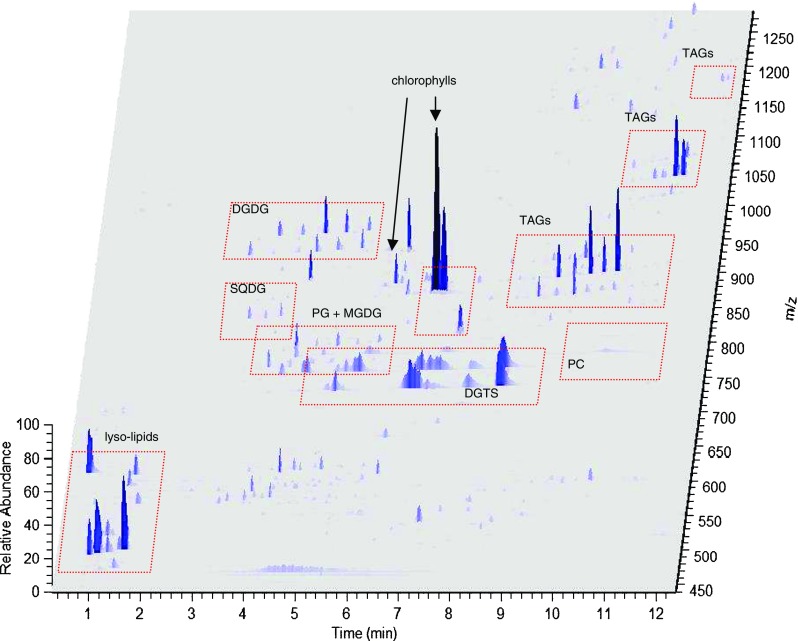
3D ion map of LC-MS chromatogram of B. braunii lipid extract. Abbreviations: PC phosphocholines, DGTS 1,2-diacylglyceryl-3-O-4′-(N,N,N-trimethyl)-homoserines, PG phosphoglycerols, MGDG monogalactosyldiacylglycerols, DGDG digalactosyldiactylglycerols, SQDG sulfoquinovosyldiacylglycerols. LC-MS conditions as described in the section “LC-MS instrumentation and conditions”
Triacylglycerol profiling of algal strains
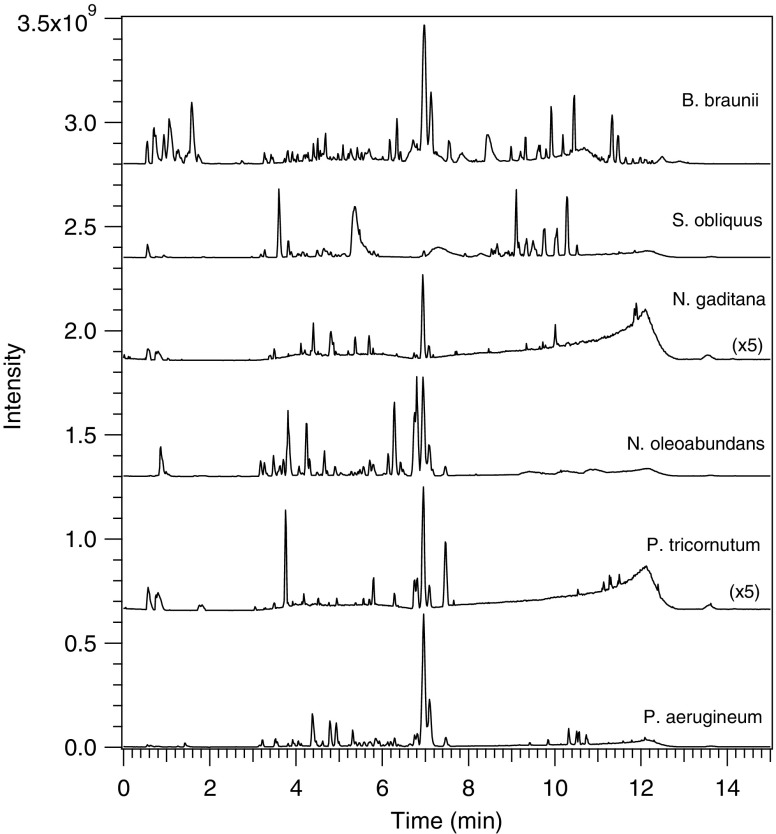
The LC-MS strategy described above was employed to profile lipids in six different algal strains that were cultured and extracted under identical conditions. As shown by the LC-MS base peak chromatograms in Fig. 3, the lipid compositions of the six strains varied significantly over the range of algal species studied. For instance, it is evident from the chromatograms that only B. braunii and S. obliquus produced significant amounts of TAGs under the growth conditions employed, as demonstrated by the relatively intense peaks in the 8–12 min range of the chromatograms. In contrast, N. oleoabundans yielded a high abundance of polar lipids in the early portion of the chromatogram, as well as broad phosphocholine peaks in the later portion of the chromatogram, but relatively small amounts of TAGs. It should be noted that due to varying degrees of ionization efficiencies for the different lipid classes, a quantitative comparison cannot be made between the different lipid classes within the same chromatogram. However, a semi-quantitative comparison can be made for the same lipid class across different algal strains.
Fig. 3.
Base peak chromatograms of lipid extracts of 6 strains of microalgae, extracted with 2:1 chloroform/methanol, in positive-mode ESI-MS. LC-MS conditions as in section “LC-MS instrumentation and conditions”
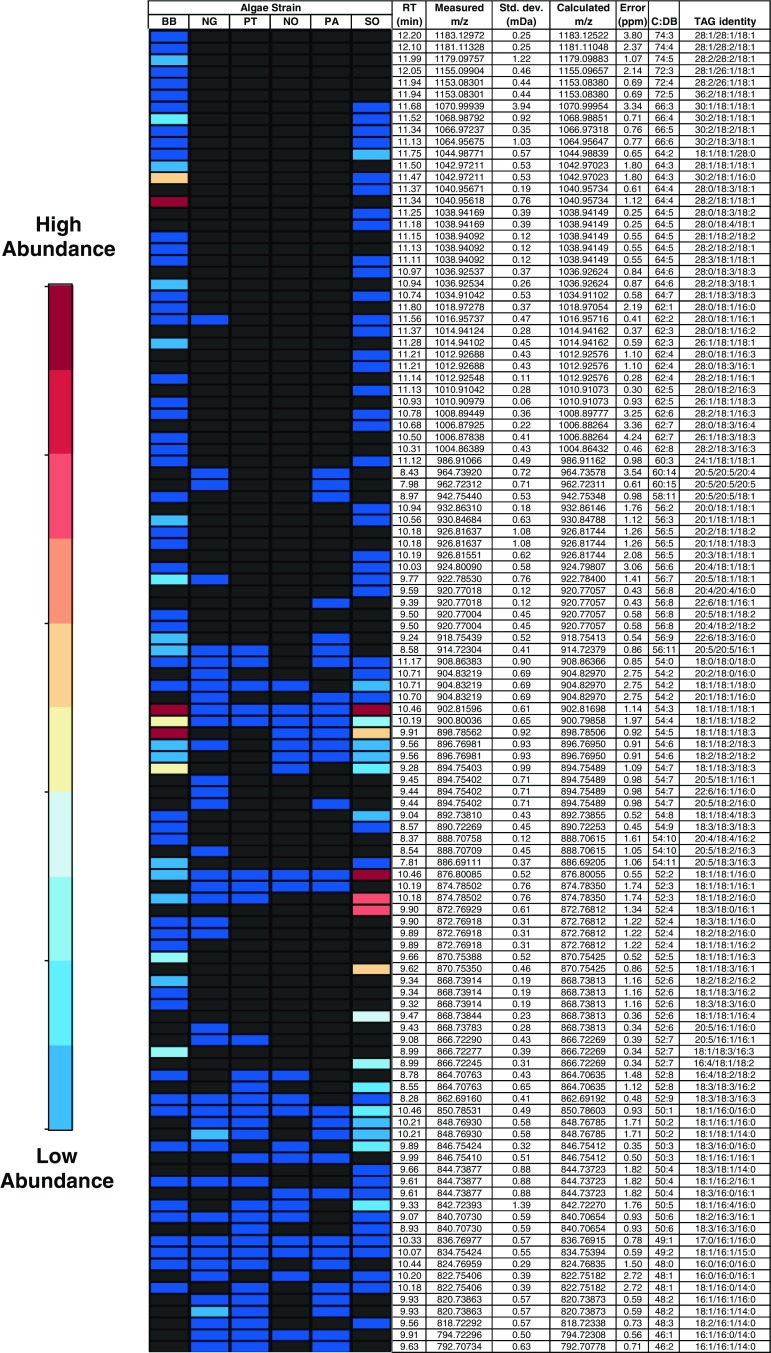
As triacylglycerols offer the most efficient source of hydrocarbons for various biofuels applications, comprehensive lipid profiles were obtained for the six strains studied to evaluate their potential for biofuels feedstock. Using the TAG identification strategy described above, over 100 unique TAGs were identified in the six algal strains studied. Relative abundances of each TAG were determined by comparing peak areas of extracted ion chromatograms averaged over triplicate injections. As response factors measured with available standards for a subset of TAGs varied by up to 50%, accurate quantification of all TAGs was not possible. Therefore, a heat map was constructed using an appropriate scale spanning nearly three orders of magnitude to highlight significant differences in TAG abundances. As shown in Fig. 4, the TAG profiles varied significantly between species, with B. braunii and S. obliquus exhibiting the broadest range of TAGs. In particular, over 70 different TAGs were identified in B. braunii, with the TAGs 18:1/18:1/18:1, 18:1/18:1/18:3, 28:1/18:1/18:1 and 28:2/18:1/18:1 being the most abundant. Other TAGs containing long-chain fatty acids such as 30:1, 30:2, and 36:2, were also detected in B. braunii. Although relatively rare, these fatty acids are known to be present at significant abundance in B. braunii [38]. Further, both B. braunii and S. obliquus also have a high abundance of TAGs containing oleic acid (18:1), which is favorable for biodiesel [15]. Also listed in Fig. 4 are retention times and accurate mass measurement data for the TAGs identified. Measured masses with standard deviations were based on averages of three replicates. Mass errors were reported as the average of the absolute values of the individual mass errors [39], to eliminate positive and negative errors canceling each other.
Fig. 4.
Heat map of TAGs identified in six algae strains. BB Botryococcus braunii, NG Nannochloropsis gaditana, PT Phaeodactylum tricornutum, NO Neochloris oleoabundans, PA Porphyridium aerugineum, SO Scenedesmus obliquus
Conclusion
An ultra-high pressure liquid chromatography–mass spectrometry method was developed for profiling lipid extracts to aid in identifying algae strains suitable for biofuels applications. The 15-min chromatographic separation allowed both polar lipids and triacylglycerols to be resolved in the same run. The method requires little sample preparation and is suitable for moderate throughput applications. Profiling intact lipids offers valuable complementary data to conventional fatty acid profiling by gas chromatography for discovery-phase biofuels research. For instance, algal culturing conditions can be optimized to specifically promote TAG production, as opposed to simply overall fatty acid content. It should be noted that the algal growth conditions employed in this study were not optimized for maximum lipid yield for each strain. The generic conditions used for all strains were chosen to provide a fair comparison for lipid profiling and would be suitable for screening new or uncharacterized algal strains for which optimal growth conditions are unknown. Therefore, higher lipid content could be expected for some of the strains profiled in this study with proper optimization of growth conditions.
Electronic supplementary material
Supplementary material, approximately 6.66 MB.
Acknowledgments
Funding from the National Research Council’s National Bioproducts Program is gratefully acknowledged. The authors would also like to thank Susanne Penny for assistance with lipid database searching. This is NRC publication no. 54054.
Open Access
This article is distributed under the terms of the Creative Commons Attribution Noncommercial License which permits any noncommercial use, distribution, and reproduction in any medium, provided the original author(s) and source are credited.
References
- 1.Brennan L, Owende P. Biofuels from microalgae—a review of technologies for production, processing, and extractions of biofuels and co-products. Renew Sust Energ Rev. 2010;14:557–577. doi: 10.1016/j.rser.2009.10.009. [DOI] [Google Scholar]
- 2.Hu Q, Sommerfeld M, Jarvis E, Ghirardi M, Posewitz M, Seibert M, Darzins A. Microalgal triacylglycerols as feedstocks for biofuel production: perspectives and advances. Plant J. 2008;54:621–639. doi: 10.1111/j.1365-313X.2008.03492.x. [DOI] [PubMed] [Google Scholar]
- 3.Khan SA, Rashmi HMZ, Prasad S, Banerjee UC. Prospects of biodiesel production from microalgae in India. Renew Sust Energ Rev. 2009;13:2361–2372. doi: 10.1016/j.rser.2009.04.005. [DOI] [Google Scholar]
- 4.Scott SA, Davey MP, Dennis JS, Horst I, Howe CJ, Lea-Smith DJ, Smith AG. Biodiesel from algae: challenges and prospects. Curr Opin Biotechnol. 2010;21:277–286. doi: 10.1016/j.copbio.2010.03.005. [DOI] [PubMed] [Google Scholar]
- 5.Rodolfi L, Zittelli GC, Bassi N, Padovani G, Biondi N, Bonini G, Tredici MR. Microalgae for oil: strain selection, induction of lipid synthesis and outdoor mass cultivation in a low-cost photobioreactor. Biotechnol Bioeng. 2009;102:100–112. doi: 10.1002/bit.22033. [DOI] [PubMed] [Google Scholar]
- 6.Singh A, Nigam PS, Murphy JD. Renewable fuels from algae: an answer to debatable land based fuels. Biores Technol. 2011;102:10–16. doi: 10.1016/j.biortech.2010.06.032. [DOI] [PubMed] [Google Scholar]
- 7.Peng W, Wu Q, Tu P. Pyrolytic characteristics of heterotrophic Chlorella protothecoides for renewable bio-fuel production. J Appl Phycol. 2001;13:5–12. doi: 10.1023/A:1008153831875. [DOI] [Google Scholar]
- 8.Schenk P, Thomas-Hall S, Stephens E, Marx U, Mussgnug J, Posten C, Kruse O, Hankamer B. Second generation biofuels: high-efficiency microalgae for biodiesel production. Bioenerg Res. 2008;1:20–43. doi: 10.1007/s12155-008-9008-8. [DOI] [Google Scholar]
- 9.Pittman JK, Dean AP, Osundeko O. The potential of sustainable algal biofuel production using wastewater resources. Biores Technol. 2011;102:17–25. doi: 10.1016/j.biortech.2010.06.035. [DOI] [PubMed] [Google Scholar]
- 10.Wang B, Li Y, Wu N, Lan C. CO2 bio-mitigation using microalgae. Appl Microbiol Biot. 2008;79:707–718. doi: 10.1007/s00253-008-1518-y. [DOI] [PubMed] [Google Scholar]
- 11.Bilanovic D, Andargatchew A, Kroeger T, Shelef G. Freshwater and marine microalgae sequestering of CO2 at different C and N concentrations—response surface methodology analysis. Energ Convers Manage. 2009;50:262–267. doi: 10.1016/j.enconman.2008.09.024. [DOI] [Google Scholar]
- 12.Wijffels RH, Barbosa MJ. An outlook on microalgal biofuels. Science. 2010;329:796–799. doi: 10.1126/science.1189003. [DOI] [PubMed] [Google Scholar]
- 13.Chisti Y. Biodiesel from microalgae. Biotechnol Adv. 2007;25:294–306. doi: 10.1016/j.biotechadv.2007.02.001. [DOI] [PubMed] [Google Scholar]
- 14.Williams PJB, Laurens LML. Microalgae as biodiesel & biomass feedstocks: Review & analysis of the biochemistry, energetics & economics. Energy Environ Sci. 2010;3:554–590. doi: 10.1039/b924978h. [DOI] [Google Scholar]
- 15.Durrett TP, Benning C, Ohlrogge J. Plant triacylglycerols as feedstocks for the production of biofuels. Plant J. 2008;54:593–607. doi: 10.1111/j.1365-313X.2008.03442.x. [DOI] [PubMed] [Google Scholar]
- 16.Mansour MP. Reversed-phase high-performance liquid chromatography purification of methyl esters of C16-C28 polyunsaturated fatty acids in microalgae, including octacosaoctaenoic acid [28:8(n−3)] J Chromatogr A. 2005;1097:54–58. doi: 10.1016/j.chroma.2005.08.011. [DOI] [PubMed] [Google Scholar]
- 17.Lin Y-H, Chang F-L, Tsao C-Y, Leu J-Y. Influence of growth phase and nutrient source on fatty acid composition of Isochrysis galbana CCMP 1324 in a batch photoreactor. Biochem Eng J. 2007;37:166–176. doi: 10.1016/j.bej.2007.04.014. [DOI] [Google Scholar]
- 18.Paik M-J, Kim H, Lee J, Brand J, Kim K-R. Separation of triacylglycerols and free fatty acids in microalgal lipids by solid-phase extraction for separate fatty acid profiling analysis by gas chromatography. J Chromatogr A. 2009;1216:5917–5923. doi: 10.1016/j.chroma.2009.06.051. [DOI] [PubMed] [Google Scholar]
- 19.Wang L, Li Y, Chen P, Min M, Chen Y, Zhu J, Ruan RR. Anaerobic digested dairy manure as a nutrient supplement for cultivation of oil-rich green microalgae Chlorella sp. Biores Technol. 2010;101:2623–2628. doi: 10.1016/j.biortech.2009.10.062. [DOI] [PubMed] [Google Scholar]
- 20.Hvattum E. Analysis of triacylglycerols with non-aqueous reversed-phase liquid chromatography and positive ion electrospray tandem mass spectrometry. Rapid Commun Mass Spectrom. 2001;15:187–190. doi: 10.1002/1097-0231(20010215)15:3<187::AID-RCM211>3.0.CO;2-T. [DOI] [PubMed] [Google Scholar]
- 21.Lísa M, Holcapek M. Triacylglycerols profiling in plant oils important in food industry, dietetics and cosmetics using high-performance liquid chromatography-atmospheric pressure chemical ionization mass spectrometry. J Chromatogr A. 2008;1198–1199:115–130. doi: 10.1016/j.chroma.2008.05.037. [DOI] [PubMed] [Google Scholar]
- 22.Herrera LC, Potvin MA, Melanson JE. Quantitative analysis of positional isomers of triacylglycerols via electrospray ionization tandem mass spectrometry of sodiated adducts. Rapid Commun Mass Spectrom. 2010;24:2745–2752. doi: 10.1002/rcm.4700. [DOI] [PubMed] [Google Scholar]
- 23.Acheampong A, Leveque N, Tchapla A, Heron S. Simple complementary liquid chromatography and mass spectrometry approaches for the characterization of triacylglycerols in Pinus koraiensis seed oil. J Chromatogr A. 2011;1218:5087–5100. doi: 10.1016/j.chroma.2011.05.064. [DOI] [PubMed] [Google Scholar]
- 24.Ikeda K, Kubo A, Akahoshi N, Yamada H, Miura N, Hishiki T, Nagahata Y, Matsuura T, Suematsu M, Taguchi R, Ishii I. Triacylglycerol/phospholipid molecular species profiling of fatty livers and regenerated non-fatty livers in cystathionine beta-synthase-deficient mice, an animal model for homocysteinemia/homocystinuria. Anal Bioanal Chem. 2011;400:1853–1863. doi: 10.1007/s00216-011-4703-2. [DOI] [PubMed] [Google Scholar]
- 25.Cui Z, Thomas MJ. Phospholipid profiling by tandem mass spectrometry. J Chromatogr B. 2009;877:2709–2715. doi: 10.1016/j.jchromb.2009.06.034. [DOI] [PubMed] [Google Scholar]
- 26.Sandra K, Pereira AD, Vanhoenacker G, David F, Sandra P. Comprehensive blood plasma lipidomics by liquid chromatography/quadrupole time-of-flight mass spectrometry. J Chromatogr A. 2010;1217:4087–4099. doi: 10.1016/j.chroma.2010.02.039. [DOI] [PubMed] [Google Scholar]
- 27.Byrdwell WC. Dual parallel liquid chromatography with dual mass spectrometry (LC2/MS2) for a total lipid analysis. Front Biosci. 2008;13:100–120. doi: 10.2741/2663. [DOI] [PubMed] [Google Scholar]
- 28.Gonzalvez A, Preinerstorfer B, Lindner W. Selective enrichment of phosphatidylcholines from food and biological matrices using metal oxides as solid-phase extraction materials prior to analysis by HPLC-ESI-MS/MS. Anal Bioanal Chem. 2010;396:2965–2975. doi: 10.1007/s00216-010-3527-9. [DOI] [PubMed] [Google Scholar]
- 29.Li M, Zhou ZG, Nie HG, Bai Y, Liu HW. Recent advances of chromatography and mass spectrometry in lipidomics. Anal Bioanal Chem. 2011;399:243–249. doi: 10.1007/s00216-010-4327-y. [DOI] [PubMed] [Google Scholar]
- 30.Zhao YY, Xiong Y, Curtis JM. Measurement of phospholipids by hydrophilic interaction liquid chromatography coupled to tandem mass spectrometry: the determination of choline containing compounds in foods. J Chromatogr A. 2011;1218:5470–5479. doi: 10.1016/j.chroma.2011.06.025. [DOI] [PubMed] [Google Scholar]
- 31.Lísa M, Cífková E, Holčapek M. Lipidomic profiling of biological tissues using off-line two-dimensional high-performance liquid chromatography-mass spectrometry. J Chromatogr A. 2011;1218:5146–5156. doi: 10.1016/j.chroma.2011.05.081. [DOI] [PubMed] [Google Scholar]
- 32.Ikeda K, Oike Y, Shimizu T, Taguchi R. Global analysis of triacylglycerols including oxidized molecular species by reverse-phase high resolution LC/ESI-QTOF MS/MS. J Chromatogr B. 2009;877:2639–2647. doi: 10.1016/j.jchromb.2009.03.047. [DOI] [PubMed] [Google Scholar]
- 33.Koulman A, Woffendin G, Narayana VK, Welchman H, Crone C, Volmer DA. High-resolution extracted ion chromatography, a new tool for metabolomics and lipidomics using a second-generation orbitrap mass spectrometer. Rapid Commun Mass Spectrom. 2009;23:1411–1418. doi: 10.1002/rcm.4015. [DOI] [PMC free article] [PubMed] [Google Scholar]
- 34.Nie H, Liu R, Yang Y, Bai Y, Guan Y, Qian D, Wang T, Liu H. Lipid profiling of rat peritoneal surface layers by online normal- and reversed-phase 2D LC QToF-MS. J Lipid Res. 2010;51:2833–2844. doi: 10.1194/jlr.D007567. [DOI] [PMC free article] [PubMed] [Google Scholar]
- 35.Armstrong SM, Staples LS, Bauder AG, Craigie JS (2002) Photobioreactor. National Research Council of Canada, Canadian patent application no. 2394518
- 36.Guilard RRL, Ryther JH. Studies of marine planktonic diatoms. I. Cyclotella nana Hustedt and Detonula confervacea Cleve. Can J Microbiol. 1962;8:229–239. doi: 10.1139/m62-029. [DOI] [PubMed] [Google Scholar]
- 37.Fahy E, Sud M, Cotter D, Subramaniam S. LIPID MAPS online tools for lipid research. Nucl Acids Res. 2007;35:W606–W612. doi: 10.1093/nar/gkm324. [DOI] [PMC free article] [PubMed] [Google Scholar]
- 38.Banerjee A, Sharma R, Chisti Y, Banerjee UC. Botryococcus braunii: a renewable source of hydrocarbons and other chemicals. Crit Rev Biotechnol. 2002;22:245–279. doi: 10.1080/07388550290789513. [DOI] [PubMed] [Google Scholar]
- 39.Brenton AG, Godfrey AR. Accurate mass measurement: terminology and treatment of data. J Am Soc Mass Spectrom. 2010;21:1821–1835. doi: 10.1016/j.jasms.2010.06.006. [DOI] [PubMed] [Google Scholar]
Associated Data
This section collects any data citations, data availability statements, or supplementary materials included in this article.
Supplementary Materials
Supplementary material, approximately 6.66 MB.


