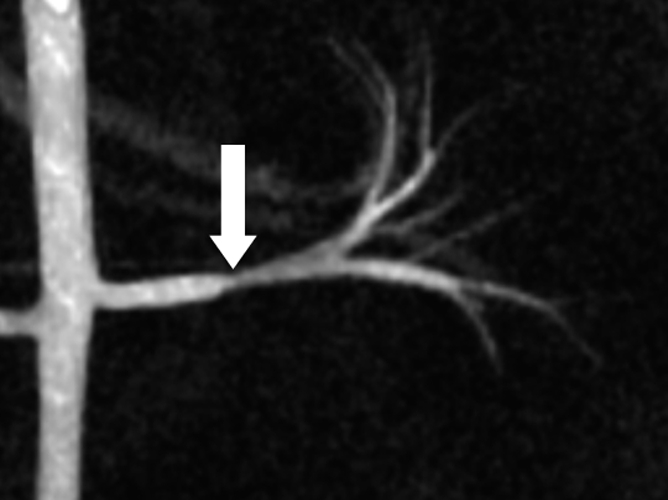
Figure 1b:

Porcine model of RAS at unenhanced phase-contrast VIPR MR angiography (pig 4). (a) DSA road-map image shows two endovascular pressure-sensing guidewires across a moderate left RAS (solid arrow). Pressure sensors are located at the end of each wire (open arrows). (b) Angiographic maximum intensity projection reconstruction of the complex difference signal obtained from phase-contrast VIPR MR shows stenosis (arrow). (c) Velocity map shows increased velocities (open arrow, color coded in gold and red) distal to RAS (solid arrow). (d) Corresponding pressure (P) map shows a pressure drop across the stenosis (arrow) (Movie [online]).
