

Abstract
The symbiosis (Sym) and pathogenesis (Pat) is a duality problem of microbial infection, including HIV/AIDS. Statistical analysis of inequalities and duality in gene coexpression networks (GCNs) of HIV-1 infection may gain novel insights into AIDS. In this study, we focused on analysis of GCNs of uninfected subjects and HIV-1-infected patients at three different stages of viral infection based on data deposited in the GEO database of NCBI. The inequalities and duality in these GCNs were analyzed by the combination of the double-connectivity (DC) approach and the Gini's method. DC analysis reveals that there are significant differences between positive and negative connectivity in HIV-1 stage-specific GCNs. The inequality measures of negative connectivity and edge weight are changed more significantly than those of positive connectivity and edge weight in GCNs from the HIV-1 uninfected to the AIDS stages. With the permutation test method, we identified a set of genes with significant changes in the inequality and duality measure of edge weight. Functional analysis shows that these genes are highly enriched for the immune system, which plays an essential role in the Sym-Pat duality (SPD) of microbial infections. Understanding of the SPD problems of HIV-1 infection may provide novel intervention strategies for AIDS.
1. Introduction
Gene coexpression networks (GCNs), which provide a system-level understanding of the functionality of genes, have been used for the pathogenesis research of various diseases, including Alzheimer's disease [1, 2], cardiac hypertrophy and failure [3], obesity [4], and schizophrenia [5]. In the GCN, each node represents a gene, and the edge links two coexpressed genes. The edge weight is usually determined with the similarity of gene expression profiles using the Pearson correlation coefficient (PCC) method [6–8]. The connectivity of a gene is typically defined as the number of its corresponding edges and can be decomposed into two components: positive and negative connectivity, according to the algebraic sign of PCC value [6]. Statistical analysis of the inequality and duality properties of GCNs is extremely valuable for discovering novel biological insights [8–12].
Microbial infections, including HIV-1/AIDS, always involve symbiosis (Sym) and pathogenesis (Pat), which are the two sides of the same story [13]. The inequalities or imbalance in the Sym-Pat duality may be the key problems in microbial infection. HIV-1/AIDS is a very complex disease affecting millions of individuals throughout the world. Although substantial progress has been made in the fighting against this disease since 1981, the mechanisms of HIV-1 infection are still not fully understood [14–16]. In this study, we propose to define the inequalities and duality in gene expression patterns of HIV-1 infection using the Gini's method. Based on a previously published microarray dataset [17], we analyzed GCNs of the uninfected subjects and HIV-1-infected patients at the acute, the asymptomatic, and the AIDS stages. With the Gini's method, we quantified the inequalities of connectivity and edge weight in these HIV-1 stage-specific GCNs. The analysis results show that there are significant differences between positive and negative coexpression links in these GCNs. With the proposed permutation test method, we further considered the changes of the Gini coefficient of positive and negative edge weight (denoted as, ΔG+ and ΔG−, resp.) in two different GCNs. We finally identify a set of genes with significant ΔG+ or ΔG− among GCNs of the uninfected subjects and HIV-1 patients at three different stages (i.e., the acute, the asymptomatic, and the AIDS stages). These genes might be highly involved in the pathogenesis of HIV-1 disease. More importantly, several patterns of duality in inequalities in GCNs are also revealed with the Gini's method. Some duality patterns might be related to the Sym-Pat duality (SPD) in HIV-1 infection [13].
2. Materials and Methods
2.1. Microarray Dataset
The microarray dataset used in this study is a published HIV-1 microarray dataset (Gene Expression Omnibus GEO GSE16363), which contains Affymetrix gene expression profiles of human lymphatic tissues from the uninfected (unin) subjects and infected patients at the different stages of HIV-1 infection (the acute (acut), the asymptomatic (asym), and the AIDS stages). In total, this dataset consists of 52 samples measuring 54630 probe sets. Details about this dataset are available in the original paper [17]. The differences in gene expression between different settings were analyzed using the two-sample t test and fold change methods. With the criteria of P-value ≤ 0.05 and fold change ≥ 1.7, 962 probes with significantly different expression have already been picked up by Li and colleagues [17]. These probes were further grouped into several functional categories with the annotation information from the NetAffx Analysis Center (http://www.affymetrix.com/analysis/index.affx), Ingenuity Pathways Analysis (Ingenuity Systems, http://www.ingenuity.com/), and literature examination. To avoid underestimate inequalities in GCNs, we further removed the probes which were not annotated with Entrez gene identifiers, or were mapped to multiple Entrez gene identifiers. We finally obtained 908 probes (704 genes) for the construction of GCNs.
2.2. GCN Construction
With the log2-transformed gene expression values of these 704 genes, we constructed four GCNs (denoted as Nunin, Nacut, Nasym, and NAIDS) for the uninfected subjects and three different stages (the acute, asymptomatic and AIDS) of HIV-1-infected patients, respectively. The PCC method is used to compute the similarity of expression profiles between any pair of genes. Take the gene expression from the uninfected subjects, for example, the PCC value between genes A and B can be computed:
| (1) |
where ai represents the log2-transformed gene expression of gene A in the ith subject, whereas bi is the log2-transformed gene expression of gene B in the ith subject. am represents the mean of log2-transformed gene expression of gene A, and bm represents the mean of log2-transformed gene expression of gene B. The significance level of PCC value is estimated with the statistic result of under the Student's t-distribution with df = n − 2 (n is the sample number). The PCC value is assigned as the edge weight of these two genes. For genes with multiple probes, only the highest absolute value of PCC is chosen for the edge weight.
2.3. Inequality Measurements
The inequalities in GCNs are measured with the Gini's method, which has been commonly used in the economics and social science [18–20]. One of the basic measures of the Gini's method is the Gini coefficient (also known as Gini index), which has been well defined for quantifying variable inequalities in a population. For a given variable X, the Gini coefficient can be computed with the formula [21]
| (2) |
where n (n ≥ 2) is the number of considered variable in the population, and X(i) is the ith value of considered variable sorted in increasing order, 0 ≤ X(1) ≤ X(2) ≤ ⋯≤X(n). The Gini coefficient can be ranged from 0.0 (complete equality) to 1.0 (complete or absolute inequality). We assigned the Gini coefficient to be 0.0 if n is one. In this study, the Gini coefficient was used to measure several kinds of inequalities in GCNs, such as the positive and negative edge weight inequality of each gene in the GCN, the positive and negative connectivity inequality of the whole GCN. For the positive edge weight inequality, the variable X is the positive edge weight of the analyzed gene in the GCN. While for the negative edge weight inequality, the variable X should be the absolute value of negative edge weight. For the positive (or negative) connectivity inequality, the variable X is the positive (or negative) connectivity of the analyzed genes.
As referred in the previous section, the connectivity in the GCN includes two components: the positive connectivity and the negative connectivity. The contribution of the positive and the negative connectivity to the overall inequality in the GCN can be quantified with the Gini correlation [22]. Let (Pi, Ni) represent the positive and the negative connectivity of the ith gene in a given GCN. The Gini correlation of the positive connectivity (Rp) can be calculated with the following formula [23]
| (3) |
where k is the number of analyzed genes, P(i) and P[i] are obtained by two different ways. For P(i), the positive connectivities of analyzed genes are firstly sorted in an ascending order, then the P(i) is used to represent the ith positive connectivity sorted in this order. Whereas for P[i], the connectivities of analyzed genes are firstly sorted in an increasing order, then the P[i] is used to represent the concomitant positive connectivity of ith connectivity. The Gini correlation can be ranged from −1.0 to 1.0. If the Gini correlation is higher than zero, the positive connectivity increases the overall inequality of connectivity in GCNs. Otherwise if the Gini correlation is lower than zero, the positive connectivity decreases the overall inequality of connectivity in GCNs. The Gini correlation of negative connectivity (RN) can also be calculated similarly with the formula (3).
2.4. Estimation of Significance Levels of ΔG+ and ΔG−
For a given gene i in two GCNs (N1 and N2), the ΔG+ and ΔG− can be, respectively, computed with the following formulas:
| (4) |
where G+(Nj, i) and G−(Nj, i) represent the Gini coefficients of positive and negative edge weight in the Nj (j = 1 or 2), respectively. In this study, N1 is the Nunin, and N2 could be Nacut, Nasym, or NAIDS.
Genes with significant ΔG+ or ΔG− might play important roles in the pathogenesis of HIV-1 infection. Here we utilized a formal permutation test method to determine the statistical significance of ΔG+ and ΔG−. Take the Nunin and Nacut for example, we firstly generated 2000 randomized GCNs for the uninfected (unin) subjects and the HIV-1-infected patients at the acute stage (acut), respectively. The expression values of genes in randomized Nunin (or Nacut) were randomly selected from all the gene expression values of the uninfected subjects (or the patients at the acute stage) on the chip. We then, respectively, obtained 2 001 000 (2000∗(2000 + 1)/2) permutations of ΔG+(Nacut/Nunin) and ΔG−(Nacut/Nunin). We considered the ΔG+ (or ΔG−) significantly changed if the observed value above 0.5% (or below 99.5%) of permutations (two-sided P-value < 0.01). The significance level of ΔG+ and ΔG− for genes changing from Nunin to Nasym (or NAIDS) can also be similarly estimated with this formal permutation test method.
3. Results
3.1. Dual Positive and Negative Connectivity in GCNs of HIV-1 Infection
The dual positive and negative connectivity of genes in GCNs of HIV-1 infection are shown in Figure 1. It can be seen from Figure 1 that the positive connectivity is different from negative connectivity in GCNs for the uninfected subjects and HIV-1-infected patients at the acute, the asymptomatic, and the AIDS stages. From Nunin to NAIDS, there are, respectively, 81%, 96%, 98%, and 67% genes with higher positive connectivity. This result indicates that statistical analysis of the positive and negative connectivity in these GCNs would be helpful for further understanding the pathogenic mechanisms of HIV-1 infection.
Figure 1.
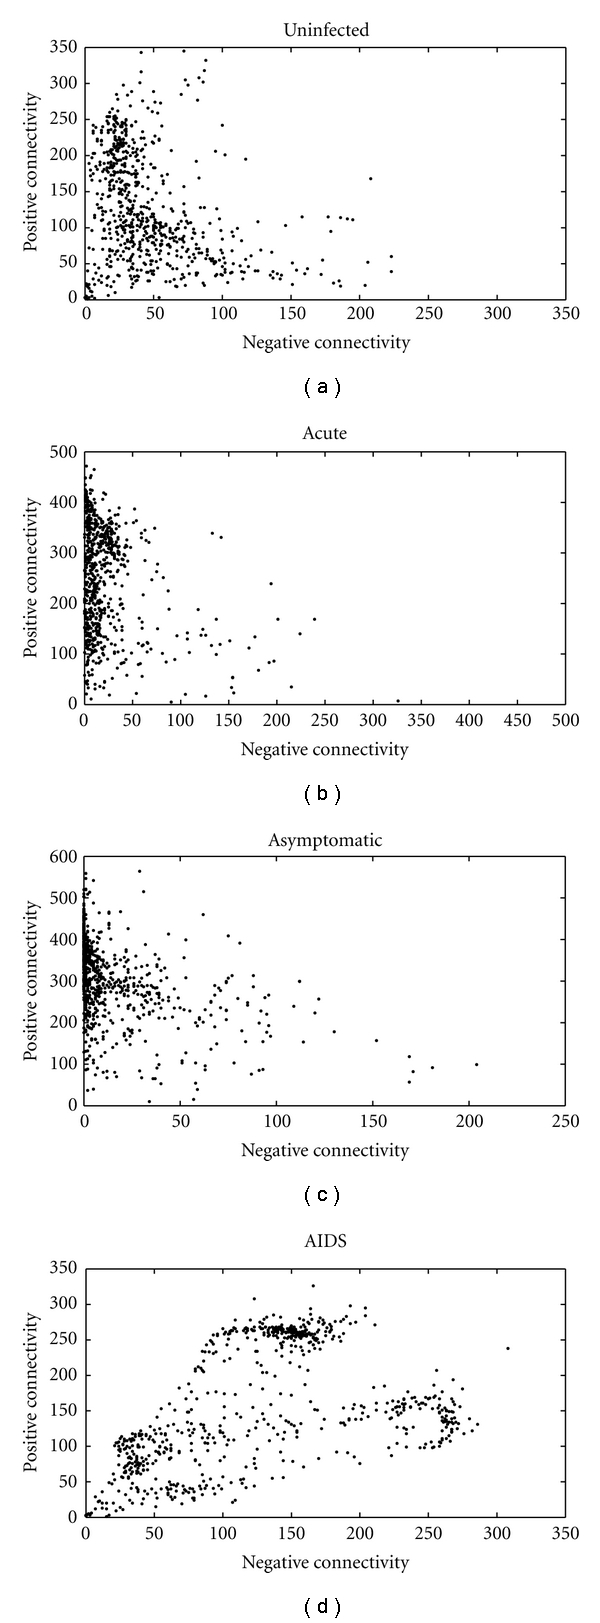
The dual positive-negative connectivity of genes in GCNS of the uninfected subjects (a), and infected patients at the acute (b), the asymptomatic (c), and the AIDS (d) stages. Each dot represents a gene in the GCN.
3.2. Connectivity Inequality in GCNs of HIV-1 Infection
In this study, we statistically analyzed the inequalities of the positive and negative connectivity with the Gini coefficient measure. According to the results shown in Figure 2(a), we find that the there are also remarkable differences between the Gini coefficients of positive and negative connectivity in Nacut and Nasym. Furthermore, the dynamic changes in the negative connectivity inequalities are different from those in the positive connectivity inequalities during HIV-1 infection. From the Nunin to NAIDS, the Gini coefficient of negative connectivity is firstly increased from 0.39 to 0.70, and then decreased to 0.33 while the Gini coefficient of positive connectivity is firstly decreased from 0.34 to 0.19, and then increased to 0.31 (Figure 2(a)). The differences in the dynamic changes in the Gini coefficients of positive and negative connectivity are also observed for genes with different functions (Supplementary material is available online at doi:10.1155/2011/926407 (Figure S1)).
Figure 2.
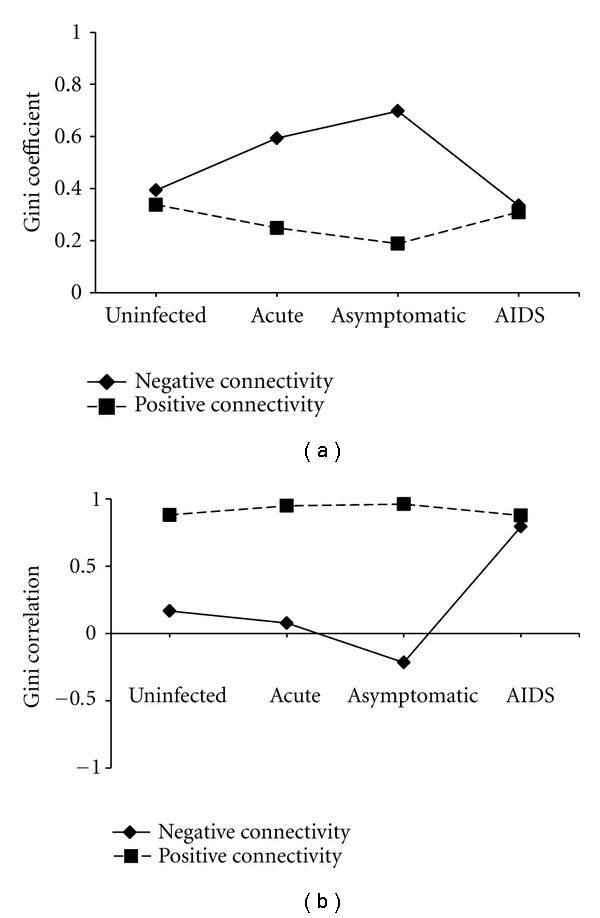
The Gini coefficients and Gini correlations of positive and negative connectivity in GCNs of the uninfected subjects and HIV-1 patients at three different stages (acute, asymptomatic, and AIDS).
With the Gini correlation measure, we further quantified the contribution of positive and negative connectivity to the overall inequality of connectivity in GCNs (Figure 2(b)). From the uninfected to the different stages of HIV-1 infection, the Gini correlation of negative connectivity is changed more significantly than that of positive connectivity. The similar results are also observed for genes with different functions (Supplementary Figure S2). These results indicate that positive and negative coexpression links might play different roles in the pathogenesis of HIV-1 infection.
3.3. Edge Weight Inequality in GCNs of HIV-1 Infection
The differences between positive and negative coexpression links are also revealed by analyzing the edge weight inequality with the Gini's method (Figure 3). With the proposed permutation test method, we further identified a set of genes with significant ΔG+ or ΔG− between GCNs of the uninfected subjects and infected patients at different stages (Figure 4). Compared with the number of gene with significant ΔG+, the number of genes with significant ΔG− is relatively large, also indicating the differences in inequality between positive and negative coexpression links.
Figure 3.
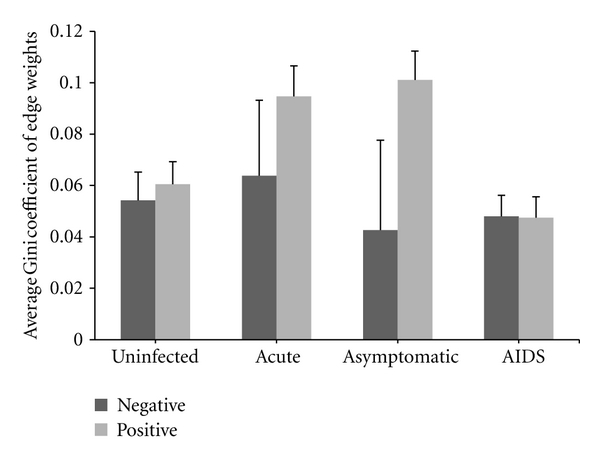
Average Gini coefficient of positive and negative edge weights for genes in GCNs. “Negative” and “Positive” represent the negative and positive edge weights, respectively.
Figure 4.
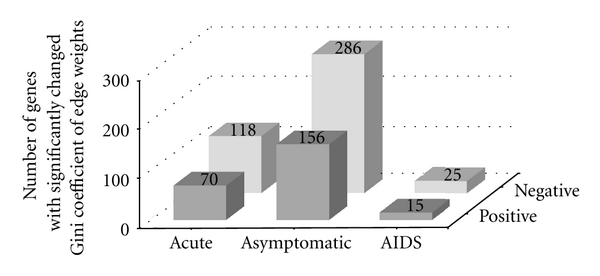
The number of genes with significant ΔG+ or ΔG− among GCNs of the uninfected subjects and HIV-1 patients at three different stages (acute, asymptomatic, and AIDS). “Positive” and “Negative” indicate the Gini coefficients of positive and negative edge weight, respectively.
Further investigating the function information of genes with significant ΔG+ or ΔG−, we find that they are enriched with the immune genes (Figure 5). Among these immune genes, 5 immune activation genes (e.g., WDHD1, CDC45L, FOXP1, ING5 and FBXO5) and 4 immune defense genes (e.g., CD244, IFI35, PNPT1, and C1QBP) are statistically significant between GCNs of the uninfected subjects and all the infected patients at three different stages. The important roles of CD244 (2B4) and C1QBP (p32) in HIV-1 infection have already been demonstrated in previous studies [24, 25], indicating that these selected genes might be highly involved in HIV-1 infection.
Figure 5.
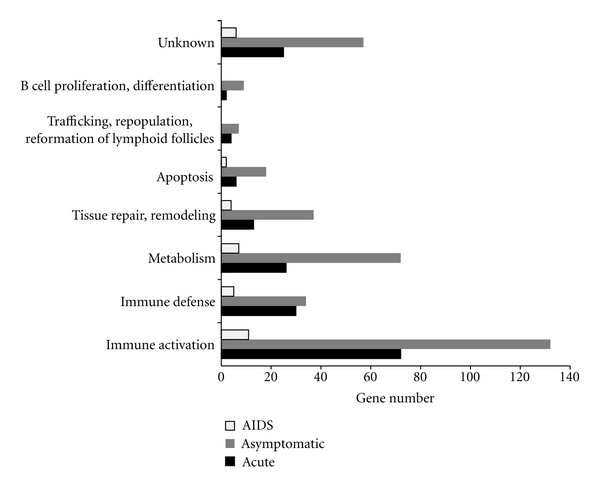
Functional categories of genes with significant ΔG+ or ΔG− between GCNs of the uninfected subjects and HIV-1 patients at three different stages (acute, asymptomatic, and AIDS).
4. Discussion
This is the first report on the analysis of the inequalities of dual connectivity and edge weight in GCNs of HIV-1 infection using the PCC-based double-connectivity approach [6] and Gini's method [21, 22]. We not only found the differences between the uninfected subjects and patients at different stages of HIV-1 infection at a system level, but also identified a set of genes which might be highly involved in HIV-1 infection. These results also demonstrate the importance of the inequalities in GCNs for the analysis of HIV-1 disease. Furthermore, most importantly, changes in duality patterns are revealed in this study (Figures 1–4), suggesting that the inequalities or imbalance in SPD may contribute to the pathogenesis of HIV-1/AIDS.
The SPD, which is extending along the dynamic continuum from antagonism to cooperation, is the most common fundamental feature of microbial infections [13]. When the Sym is much more dominant than Pat, the relationship between host and microbial community is cooperative. When the Pat is much more dominant than Sym, the relationship is antagonistic. Therefore, the Sym and Pat are the two sides of the same coin in the microbial infections, which reflect the relationships between microorganisms and hosts. About 1% of the total HIV-1-infected people in the world (long-term nonprogressors) remain high CD4+ and CD8+ T-cell counts without progressing to AIDS [26]. Natural infection of Simian immunodeficiency viruses (SIVs) of African nonhuman primates also does not progress to AIDS [27]. The benign nature of HIV infection in the long-term nonprogressors and SIV infection in the natural hosts suggests that there is a good tethering connection between Sym and Pat. The immune system plays an essential role in the modulation of SPD [13]. The immune system has a double-sided function. On one hand, it protects the host against the invasion of microbial pathogens. But, on the other hand, the immune system imbalance may cause tissue damage and disturbance of microbiota. The gut microbial translocation and persistent immune activation leading to a progressive depletion of Th17+ and CD4+ cells are the key contributing factors to drive HIV-1 disease progression [28, 29]. We, therefore, further considered the correlation between expression values of immune genes and the CD4+ T cell count. The average PCC values of immune activation and immune defense genes at HIV-1 infection stages are shown in Figure 6. For immune activation genes, the average PCC values of the HIV-1 infected patients at different stages are higher than those of uninfected subjects, and higher than zero (Figures 6(a) and 6(c)). While for immune defense genes, the average PCC values at HIV-1 infected stages (except the average PCC value of genes with significant ΔG+ at the AIDS stage) are lower than zero (Figures 6(b) and 6(d)). Most interestingly, the duality patterns of the changes in immune genes are opposite or significantly different between the patients at the acute and AIDS stages. Immune activation genes with significant ΔG+ and ΔG− show a highly positive correlation with CD4 cell counts at the acute and AIDS stages, respectively. However, immune defense genes with significant ΔG+ exhibit an opposite correlation with CD4 cell counts at the acute (negative) and AIDS (positive) stages, respectively. These findings suggest that these immune activation and defense genes may play important roles in the pathogenesis of HIV-1/AIDS. Concurring with the current report, some of those genes, including C1QBP (p32), CD28, CD44, APOBEC3F (A3F), and ISG15, have been known to contribute to the pathogenesis of this disease [25, 30–33]. Further studies of those genes should be enabled to gain more insights into the HIV/AIDS problems.
Figure 6.
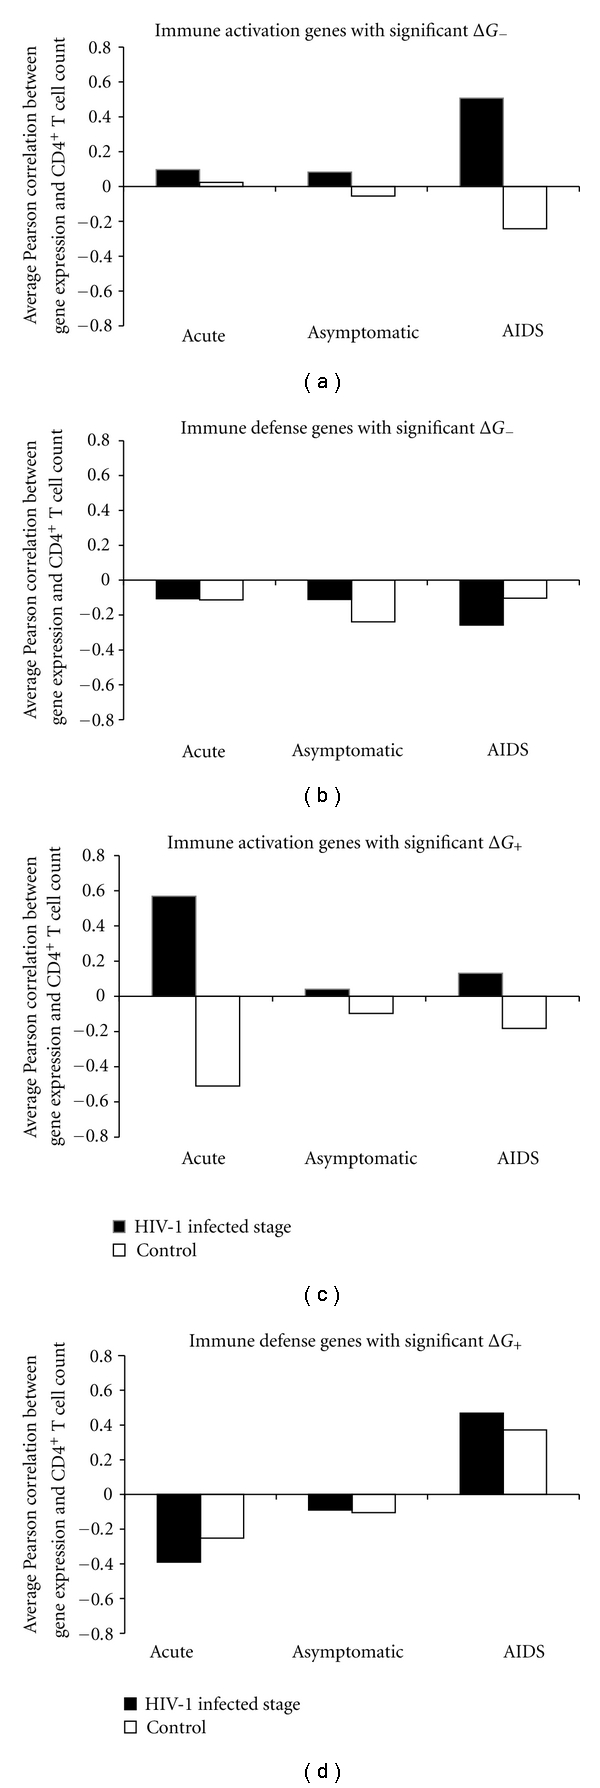
Average Pearson correlation between gene expression and CD4+ T cell count. “HIV-1 infected stage” indicates immune activation (or defense) genes at the HIV-1 infected stages (i.e., the acute, the asymptomatic and the AIDS stage). “Control” represents the corresponding immune genes in the HIV-1-uninfected subjects.
5. Conclusion
This study provides a novel view of coexpression network characteristics in HIV-1 infection. The selected genes might be highly involved in the pathogenesis of HIV-1 infection. Our results also indicate that there might be a duality in the HIV infection. These results also show the effectiveness of GCN analysis and the Gini's method in investigating the mechanisms of HIV infection.
Conflict of Interests
The authors declare that they have no competing interests.
Supplementary Material
Supplementary Figure 1: The Gini coefficients of positive and negative connectivity for genes with different functions in GCNs of the uninfected subjects and HIV-1-infected patients at different stages.
Supplementary Figure 2: The Gini correlation of positive and negative connectivity for genes with different function in GCNs of the uninfected subjects, and infected patients at the different stages.
Acknowledgments
The authors would like to thank Dr. Ting Chen and Dr. Grace Aldrovandi for critical reading of the manuscript. This work was funded by a grant from the Bill & Melinda Gates Foundation throughthe Grant Challenges Explorations Initiative.
References
- 1.Ray M, Zhang W. Analysis of Alzheimer’s disease severity across brain regions by topological analysis of gene co-expression networks. BMC Systems Biology. 2010;4, 136 doi: 10.1186/1752-0509-4-136. [DOI] [PMC free article] [PubMed] [Google Scholar]
- 2.Miller JA, Horvath S, Geschwind DH. Divergence of human and mouse brain transcriptome highlights Alzheimer disease pathways. Proceedings of the National Academy of Sciences of the United States of America. 2010;107(28):12698–12703. doi: 10.1073/pnas.0914257107. [DOI] [PMC free article] [PubMed] [Google Scholar]
- 3.Dewey FE, Perez MV, Wheeler MT, et al. Gene coexpression network topology of cardiac development, hypertrophy, and failure. Circulation. 2011;4(1):26–35. doi: 10.1161/CIRCGENETICS.110.941757. [DOI] [PMC free article] [PubMed] [Google Scholar]
- 4.Walley AJ, Jacobson P, Falchi M, et al. Differential coexpression analysis of obesity-associated networks in human subcutaneous adipose tissue. doi: 10.1038/ijo.2011.22. International Journal of Obesity. In press. [DOI] [PMC free article] [PubMed] [Google Scholar]
- 5.Torkamani A, Dean B, Schork NJ, Thomas EA. Coexpression network analysis of neural tissue reveals perturbations in developmental processes in schizophrenia. Genome Research. 2010;20(4):403–412. doi: 10.1101/gr.101956.109. [DOI] [PMC free article] [PubMed] [Google Scholar]
- 6.Gustin MP, Paultre CZ, Random J, Bricca G, Cerutti C. Functional meta-analysis of double connectivity in gene coexpression networks in mammals. Physiological Genomics. 2008;34(1):34–41. doi: 10.1152/physiolgenomics.00008.2008. [DOI] [PubMed] [Google Scholar]
- 7.Mao L, van Hemert JL, Dash S, Dickerson JA. Arabidopsis gene co-expression network and its functional modules. BMC Bioinformatics. 2009;10, article 346 doi: 10.1186/1471-2105-10-346. [DOI] [PMC free article] [PubMed] [Google Scholar]
- 8.Horvath S, Dong J. Geometric interpretation of gene coexpression network analysis. PLoS Computational Biology. 2008;4(8) doi: 10.1371/journal.pcbi.1000117. Article ID e1000117. [DOI] [PMC free article] [PubMed] [Google Scholar]
- 9.Teschendorff AE, Severini S. Increased entropy of signal transduction in the cancer metastasis phenotype. BMC Systems Biology. 2010;4, article 104 doi: 10.1186/1752-0509-4-104. [DOI] [PMC free article] [PubMed] [Google Scholar]
- 10.Nayak RR, Kearns M, Spielman RS, Cheung VG. Coexpression network based on natural variation in human gene expression reveals gene interactions and functions. Genome Research. 2009;19(11):1953–1962. doi: 10.1101/gr.097600.109. [DOI] [PMC free article] [PubMed] [Google Scholar]
- 11.Choi JK, Yu U, Yoo OJ, Kim S. Differential coexpression analysis using microarray data and its application to human cancer. Bioinformatics. 2005;21(24):4348–4355. doi: 10.1093/bioinformatics/bti722. [DOI] [PubMed] [Google Scholar]
- 12.Ma SG, Shi MY, Li Y, Yi DH, Shia BC. Incorportating gene co-expression network in identification of cancer prognosis markers. BMC Bioinformatics. 2010;11, article 271 doi: 10.1186/1471-2105-11-271. [DOI] [PMC free article] [PubMed] [Google Scholar]
- 13.Huang SH, Zhou W, Jong A. Focal point theory models for dissecting dynamic duality problems of microbial infections. Journal of Biomedicine and Biotechnology. 2008;2008(1):8 pages. doi: 10.1155/2008/856314. Article ID 856314. [DOI] [PMC free article] [PubMed] [Google Scholar]
- 14.Moir S, Chun TW, Fauci AS. Pathogenic mechanisms of HIV disease. Annual Review of Pathology. 2011;6:223–248. doi: 10.1146/annurev-pathol-011110-130254. [DOI] [PubMed] [Google Scholar]
- 15.Permanyer M, Ballana E, Este JA. Endocytosis of HIV: anything goes. Trends in Microbiology. 2010;18(12):543–551. doi: 10.1016/j.tim.2010.09.003. [DOI] [PubMed] [Google Scholar]
- 16.Fellay J, Shianna KV, Telenti A, Goldstein DB. Host genetics and HIV-1: the final phase? PLoS Pathogens. 2010;6(10) doi: 10.1371/journal.ppat.1001033. Article ID e1001033. [DOI] [PMC free article] [PubMed] [Google Scholar]
- 17.Li Q, Smith AJ, Schacker TW, et al. Microarray analysis of lymphatic tissue reveals stage-specific, gene expression signatures in HIV-1 infection. Journal of Immunology. 2009;183(3):1975–1982. doi: 10.4049/jimmunol.0803222. [DOI] [PMC free article] [PubMed] [Google Scholar]
- 18.Kondo N, Sembajwe G, Kawachi I, van Dam RM, Subramanian SV, Yamagata Z. Income inequality, mortality, and self rated health: meta-analysis of multilevel studies. British Medical Journal. 2009;339 doi: 10.1136/bmj.b4471. Article ID b4471. [DOI] [PMC free article] [PubMed] [Google Scholar]
- 19.Jackson AL, Davies CA, Leyland AH. Do differences in the administrative structure of populations confound comparisons of geographic health inequalities? BMC Medical Research Methodology. 2010;10, article 74 doi: 10.1186/1471-2288-10-74. [DOI] [PMC free article] [PubMed] [Google Scholar]
- 20.Munga MA, Mæstad O. Measuring inequalities in the distribution of health workers: the case of Tanzania. Human Resources for Health. 2009;7, article 4 doi: 10.1186/1478-4491-7-4. [DOI] [PMC free article] [PubMed] [Google Scholar]
- 21.Glasser GJ. Variance formulas for the mean difference and coefficient of concentration. Journal of the American Statistical Association. 1962;57(299):648–654. [Google Scholar]
- 22.Schechtman E, Yitzhaki S. On the proper bounds of the Gini correlation. Economics Letters. 1999;63(2):133–138. [Google Scholar]
- 23.Xu WC, Hung YS, Niranjan M, Shen MF. Asymptotic mean and variance of Gini correlation for bivariate normal samples. IEEE Transactions on Signal Processing. 2010;58(2):522–534. [Google Scholar]
- 24.Aldy KN, Horton NC, Mathew PA, Mathew SO. 2B4+ CD8+ T cells play an inhibitory role against constrained HIV epitopes. Biochemical and Biophysical Research Communications. 2011;405(3):503–507. doi: 10.1016/j.bbrc.2011.01.062. [DOI] [PMC free article] [PubMed] [Google Scholar]
- 25.Zheng YH, Yu HF, Peterlin BM. Human p32 protein relieves a post-transcriptional block to HIV replication in murine cells. Nature Cell Biology. 2003;5(7):611–618. doi: 10.1038/ncb1000. [DOI] [PubMed] [Google Scholar]
- 26.Saksena NK, Rodes B, Wang B, Soriano V. Elite HIV controllers: myth or reality? AIDS Reviews. 2007;9(4):195–207. [PubMed] [Google Scholar]
- 27.Silvestri G, Paiardini M, Pandrea I, Lederman MM, Sodora DL. Understanding the benign nature of SIV infection in natural hosts. Journal of Clinical Investigation. 2007;117(11):3148–3154. doi: 10.1172/JCI33034. [DOI] [PMC free article] [PubMed] [Google Scholar]
- 28.Weiss L, Piketty C, Assoumou L, et al. Relationship between regulatory T cells and immune activation in human immunodeficiency virus-infected patients interrupting antiretroviral therapy. PLoS ONE. 2010;5(7) doi: 10.1371/journal.pone.0011659. Article ID e11659. [DOI] [PMC free article] [PubMed] [Google Scholar]
- 29.Ancuta P, Monteiro P, Sekaly RP. Th17 lineage commitment and HIV-1 pathogenesis. Current Opinion in HIV and AIDS. 2010;5(2):158–165. doi: 10.1097/COH.0b013e3283364733. [DOI] [PubMed] [Google Scholar]
- 30.Natarajan M, August A, Henderson AJ. Combinatorial signals from CD28 differentially regulate human immunodeficiency virus transcription in T cells. Journal of Biological Chemistry. 2010;285(23):17338–17347. doi: 10.1074/jbc.M109.085324. [DOI] [PMC free article] [PubMed] [Google Scholar]
- 31.Giordanengo V, Limouse M, Doglio A, Lesimple J, Lefebvre JC. Alteration of CD44 expression in HIV type 1-infected T cell lines. AIDS Research and Human Retroviruses. 1996;12(17):1615–1622. doi: 10.1089/aid.1996.12.1615. [DOI] [PubMed] [Google Scholar]
- 32.Albin JS, LaRue RS, Weaver JA, et al. A single amino acid in human APOBEC3F alters susceptibility to HIV-1 Vif. Journal of Biological Chemistry. 2010;285(52):40785–40792. doi: 10.1074/jbc.M110.173161. [DOI] [PMC free article] [PubMed] [Google Scholar]
- 33.Okumura A, Lu G, Rowe IP, Pitha PM. Innate antiviral response targets HIV-1 release by the induction of ubiquitin-like protein ISG15. Proceedings of the National Academy of Sciences of the United States of America. 2006;103(5):1440–1445. doi: 10.1073/pnas.0510518103. [DOI] [PMC free article] [PubMed] [Google Scholar]
Associated Data
This section collects any data citations, data availability statements, or supplementary materials included in this article.
Supplementary Materials
Supplementary Figure 1: The Gini coefficients of positive and negative connectivity for genes with different functions in GCNs of the uninfected subjects and HIV-1-infected patients at different stages.
Supplementary Figure 2: The Gini correlation of positive and negative connectivity for genes with different function in GCNs of the uninfected subjects, and infected patients at the different stages.